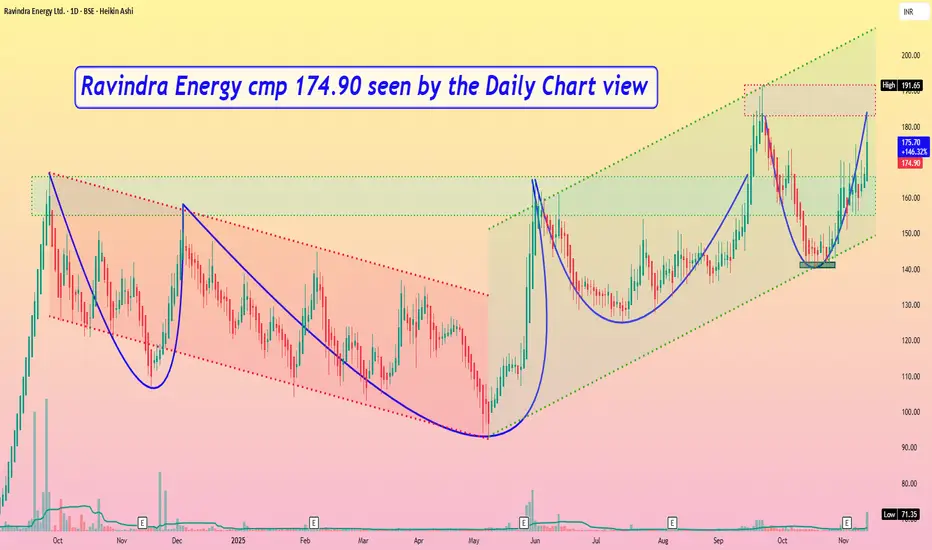
Ravindra Energy cmp 174.90 by Daily Chart viewRavindra Energy cmp 174.90 by Daily Chart view
- Support Zone 155 to 166 Price Band
- Resistance Zone 183 to ATH 191.60 Price Band
- Bullish Triple Bottom formed at 140 to 142 price band
- Repeated Bullish Rounding Bottoms with considerate VCP too
- Volumes spiking in good numbers intermittently over past few weeks
Supportresistancelevels
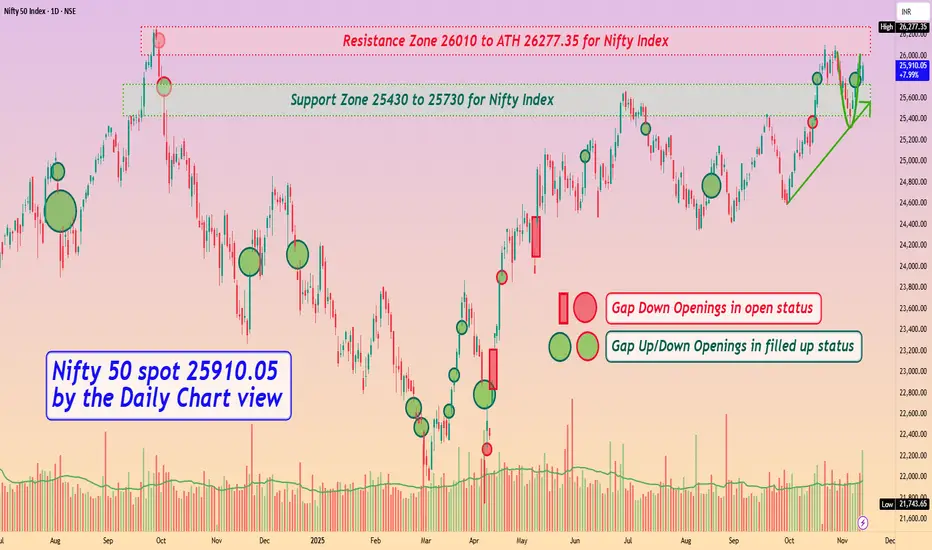
Nifty 50 spot 25910.05 by Daily Chart view - Weekly UpdateNifty 50 spot 25910.05 by Daily Chart view - Weekly Update
- Support Zone 25430 to 25730 for Nifty Index
- Resistance Zone 26010 to ATH 26277.35 for Nifty Index
- Rising Support Trendline seems respected by weekly positive closure
- Rounding Bottom Bullish momentum by Resistance Zone neckline seems sustained
- Nifty timidly shy from creating a New Lifetime High by crossing ATH final hurdle remains effectively elusive
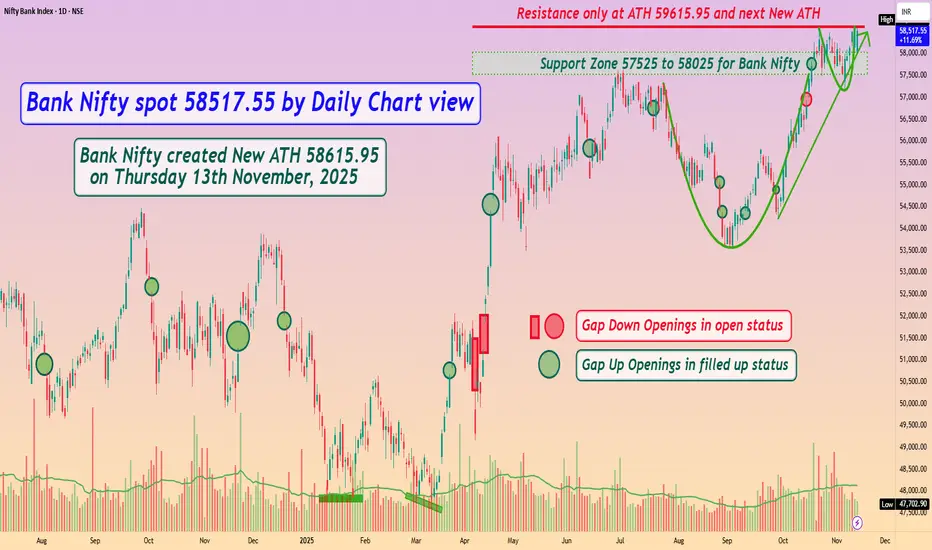
Bank Nifty spot 58517.55 by Daily Chart view - Weekly UpdateBank Nifty spot 58517.55 by Daily Chart view - Weekly Update
- Support Zone 57525 to 58025 for Bank Nifty
- Resistance only at ATH 59615.95 and next New ATH
- Bank Nifty created New ATH 58615.95 on Thursday 13th November, 2025
- Bullish momentum of Rounding Bottoms by Support Zone and Resistance Zone necklines well sustained
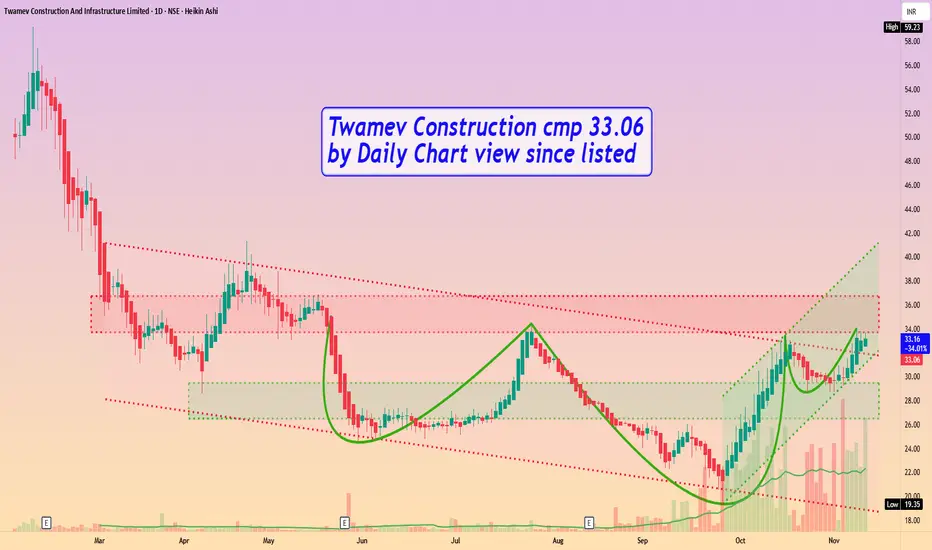
Twamev Construction cmp 33.06 by Daily Chart view since listedTwamev Construction cmp 33.06 by Daily Chart view since listed
- Support Zone 26.50 to 29.50 Price Band
- Resistance Zone 33.75 to 36.75 Price Band
- Back to back Bullish Rounding Bottom patterns
- Strong Uptrend momentum seen with Rising Price Channel
- Falling Price Channel Breakout done by the demand based buying
- Heavy Volumes enabled Breakout attempts observed from Resistance Zone
Sambhv Steel Tubes cmp 121.45 by the Daily Chart since listedSambhv Steel Tubes cmp 121.45 by the Daily Chart since listed
- Support Zone 107 to 116 Price Band
- Breakout done from the Falling Price Channel
- Rising Price Channel taking upside momentum
- Volumes gradually picking up indicating continued uptrend
- Resistance Zone 125 to 135 Price Band then 142 to ATH 149.25

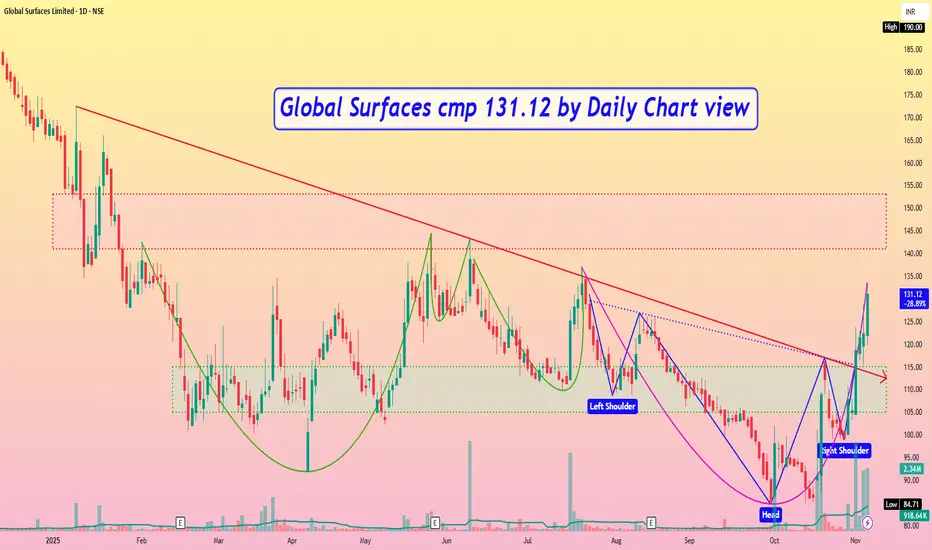
Global Surfaces cmp 131.12 by Daily Chart viewGlobal Surfaces cmp 131.12 by Daily Chart view
- Support Zone 105 to 115 Price Band
- Resistance Zone 141 to 153 Price Band
- Multiple Bullish Technical Chart patterns done
- Falling Resistance Trendline Breakout well sustained
- Majority of Technical Indicators seen trending positively
Blackbuck cmp 668.75 by the Daily Chart view since listedBlackbuck cmp 668.75 by the Daily Chart view since listed
- Support Zone 630 to 655 Price Band
- Resistance Zone 695 to 723 Price Band then ATH 747.35
- Support Zone tested retested and Rising Support Trendline well respected

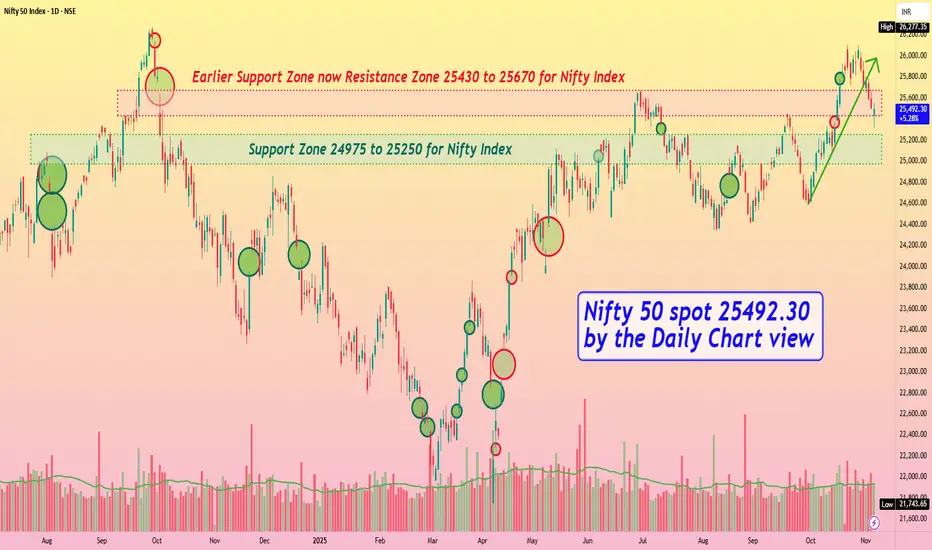
Nifty 50 spot 25492.30 by the Daily Chart view - Weekly updateNifty 50 spot 25492.30 by the Daily Chart view - Weekly update
- Support Zone 24975 to 25250 for Nifty Index
- Earlier Support Zone now Resistance Zone 25430 to 25670 for Nifty Index
- Rising Support Trendline Breakdown done basis the ongoing weak sentiments in general
- The final hurdle ATH remains elusive and Nifty keeps distinctly shy to create a New Lifetime High
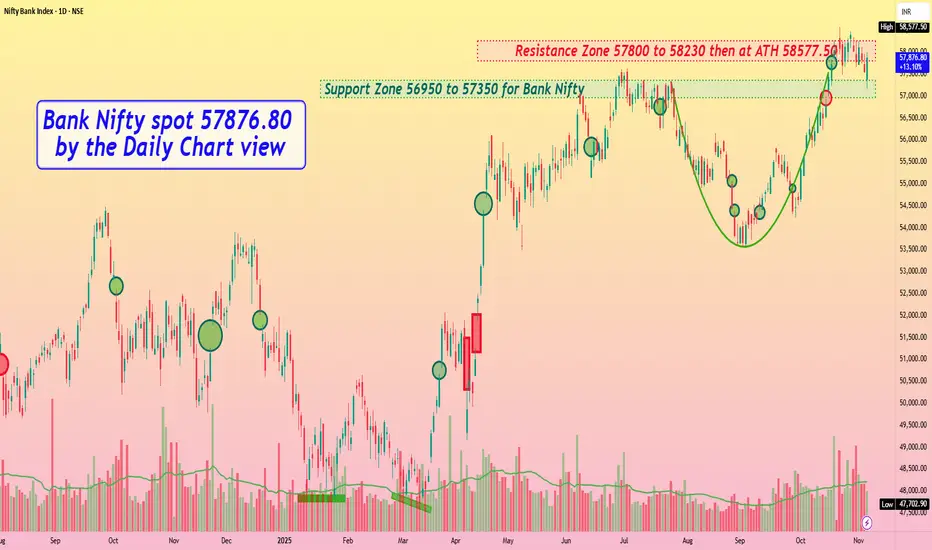
Bank Nifty spot 57876.80 by Daily Chart view - Weekly updateBank Nifty spot 57876.80 by Daily Chart view - Weekly update
- Support Zone 56950 to 57350 for Bank Nifty
- Resistance Zone 57800 to 58230 then at ATH 58577.50
- Bank Nifty sustaining between Support and Resistance Zones over 2 weeks
- Bullish Rounding Bottom still in active mode against the weak sentiments in general
Shriram Finance cmp 796.50 by Daily Chart viewShriram Finance cmp 796.50 by Daily Chart view
- Support Zone 728 to 760 Price Band
- Resistance only at ATH 814.15 done on Tuesday 04-Nov-2025
- The current Technical Chart setup is indicative of a very good upside with tentative target price level +/- 1025

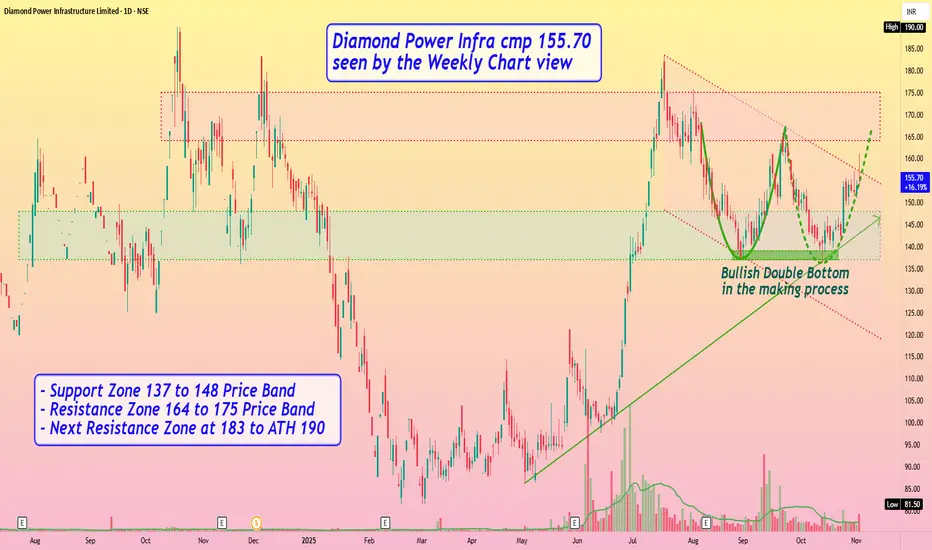
Diamond Power Infra cmp 155.70 seen by the Weekly Chart viewDiamond Power Infra cmp 155.70 seen by the Weekly Chart view
- Support Zone 137 to 148 Price Band
- Resistance Zone 164 to 175 Price Band
- Next Resistance Zone at 183 to ATH 190
- Bullish Double Bottom in the making process
- Rising Support Trendline seems well respected
- Volumes spiking regularly by close sync with avg traded qty
- Falling Price Channel Breakout seems to be in the making process
Onmobile Global cmp 73.96 by Weekly Chart viewOnmobile Global cmp 73.96 by Weekly Chart view
- Support Zone 62 to 68 Price Band
- Resistance Zone 78 to 85 Price Band
- Bullish Rounding Bottom under Resistance Zone
- 1st Falling Resistance Trendline seems well sustained
- Next hurdles are Dotted Falling Resistance Trendline and Resistance Zone
- Volumes needed to provide fresh upside to give breakout above the Resistance
- Stock price trending well with positive technical indicators EMA, MACD, RSI, SAR, SuperTrend

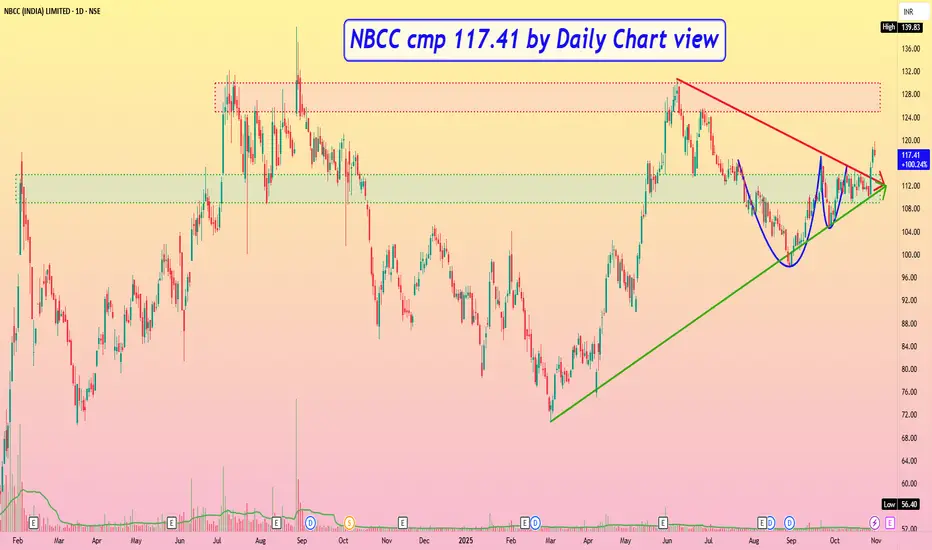
NBCC cmp 117.41 by Daily Chart viewNBCC cmp 117.41 by Daily Chart view
* Support Zone 109 to 114 Price Band
* Resistance Zone 125 to 130 Price Band then 137 to ATH 139.83
* Bullish Cup and Handle pattern is made around the Support Zone
* Symmetrical Triangle pattern breakout seems to be in making process
* Volumes in good sync with avg traded quantity and spiking above it too
* Falling Resistance Trendline Breakout with Rising Support Trendline well respected
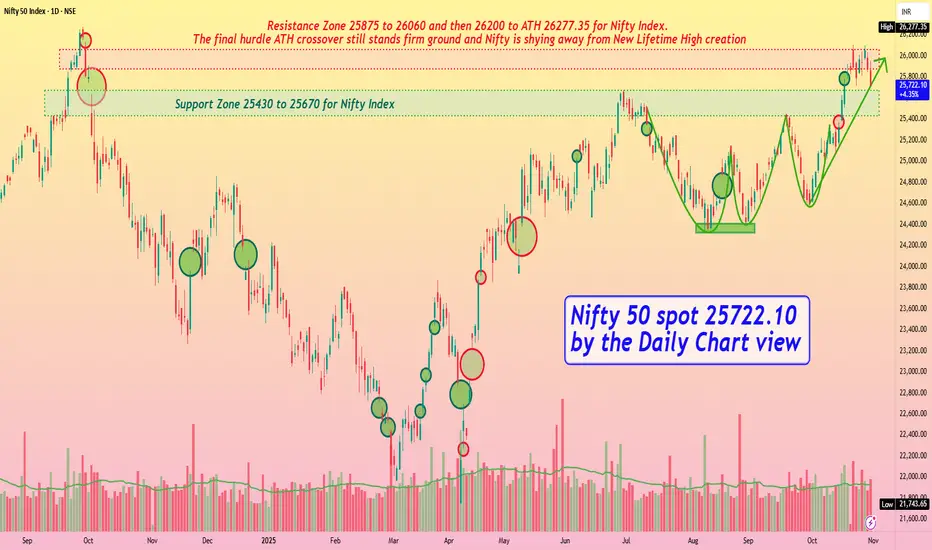
Nifty 50 spot 25722.10 by the Daily Chart view - Weekly UpdateNifty 50 spot 25722.10 by the Daily Chart view - Weekly Update
- Support Zone 25430 to 25670 for Nifty Index
- Rising Support Trendline seems in active mode but may be broken
- Nifty below Resistance Zone but taking rest tad above the Support Zone
- Resistance Zone 25875 to 26060 and then 26200 to ATH 26277.35 for Nifty Index
- Bullish Rounding Bottoms seems active but continued skepticism keeping the Nifty index weak
- The final hurdle ATH crossover still stands ground and Nifty shying away from New Lifetime High creation
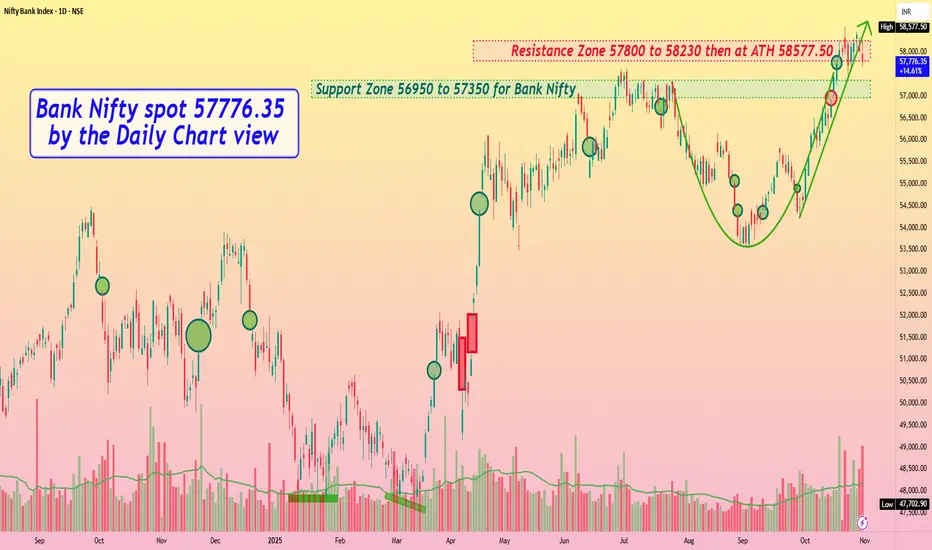
Bank Nifty spot 57776.35 by Daily Chart view - Weekly UpdateBank Nifty spot 57776.35 by Daily Chart view - Weekly Update
- Support Zone 56950 to 57350 for Bank Nifty
- Resistance Zone 57800 to 58230 then at ATH 58577.50
- Bank Nifty sustaining tad below Resistance Zone but above Support Zone
- Rising Support Trendline has been broken and bit of weakness seems prevailing
- Bullish Rounding Bottom seems active but for the sustained skepticism in general
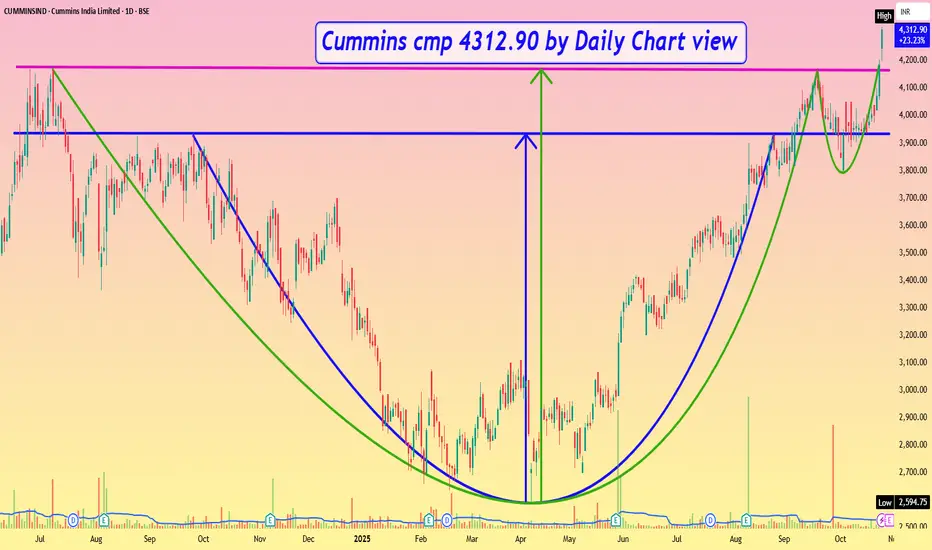
Cummins cmp 4312.90 by Daily Chart viewCummins cmp 4312.90 by Daily Chart view
- Support Zone 3900 to 4100 Price Band
- Only Resistance at ATH 4323.85 done today
- Very Strong Bullish Chart setup and Technical patterns made
- 1st Logical Target price level +/- 5250 by inner Rounding Bottom
- 2nd Logical Target price level +/- 5735 by broader Cup & Handle pattern
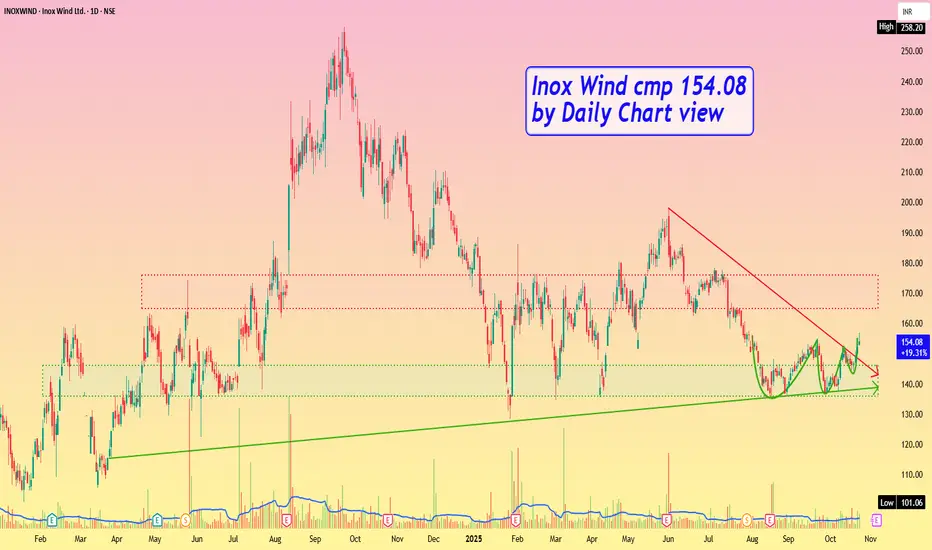
Inox Wind cmp 154.08 by Daily Chart viewInox Wind cmp 154.08 by Daily Chart view
- Support Zone 136 to 146 Price Band
- Resistance Zone 165 to 176 Price Band
- Volumes in good sync with avg traded quantity
- Falling Resistance Trendline Breakout seems sustained
- VCP pattern seems in making process by technical chart setup
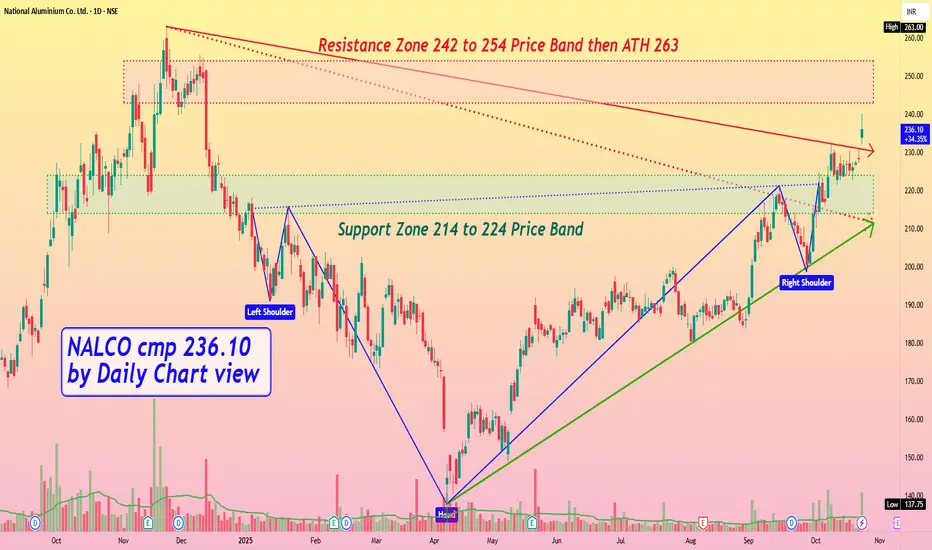
NALCO cmp 236.10 by Daily Chart viewNALCO cmp 236.10 by Daily Chart view
- Support Zone 214 to 224 Price Band
- Resistance Zone 242 to 254 Price Band then ATH 263
- Bullish Head & Shoulders completed by Support Zone neckline
- Dotted Falling Resistance Trendline Breakout has well sustained
- Falling Resistance Trendline Breakout attempted and work in progress
- Volumes spiking intermittently over past few days by close sync with avg traded qty
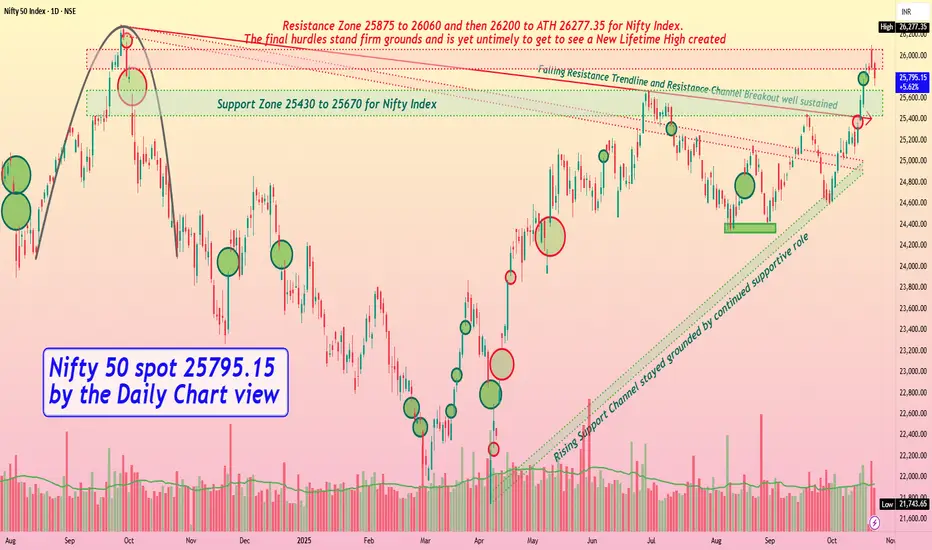
Nifty 50 spot 25795.15 by Daily Chart view - Weekly updateNifty 50 spot 25795.15 by Daily Chart view - Weekly update
- Support Zone 25430 to 25670 for Nifty Index
- Rising Support Channel stayed grounded by continued supportive role
- Falling Resistance Trendline and Resistance Channel Breakout well sustained
- Resistance Zone 25875 to 26060 and then 26200 to ATH 26277.35 for Nifty Index
- The final hurdles stand firm grounds and is yet untimely to get to see a New Lifetime High created
- Nifty Index earlier shied away to cross the 25K level and now acting likewise to breach the ATH 26277.35 mark
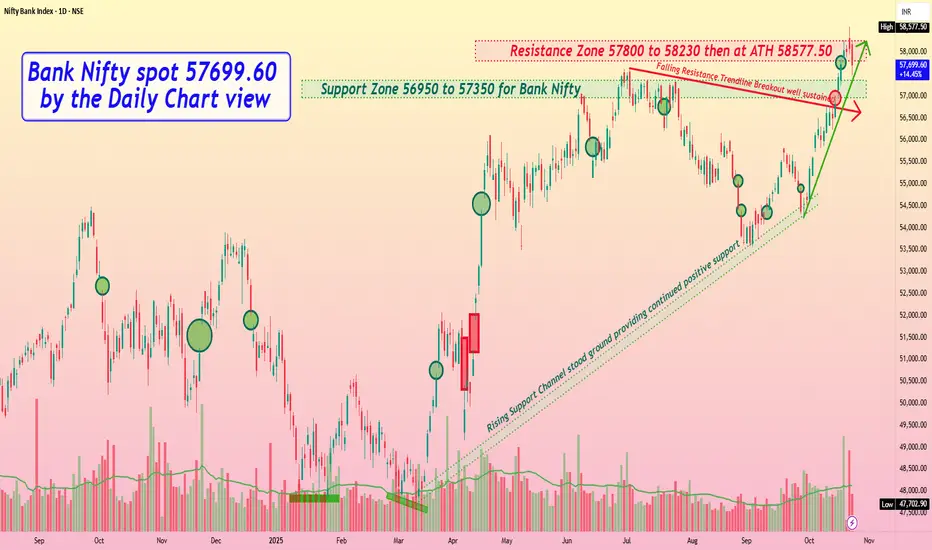
Bank Nifty spot 57699.60 by the Daily Chart view - Weekly updateBank Nifty spot 57699.60 by the Daily Chart view - Weekly update
- Support Zone 56950 to 57350 for Bank Nifty
- Resistance Zone 57800 to 58230 then at ATH 58577.50
- Falling Resistance Trendline Breakout has been well sustained
- Gap Up Opening of 16th October remains vacant, may need to be filled and closed off
- Rising Support Channel stood supportive ground and Rising Trendline seems in active mode
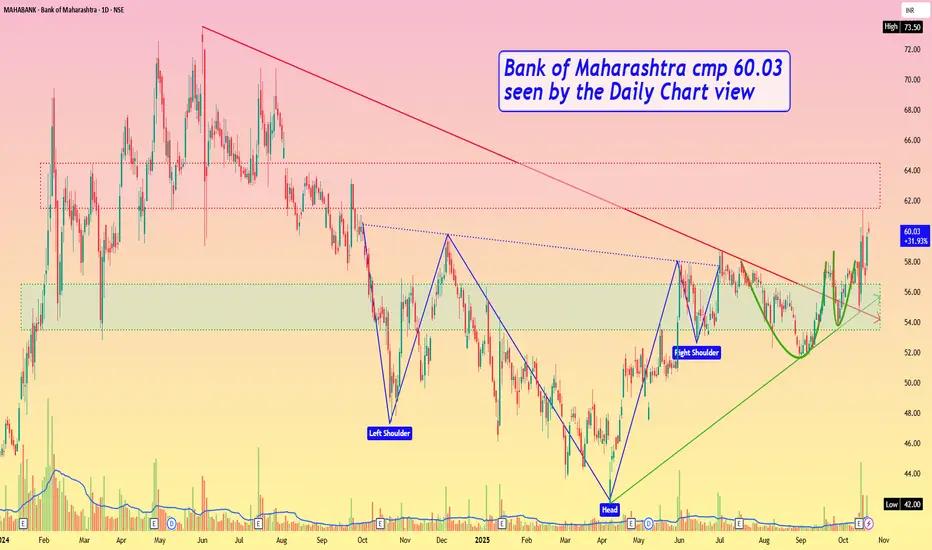
Bank of Maharashtra cmp 60.03 by Daily Chart viewBank of Maharashtra cmp 60.03 by Daily Chart view
- Support Zone 53.50 to 56.50 Price Band
- Resistance Zone 61.50 to 64.50 Price Band
- Bullish Head & Shoulders plus Rounding Bottoms around Support Zone
- Breakout from Falling Resistance Trendline and Rising Support Trendline maintained
- Volume are in close sync with avg traded quantity and spiking heavily over past few days
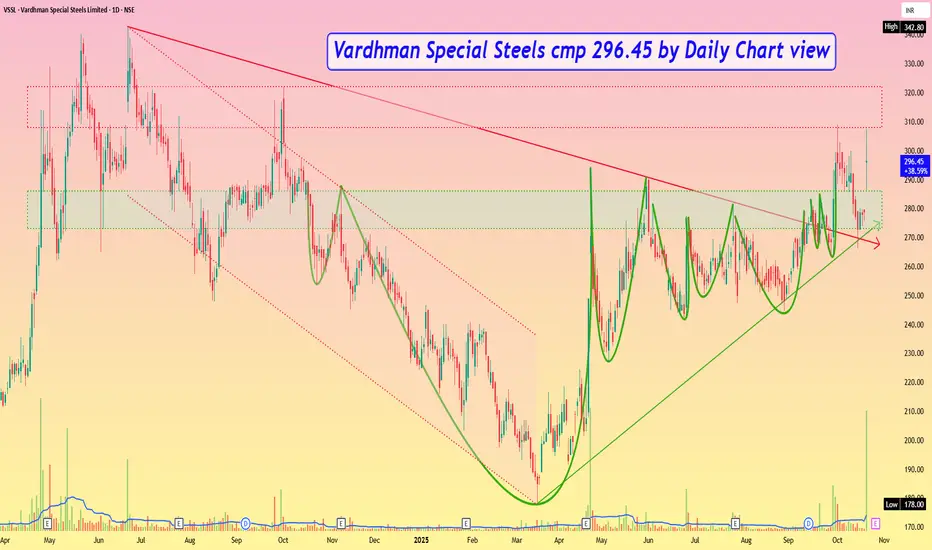
Vardhman Special Steels cmp 296.45 by Daily Chart viewVardhman Special Steels cmp 296.45 by Daily Chart view
- Support Zone 273 to 286 Price Band
- Resistance Zone 308 to 322 Price Band
- Falling Resistance Trendline Breakout well sustained
- Rising Support Trendline well respected by continued uptrend
- Support Zone tested, broken, retested by fresh breakout probability
- Volume surging intermittently over past few days, in close sync with avg traded quantity
- Considerate Head & Shoulders with multiple Rounding Bottoms formed around Support Zone neckline
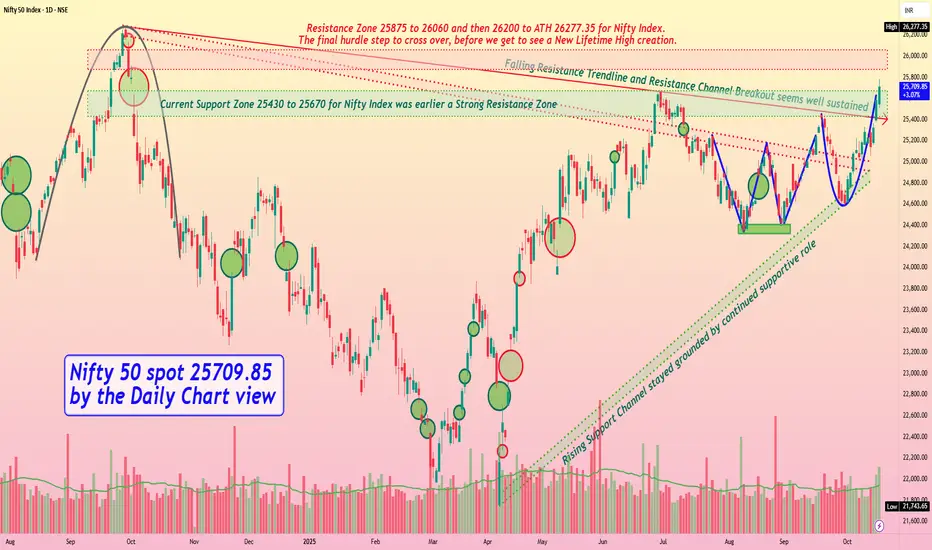
Nifty 50 spot 25709.85 by the Daily Chart view - Weekly updateNifty 50 spot 25709.85 by the Daily Chart view - Weekly update
- [ b]Nifty Index now just 567.50 points away from ATH 26277.35 for creating a New Lifetime High Milestone
- Resistance Zone 25875 to 26060 and then 26200 to ATH 26277.35 for Nifty Index
- The final hurdle step to cross over before we get to see a New Lifetime High creation
- Both Falling Resistance Trendline and Resistance Channel Breakout seem well sustained
- Current Support Zone 25430 to 25670 for Nifty Index was earlier a Strong Resistance Zone
- Rising Support Channel has stayed firmly grounded by providing the continued supportive role
- Bullish Technical patterns Double Bottom "W" followed by Rounding Bottom formed by Support Zone neckline