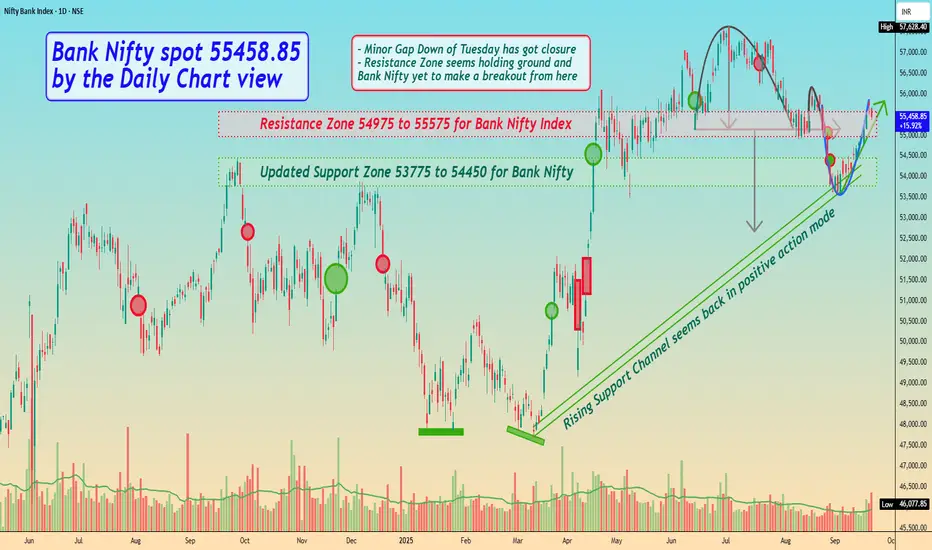
Bank Nifty spot 55458.85 by Daily Chart view - Weekly updateBank Nifty spot 55458.85 by Daily Chart view - Weekly update
- Minor Gap Down of Tuesday 26th Aug got closure
- Resistance Zone 54975 to 55575 for Bank Nifty Index
- Updated Support Zone 53775 to 54450 for Bank Nifty
- Rising Support Channel seems back in positive action mode
- Resistance Zone seems holding ground and Bank Nifty yet to make a breakout from here
Supportresistancelevels
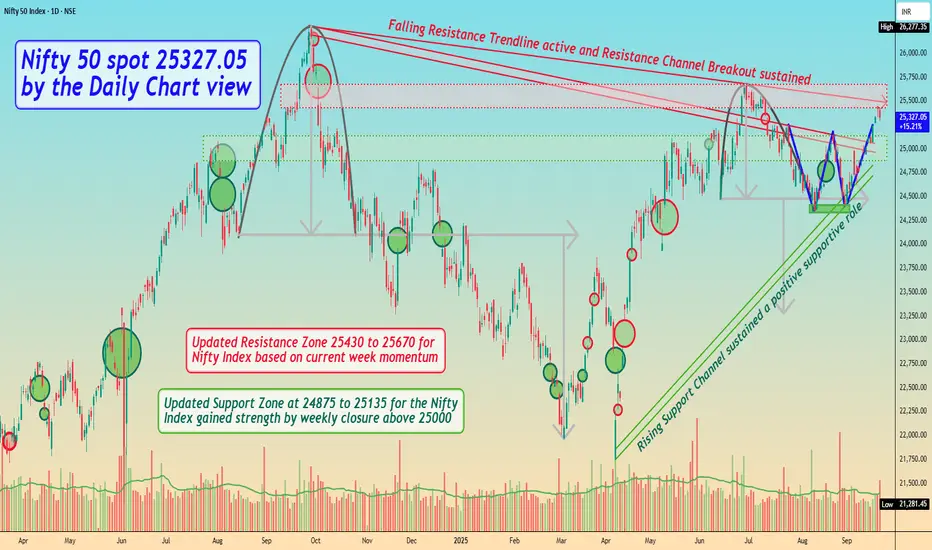
Nifty 50 spot 25327.05 by Daily Chart view - Weekly updateNifty 50 spot 25327.05 by Daily Chart view - Weekly update
- Rising Support Channel sustained a positive supportive role
- Bullish "W" Double Bottom uptrend momentum yet on strong ground
- Falling Resistance Trendline active and Resistance Channel Breakout sustained
- Updated Resistance Zone 25430 to 25670 for Nifty Index based on current week momentum
- Updated Support Zone at 24875 to 25135 for the Nifty Index gained strength by weekly closure above 25000
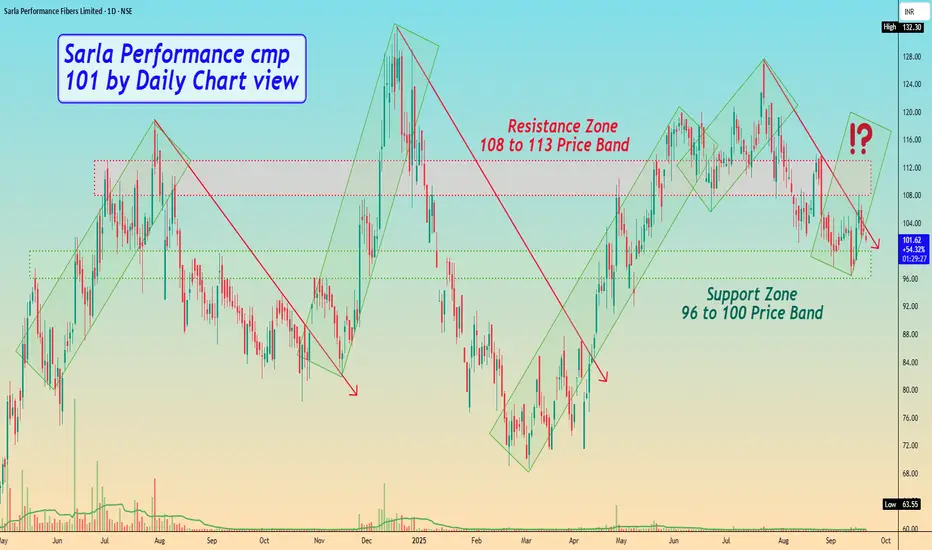
Sarla Performance cmp 101 by Daily Chart viewSarla Performance cmp 101 by Daily Chart view
- Support Zone 96 to 100 Price Band
- Resistance Zone 108 to 113 Price Band
- Rising Falling Price pattern repeated for over a year now
- Will the Price Rising pattern repeat from Support Zone ground ???
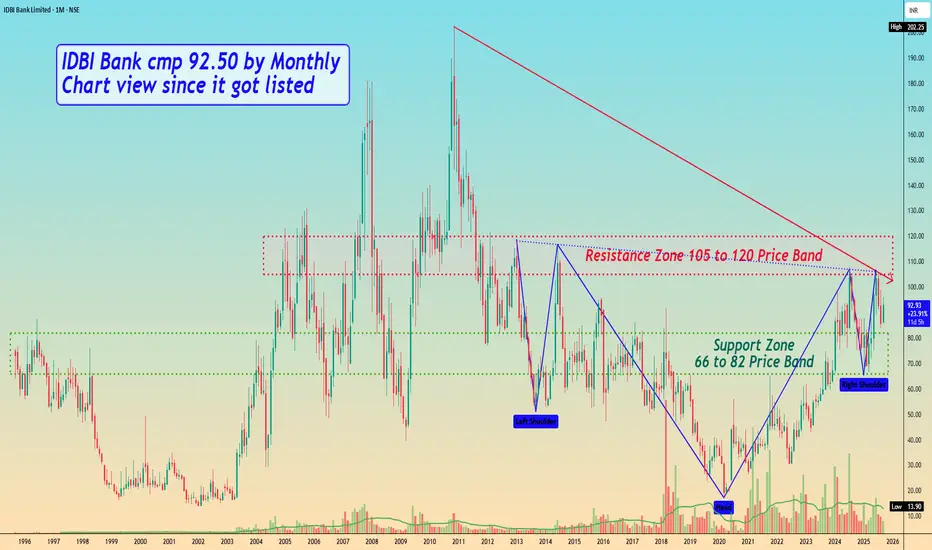
IDBI Bank cmp 92.50 by Monthly Chart view since it got listedIDBI Bank cmp 92.50 by Monthly Chart view since it got listed
- Support Zone 66 to 82 Price Band
- Resistance Zone 105 to 120 Price Band
- Bullish Cup and Handle done indicative of good upside probability
- Resistance Zone acting strongly hence Price move getting rejected since October 2011
- Breakout above Resistance Zone needs heavy traded Volumes increase and needs to sustain above it for few days to foresee and anticipate fresh upside 🤞🏽🤞🏽🤞🏽🤞🏽
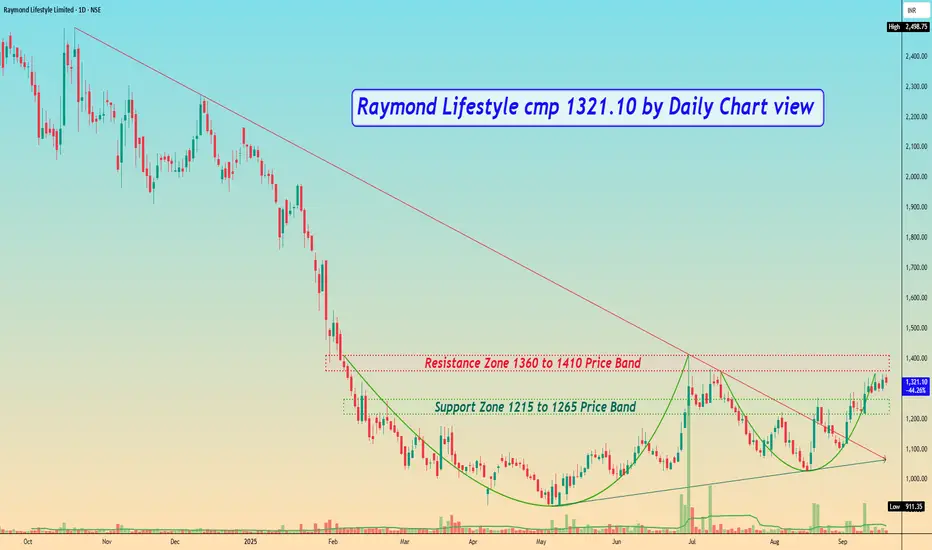
Raymond Lifestyle cmp 1321.10 by Daily Chart viewRaymond Lifestyle cmp 1321.10 by Daily Chart view
- Support Zone 1215 to 1265 Price Band
- Resistance Zone 1360 to 1410 Price Band
- Bullish Rounding Bottoms by Resistance Zone neckline
- Resistance Zone tested rested prior to Breakout attempt
- Breakout sustained above the Falling Resistance Trendline
- Volumes seem subdued, need to increase for good Breakout
- Chart showing indicative positive setup for BB, EMA, MACD, RSI
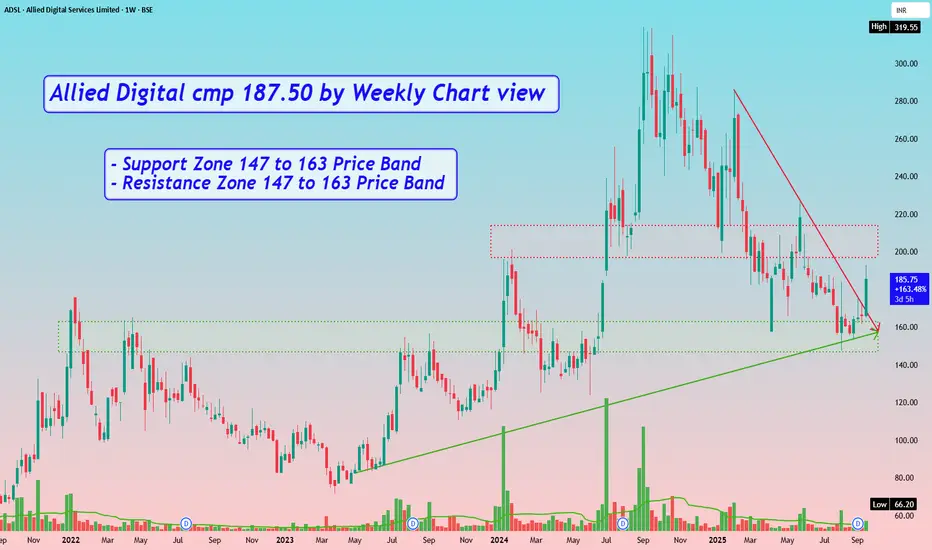
Allied Digital cmp 187.50 by Weekly Chart viewAllied Digital cmp 187.50 by Weekly Chart view
- Support Zone 147 to 163 Price Band
- Resistance Zone 147 to 163 Price Band
- Support Zone was tested retested over past few days
- Volumes are improving by demand based buying on the counter
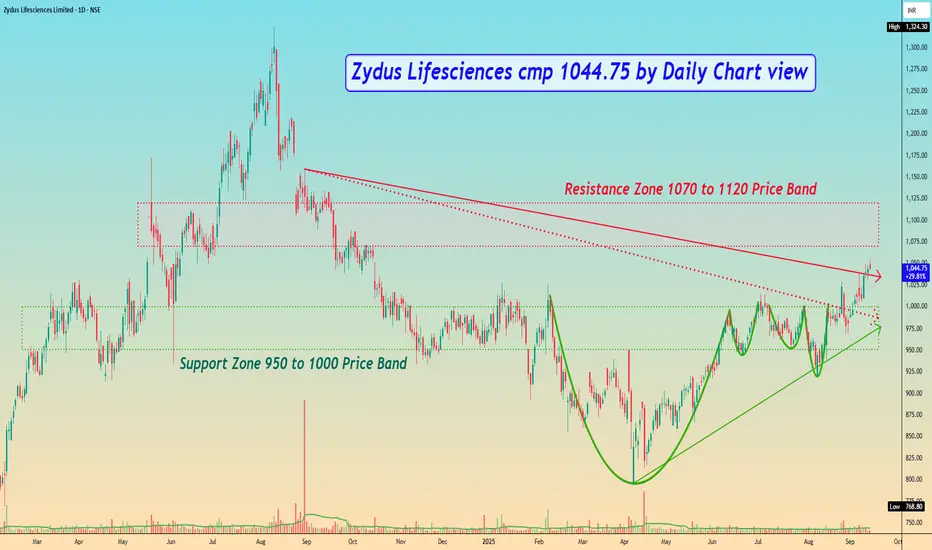
Zydus Lifesciences cmp 1044.75 by Daily Chart viewZydus Lifesciences cmp 1044.75 by Daily Chart view
- Support Zone 950 to 1000 Price Band
- Resistance Zone 1070 to 1120 Price Band
- Falling Resistance Trendline Breakout seems sustained
- Bullish Cup and Handle done by Support Zone neckline
- Bullish Rounding Bottoms made by Support Zone neckline
- Volumes seem getting in close sync with average traded quantity
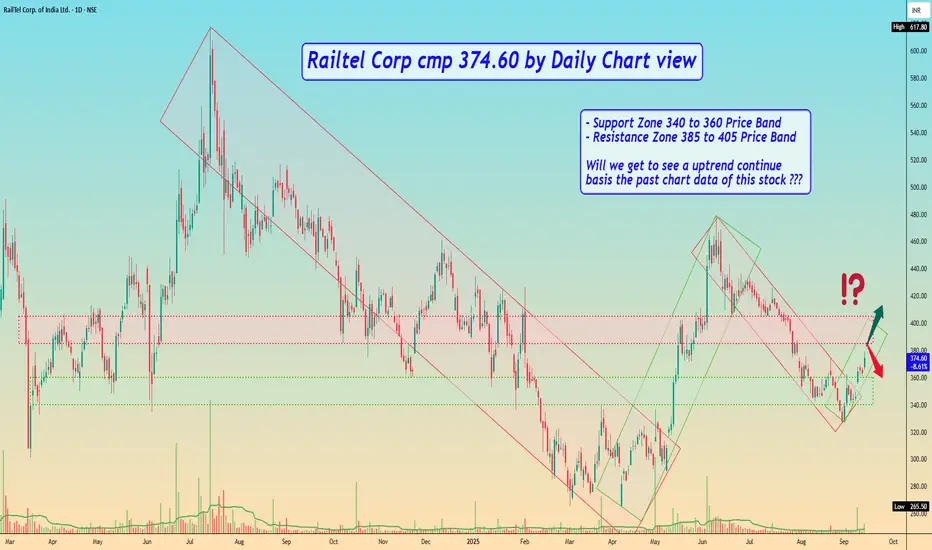
Railtel Corp cmp 374.60 by Daily Chart viewRailtel Corp cmp 374.60 by Daily Chart view
- Support Zone 340 to 360 Price Band
- Resistance Zone 385 to 405 Price Band
- Will we get to see a uptrend continue basis the past chart data of this stock ???
Shakti Pumps cmp 856.65 by Daily Chart viewShakti Pumps cmp 856.65 by Daily Chart view
- Support Zone 775 to 805 Price Band
- Resistance Zone 885 to 920 Price Band
- Symmetrical Triangle Breakout attempted
- Intermittent Heavy Volumes surge seen by demand based buying
- Rising Price Trendline and Channel indicating slow and steady upside momentum
- Fresh upside may be foreseen, post Resistance Zone Breakout and sustained closure above it for few days

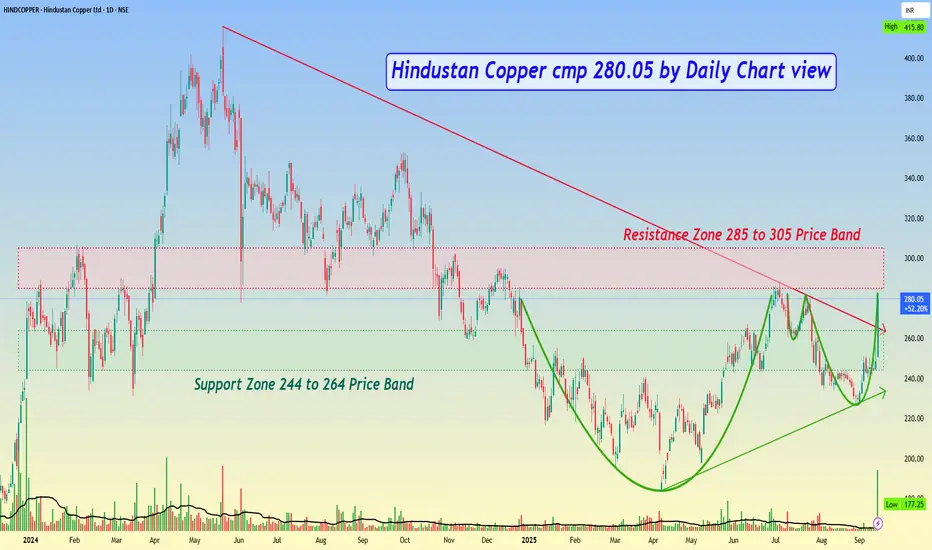
Hindustan Copper cmp 280.05 by Daily Chart viewHindustan Copper cmp 280.05 by Daily Chart view
- Support Zone 244 to 264 Price Band
- Resistance Zone 285 to 305 Price Band
- Huge Volumes surge by demand based buying
- Falling Resistance Trendline Breakout sustained closure
- Support Zone got well tested and retested over past few days
- Bullish Rounding Bottoms formed by the Resistance Zone neckline
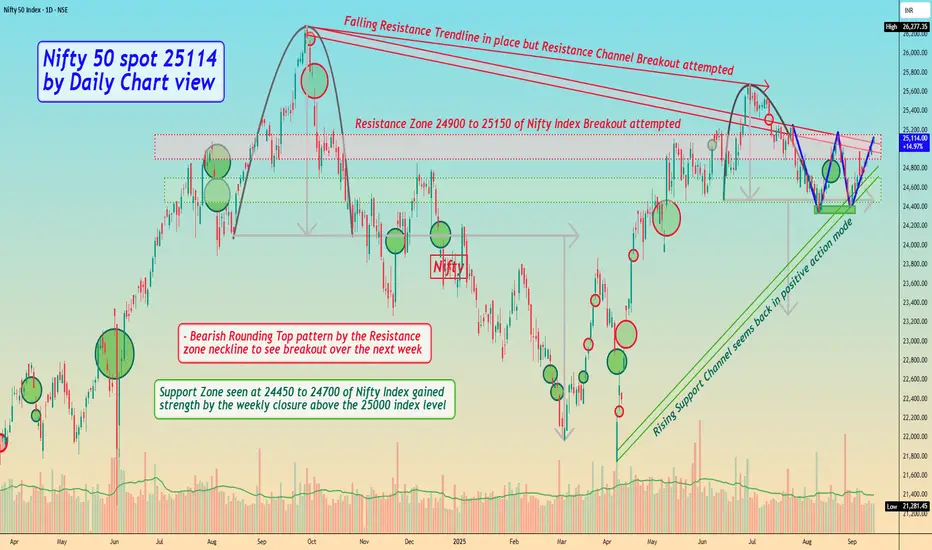
Nifty 50 spot 25114 by Daily Chart view - Weekly UpdateNifty 50 spot 25114 by Daily Chart view - Weekly Update
- Rising Support Channel seems back in positive action mode
- Resistance Zone 24900 to 25150 of Nifty Index Breakout attempted
- Falling Resistance Trendline in place but Resistance Channel Breakout attempted
- Bearish Rounding Top pattern by the Resistance zone neckline to see breakout over the next week
- Bullish "W" with Double Bottom formed below Support Zone, seems instrumental for uptrend momentum
- Support Zone seen at 24450 to 24700 of Nifty Index gained strength by the weekly closure above the 25000 index level
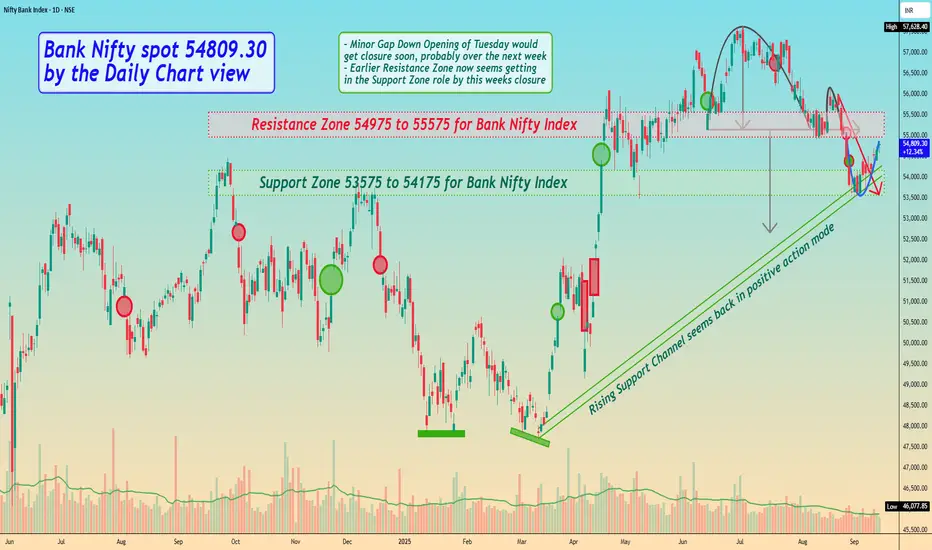
Bank Nifty spot 54809.30 by Daily Chart view - Weekly UpdateBank Nifty spot 54809.30 by Daily Chart view - Weekly Update
- Support Zone 53575 to 54175 for Bank Nifty Index
- Rising Support Channel seems back in positive action mode
- Resistance Zone 54975 to 55575 of Bank Nifty Index may act as a strong barrier to cross
- Minor Gap Down Opening of Tuesday would get closure soon, probably over the next week
- Earlier Resistance Zone now seems like getting in the Support Zone role by this weeks closure
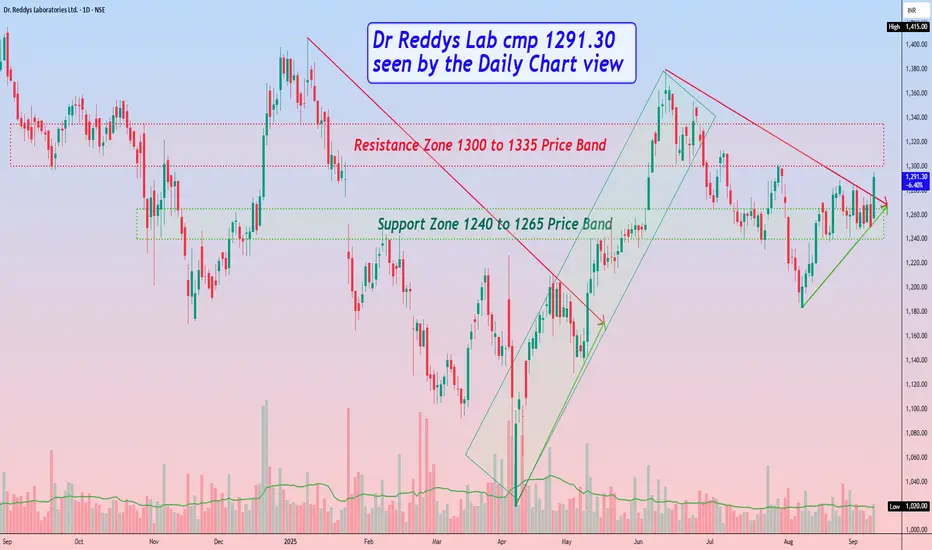
Dr Reddys Lab cmp 1291.30 by Daily Chart viewDr Reddys Lab cmp 1291.30 by Daily Chart view
- Support Zone 1240 to 1265 Price Band
- Resistance Zone 1300 to 1335 Price Band
- Breakout from Falling Resistance Trendline
- Bullish Rising Price Channel with intermittent highs and lows
- Recent history repeating by Breakout from Falling Resistance Trendline
- *Will we see a repeat Bullish Rising Price Channel with intermittent highs and lows*
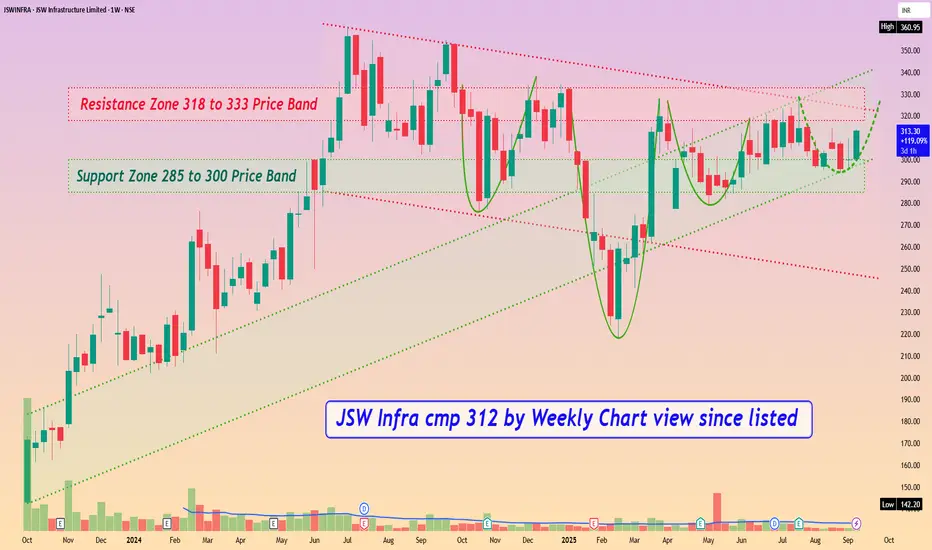
JSW Infra cmp 312 by Weekly Chart view since listedJSW Infra cmp 312 by Weekly Chart view since listed
- Support Zone 285 to 300 Price Band
- Resistance Zone 318 to 333 Price Band
- Bullish Rounding Bottoms repeated under the Resistance Zone neckline
- Stock making Higher High Lower High pattern within up-trending price channel momentum
- Stock traversing within Rising Support + Price Channel and attempting Falling Resistance + Price Channel Breakout
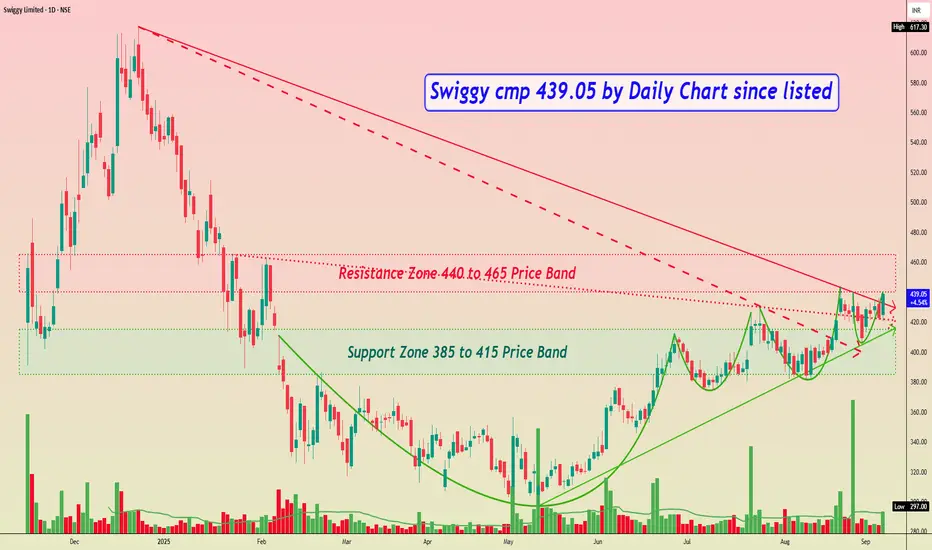
Swiggy cmp 439.05 by Daily Chart since listedSwiggy cmp 439.05 by Daily Chart since listed
- Support Zone 385 to 415 Price Band
- Resistance Zone 440 to 465 Price Band
- Rising Support Trendline well respected by Price momentum
- Bullish Cup and Handle followed by small Rounding Bottoms or a closely considerate VCP pattern
- Falling Resistance Trendline Breakout attempted with older Resistance Trendlines Breakout well sustained
- Volumes are spiking heavily at intermittent intervals and staying in close sync with the average traded quantity
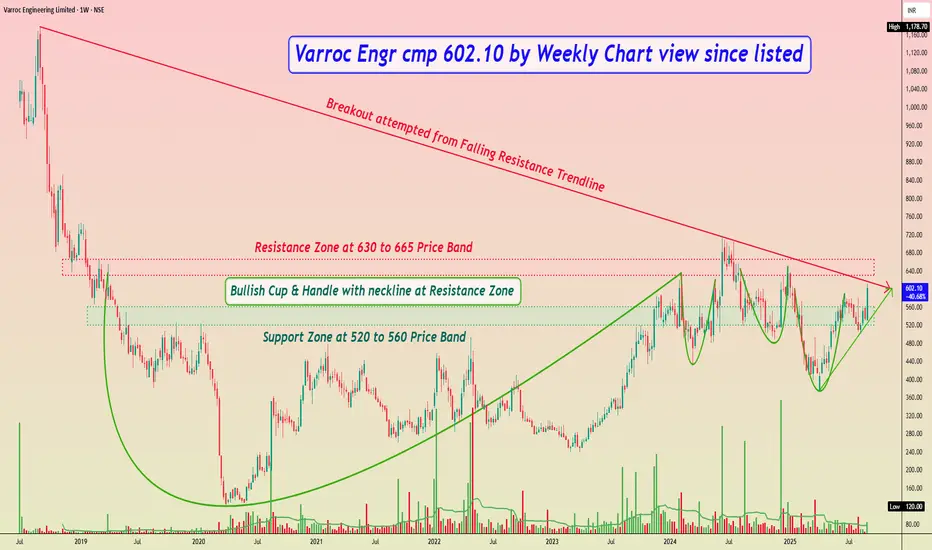
Varroc Engr cmp 602.10 by Weekly Chart view since listedVarroc Engr cmp 602.10 by Weekly Chart view since listed
- Support Zone at 520 to 560 Price Band
- Resistance Zone at 630 to 665 Price Band
- Breakout attempted from Falling Resistance Trendline
- Bullish Cup & Handle with neckline at Resistance Zone
- Bullish Rounding Bottoms also formed by Resistance Zone neckline
- Heavy Volumes based Breakout on Daily Chart after Support Zone testing retesting
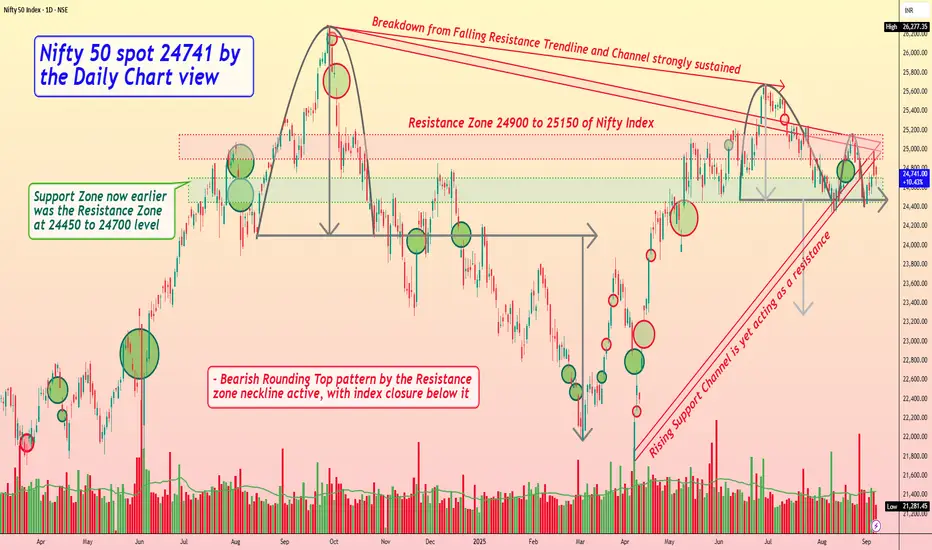
Nifty 50 spot 24741 by Daily Chart view - Weekly updateNifty 50 spot 24741 by Daily Chart view - Weekly update
- Resistance Zone 24900 to 25150 of Nifty Index
- Rising Support Channel is yet acting as a resistance
- Support Zone now earlier was the Resistance Zone at 24450 to 24700 level
- Breakdown from Falling Resistance Trendline and Channel has strongly sustained
- Bearish Rounding Top pattern by Resistance zone neckline active, with index closure below it
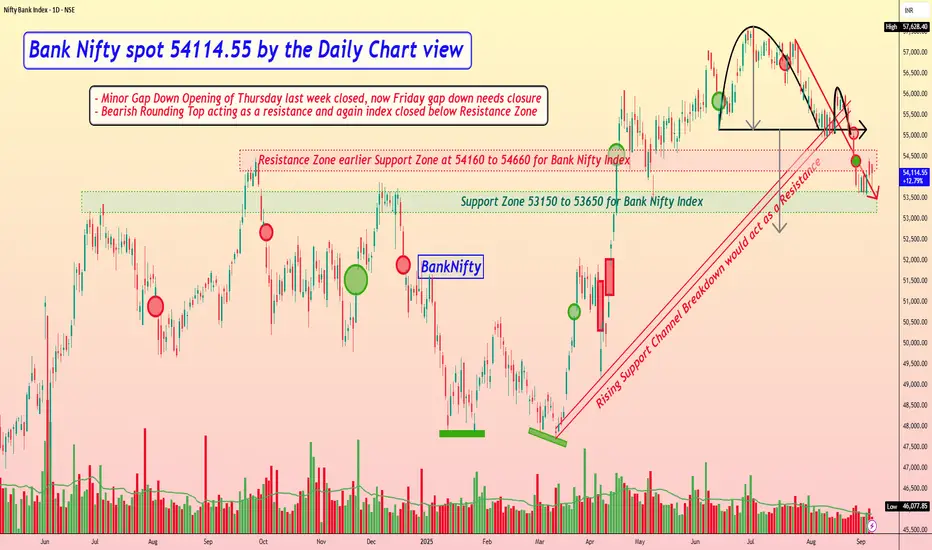
Bank Nifty spot 54114.55 by the Daily Chart view - Weekly updateBank Nifty spot 54114.55 by the Daily Chart view - Weekly update
- Support Zone 53150 to 53650 for Bank Nifty Index
- Rising Support Channel Breakdown would act as a Resistance
- Resistance Zone earlier Support Zone at 54160 to 54660 for Bank Nifty Index
- Bank Nifty Index trending within the Support and Resistance Zone since last week
- Bearish Rounding Top acting as a resistance and again index closed below Resistance Zone
- Minor Gap Down Opening of Thursday last week closed, now Friday gap down needs a closure
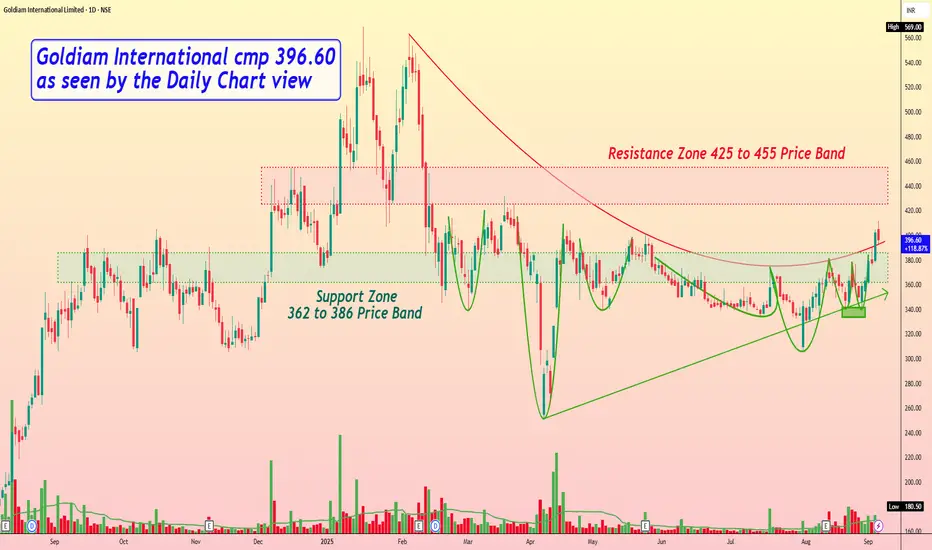
Goldiam International cmp 396.60 as seen by the Daily Chart viewGoldiam International cmp 396.60 as seen by the Daily Chart view
- Support Zone 362 to 386 Price Band
- Resistance Zone 425 to 455 Price Band
- Bullish "W" with Double Bottom formed at 340 price level
- Breakout attempted from Curved Falling Resistance Trendline
- Price momentum has well respected the Rising Support Trendline
- Volumes spiking above avg traded quantity over the past few weeks
- Multiple Bullish Rounding Bottoms formed around Support Zone neckline
- Majority of common Technical Indicator BB, EMA, MACD, RSI trending positively
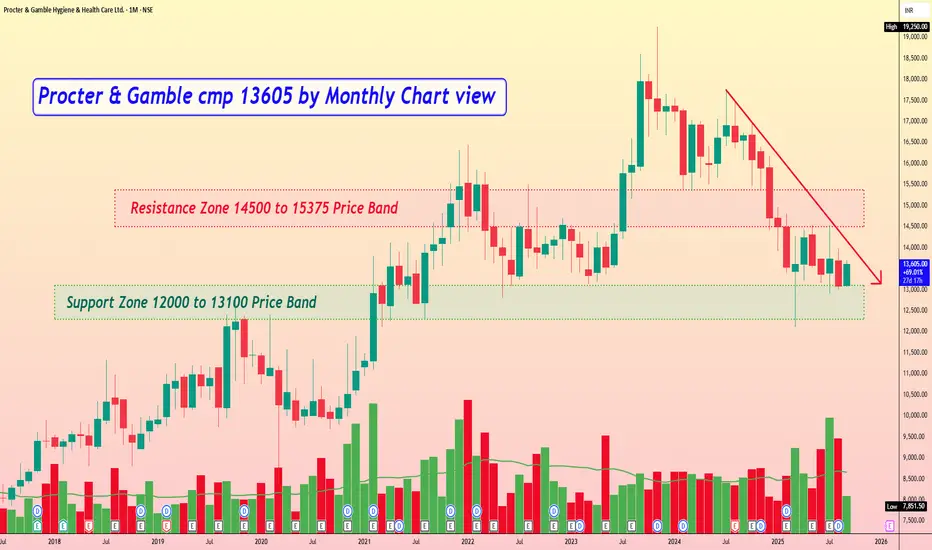
Procter & Gamble cmp 13605 by Monthly Chart viewProcter & Gamble cmp 13605 by Monthly Chart view
- Support Zone 12000 to 13100 Price Band
- Resistance Zone 14500 to 15375 Price Band
- Support Zone is under testing retesting phase by Weekly Chart view
- Subject to the Resistance Zone Breakout, one my anticipate for ATH 19250 as 1st target and then sky is the limit.
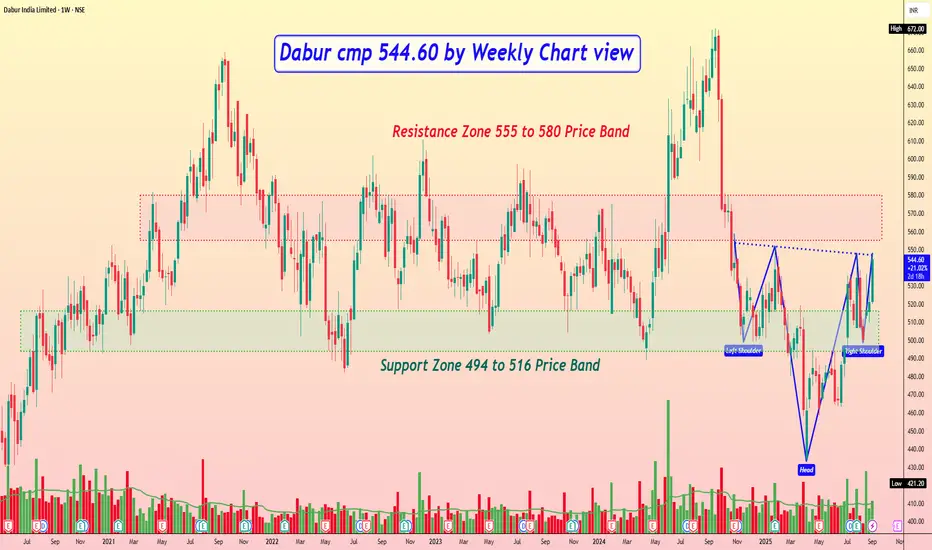
Dabur cmp 544.60 by Weekly Chart viewDabur cmp 544.60 by Weekly Chart view
- Support Zone 494 to 516 Price Band
- Resistance Zone 494 to 516 Price Band
- Breakout probable basis ongoing Support Zone test retest
- Closely considerate Bullish Head & Shoulders with Resistance Zone neckline
- Volumes are seen spiking well above average traded quantity over the past few weeks
- Favorably trending Technical Indicator signals shown by BB, EMA, MACD, RSI, SuperTrend
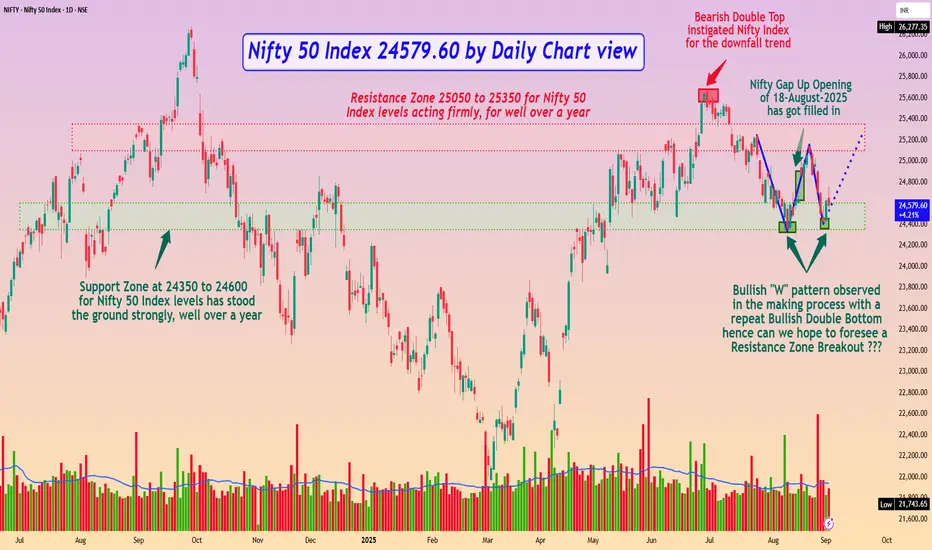
Nifty 50 Index 24579.60 by Daily Chart viewNifty 50 Index 24579.60 by Daily Chart view
- Nifty Gap Up Opening of 18-August-2025 has got filled in
- Bearish Double Top instigated Nifty Index for the downfall trend
- Resistance Zone 25050 to 25350 for Nifty 50 Index levels acting firmly, for well over a year
- Support Zone at 24350 to 24600 for Nifty 50 Index levels has stood the ground strongly, well over a year
- Bullish "W" pattern observed in the making process with a repeat Bullish Double Bottom hence can we hope to foresee a Resistance Zone Breakout ???
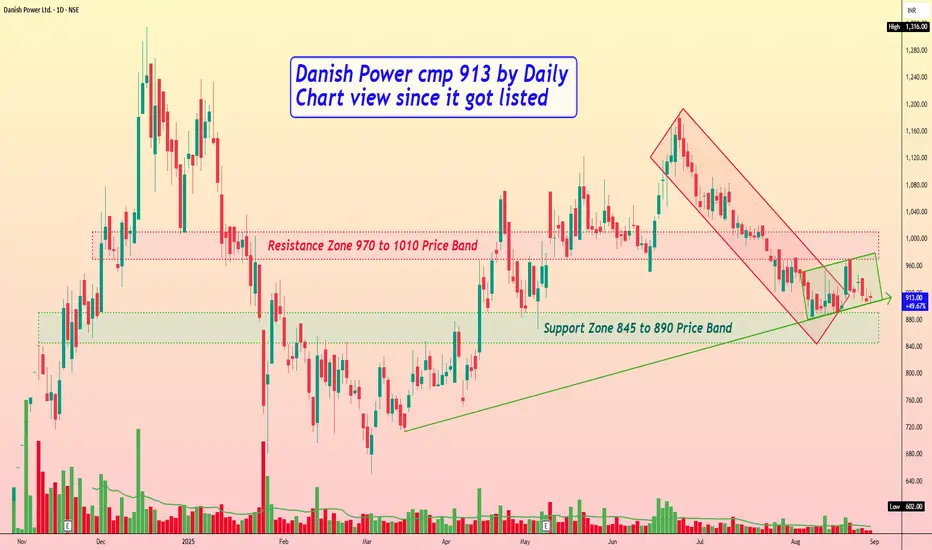
Danish Power cmp 913 by Daily Chart view since listedDanish Power cmp 913 by Daily Chart view since listed
- Support Zone 845 to 890 Price Band
- Resistance Zone 970 to 1010 Price Band
- Breakout from Falling Resistance Price Channel sustained
- Rising Support Price Channel trending post Support Zone test and retest
- Demand based Buying Volumes needed to counter profit booking selling pressure