Supreme Industries: Constructive Breakout from Falling WedgeThe Technical Context Supreme Industries (SUPREMEIND) has been navigating a corrective phase for several weeks, forming a well-defined Falling Wedge Structure. Historically, market technicians view this pattern as a sign of decreasing selling pressure.
Technical Observations:
Structure Break: The price action has breached the upper resistance trendline of the wedge.
Volume Confirmation: The breakout is accompanied by a noticeable uptick in volume ("Decent Volume"), suggesting institutional participation rather than just retail activity.
Momentum Shift: The sequence of lower highs appears to be disrupted, indicating a potential change in the short-term trend.
Key Technical Levels:
Immediate Support: The upper trendline, which acted as resistance, may now act as support during a pullback.
Trade Invalidation: The bullish thesis would be structurally compromised if the price closes back inside the wedge or falls below the recent swing low (below ~3,200 zone).
Technical Resistance (Upside): If momentum sustains, the chart structure suggests potential supply zones near the previous swing highs (e.g., the origin of the wedge).
Risological Note: We are observing the "Expansion" phase following a period of "Contraction." The wedge breakout is the first technical evidence that buyers are regaining control.
SUPREMEIND

SUPREMEIND High-Volume Reversal Attempt💹 Supreme Industries Ltd (NSE: SUPREMEIND)
Sector: Consumer Durables / Plastics | CMP: 3405.8
View: Neutral to Bullish — High-Volume Reversal Attempt
SUPREMEIND has witnessed a sharp corrective phase from its prior swing high near 4739, followed by a decisive reaction from the lower demand zone around the 3180–3320 region. The recent price action is marked by a strong bullish candle supported by exceptionally high volume, signalling aggressive short covering and fresh participation rather than a low-quality bounce. Despite the strength of the reaction, the broader structure remains a recovery attempt within a larger corrective framework, with price still trading below key medium- and long-term moving averages.
From a structural perspective, the stock is attempting to stabilize after a prolonged decline, with RSI at 43.65 recovering from oversold conditions and moving back into a neutral-to-healthy zone. Stochastic has exited oversold territory, while MACD remains negative but shows early signs of deceleration in downside momentum. ADX reflects a strong directional phase, although current behaviour suggests the trend is transitioning rather than fully reversed. Volume participation is notably elevated (Vol-X 3.86), confirming that the recent move is driven by active repositioning rather than passive mean reversion.
Key price references show overhead supply zones clustered near 3456–3592, while immediate structural support remains around 3320–3184, defining the current risk-reward envelope. A sustained hold above the reclaimed short-term averages would be required to improve structural confidence, while failure to hold recent demand may keep the stock range-bound with elevated volatility.
On the derivatives side, the 3400 CALL is used strictly as an analytical reference to understand positioning behaviour. The option reflects LTP near 72 with a delta of 0.55, indicating strong directional sensitivity. OI contraction of approximately 18 percent combined with an explosive volume expansion of over 1300 percent clearly points to short-covering-led participation rather than fresh leveraged longs. IV remains in a moderate zone, suggesting volatility is present but not excessively priced. This configuration typically aligns with sharp reactive moves, though continuation depends on follow-through in the underlying.
Structure quality metrics remain constructive, with an STWP Edge Score near 6.8/10, supported by liquidity proximity to ATM, balanced IV conditions and strong participation. However, directional options remain highly sensitive to time decay and price stalling, reinforcing the importance of momentum persistence in such environments. Smart positioning currently reflects improving sentiment, though confirmation would require sustained price acceptance above near-term resistance bands.
Overall, SUPREMEIND is exhibiting a high-volume reversal attempt with improving internal momentum, but the broader trend remains in a rebuilding phase. Structural confirmation, moving-average reclaim and contraction-to-expansion behaviour will be critical in determining whether this move evolves into a trend or remains a reactive bounce.
Final Outlook (Educational Snapshot):
Momentum: Strong (Short-Term) | Trend: Recovering / Transitional | Risk: High | Volume: Very High
⚠️ STWP Legal Disclaimer
This document is strictly for educational and informational purposes. All examples, charts, levels, and option structures discussed are illustrative and are not intended as buy, sell, or hold recommendations. STWP does not provide investment advice, trading tips, signals, or personalized financial guidance of any kind, nor is it a SEBI-registered intermediary or research analyst. The analyses, illustrations, and risk–reward structures included here are generic in nature and based on publicly available data and observed market behaviour, which may change without notice. Financial markets involve significant risk; derivatives in particular carry the potential for substantial losses. Option premiums, implied volatility, open interest, delta, and other market variables can fluctuate rapidly and unpredictably.
Readers are solely responsible for their trading decisions, capital management, and risk assessment. Before making any investment or trading decision, please consult a SEBI-registered investment advisor. STWP, its representatives, and affiliates shall not be liable for any direct or indirect loss arising from the use of this material. Historical patterns or past market behaviour do not guarantee future outcomes, nor should any part of this document be interpreted as a promise of performance, accuracy, or returns.
Position Status: No active position in this instrument at the time of analysis.
Data Source: TradingView & NSE India.
💬 Found this useful?
🔼 Boost this post to support structured learning
✍️ Share your thoughts or questions in the comments
🔁 Forward this to traders who value clean technical studies
👉 Follow for disciplined, structured, STWP-style analysis
🚀 Stay Calm. Stay Clean. Trade With Patience.
Trade Smart | Learn Zones | Be Self-Reliant 📊

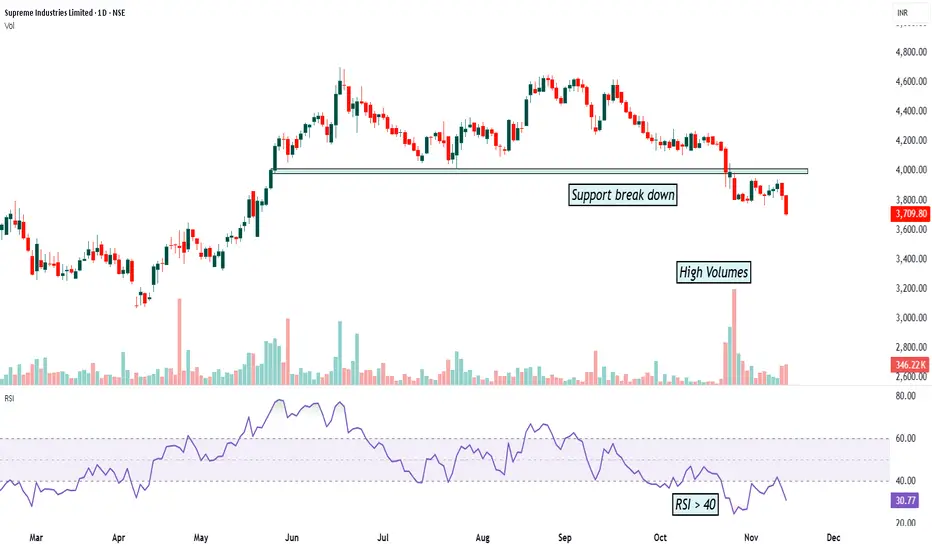
SUPREMEIND- Support break downThe chart shows that the stock has broken an important support level. This support had held the price many times in the past, but now the price has fallen below it. The breakdown has happened with high selling volume, which means more sellers are participating and the move is strong.
RSI is also below 40, which shows weak momentum and that the stock is in a bearish phase. When price breaks support with high volume and RSI stays low, it usually means the trend can continue on the downside.
This setup suggests caution because buyers are weak and sellers are in control.
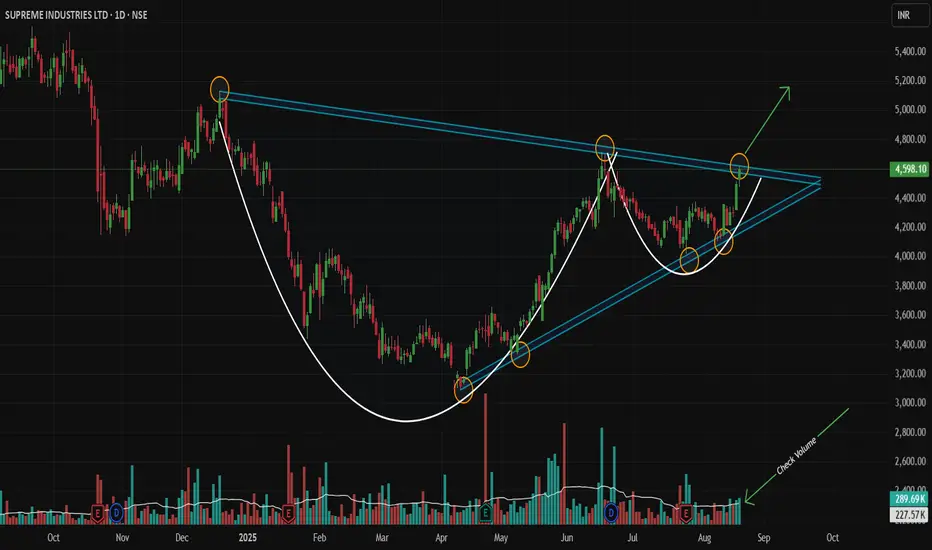
Nested Bullish Patterns Signal Major Breakout!Script: NSE:SUPREMEIND | Timeframe: Daily | Analysis Type: Technical (Pure Price Action) | Patterns: Symmetrical Triangle + Cup & Handle
Idea Summary 💡
A powerful, nested pattern setup is concluding on the daily chart! A large Symmetrical Triangle contains a secondary Cup and Handle (Bullish) pattern. This rare confluence signals strong accumulation and suggests an imminent, powerful upside breakout is likely!
Chart Pattern Logic 🔍
Primary Pattern (Symmetrical Triangle): Characterized by descending resistance (highs: Dec-18-2024, Jun-17-2025) and ascending support (lows: Apr-9-2025, May-9-2025, Jul-24-2025).
Secondary Pattern (Cup & Handle): Formed entirely within the triangle, adding a potent layer of bullish confirmation.
Confluence: This pattern-within-a-pattern setup significantly amplifies the potential for a strong upward resolution.
Trade Thesis 📈
Price is coiling at the triangle's apex under immense pressure. A decisive break above the upper trendline could ignite the next major bullish impulse phase.
Trade Setup ⚡
Direction: LONG 🟢
Entry Trigger: WAIT for a strong Marubozu green candle 🕯️ to close above the triangle's trendline on high volume (min. 1.5x average).
Stop Loss: Below the low of the breakout candle. 🛑
Profit Targets: 4700 🎯 | 4800 🎯 | 5125 🎯
Long-Term Target: 6000+ (Extended Target Based on Pattern Confluence & Momentum) 🚀
Risk Management: Trail stops aggressively after Target 1.
Got another stock you want me to break down? 📊
Drop the ticker in the comments below! If you found this idea useful, like and follow for more pure price action analysis.
Disclaimer: This post/information is solely for educational purposes and should not be construed as a recommendation or financial advice. Trading carries a risk of loss. Please conduct your own research or consult a financial advisor before making any investment decisions. The author and TradingView are not liable for any financial losses incurred based on this content.
A Classic Case of Accumulation Turning into Momentum📈 SUPREME INDUSTRIES LTD – TECHNICAL ANALYSIS
📆 Date: May 27, 2025
🔍 Timeframe: Daily
Price Action:
Supreme Industries surged over 4% today and delivered a clean breakout after forming a consolidation triangle. The strong bullish candle closed near the day’s high with significant volume, confirming momentum on the upside.
Chart Pattern / Candlestick Pattern:
Symmetrical Triangle Breakout
Pullback Entry Zone Tested
Breakout Candle – wide range, strong body
Volume Surge – institutional interest visible
Technical Indicators:
RSI (Daily): 77 – strong bullish zone
MACD: Bullish crossover active
Stochastic: 98 – overbought but confirming strength
CCI: Above 200 – high momentum phase
Volume: 791.75K – supportive of breakout
Support & Resistance Levels:
Immediate Resistance: 4277.93
Next Resistance: 4355.47
Major Resistance: 4490.43
Immediate Support: 4065.43
Secondary Support: 3930.47
Major Support: 3852.93
Possible Fresh Demand Zone: 3837.60 – 3750.90
Chart Overview:
This visual clearly shows:
🔸 The symmetrical triangle pattern
🔸 Breakout + retest zone
🔸 Marked fresh demand zone for potential pullback opportunity
Educational Breakdown:
This setup combines:
Price Action: Triangle + Breakout
Volume Confirmation: Institutional participation
Momentum Indicators: Strong alignment
Demand Zone Mapping: Pre-breakout base
This is a classic trend continuation setup with clearly defined zones of interest. Risk control is key as price enters overbought territory.
Over the past few months, Supreme Industries displayed classic signs of an accumulation zone — a period marked by sideways movement, controlled volatility, and relatively stable volumes. This range-bound behavior typically indicates that long-term investors are quietly building positions while retail participation remains low. Recently, a strong bullish move supported by a significant rise in volume suggests the stock may have exited accumulation and entered the mark-up phase. This phase is often characterized by increased demand, higher price swings, and a clear shift in sentiment from neutral to bullish. The sharp breakout from the range, along with volume confirmation, signals the possible beginning of a new directional trend — where price tends to move swiftly as broader market participants join in.
How to Trade Supreme Industries (for learning purpose):
Entry Example: 4220.50
Stop Loss: 3781.50 (Risk: 439.00)
Target Example: 4659.50 (Reward: 439)
Sample Quantity: 50 shares
RR Ratio: ~1:1/1:2 etc.
Aggressive Traders: May consider riding the trend with trailing stop
Conservative Traders: Can wait for a pullback into the fresh demand zone (3837.60–3750.90)
⚠️ Risk Management Tip: Always trade with a clearly defined stop loss. Avoid entering positions impulsively. It is advisable to start with a smaller quantity and increase your exposure only if the price action confirms the continuation of the trend. Capital protection should always be the priority.
📢 Disclaimer
This content is created purely for educational and informational purposes. It is not intended as investment advice, stock recommendations, or trading tips. Trading and investing in the stock market involves risk. Please consult with a SEBI-registered financial advisor before making any investment decisions. The author/creator is not registered with SEBI and shall not be held responsible for any losses incurred based on this information. Always do your own research and use proper risk management.
👉 If you found this analysis helpful, don’t forget to Follow, so you never miss out on a trade-worthy setup, breakout opportunity, or valuable educational insight again. Stay updated and trade smarter! 💡📈

Supreme Industries Ltd - Breakout Setup, Move is ON...#SUPREMEIND trading above Resistance of 5802
Next Resistance is at 7722
Support is at 3880
Here are previous charts:
Chart is self explanatory. Levels of breakout, possible up-moves (where stock may find resistances) and support (close below which, setup will be invalidated) are clearly defined.
Disclaimer: This is for demonstration and educational purpose only. This is not buying or selling recommendations. I am not SEBI registered. Please consult your financial advisor before taking any trade.

Supreme Industries Ltd - Long Setup, Move is ON...#SUPREMEIND trading above Resistance of 3880
Next Resistance is at 5802
Support is at 2693
Here are previous charts:
Chart is self explanatory. Entry, Resistances and Support are mentioned on the chart.
Disclaimer: This is for demonstration and educational purpose only. This is not buying or selling recommendations. I am not SEBI registered. Please consult your financial advisor before taking any trade.

Supreme Ind: Bouncing From support Area1. Bouncing From support Area
2. Making Bullish H&S Pattern
3. Any closing above rejection zone may lead to a re-touch the resistance area.
DISC: Only for educational purposes.

Supreme Industries Indicates Potential Momentum Above 5150Details:
Asset: Supreme Industries Limited (SUPREMEIND)
Breakout Level: Sustaining above 5150
Potential Momentum: Upside momentum expected
Stop Loss: Below breakout level or as per risk tolerance
Timeframe: Short to medium-term
Rationale: Supreme Industries Limited (SUPREMEIND) has recently given a breakout and sustained above the 5150 level. This breakout could signify a bullish sentiment shift and pave the way for further momentum.
Market Analysis:
Technical Breakout: Sustaining above 5150 indicates a technical breakout, suggesting increased buying interest and potential upward momentum.
Market Sentiment: Positive market sentiment or company-specific factors may be contributing to the anticipated momentum in SUPREMEIND.
Potential Momentum:
With the breakout confirmed, SUPREMEIND may experience further upside momentum in the short to medium-term.
Risk Management:
Implementing a stop loss strategy below the breakout level is essential to manage risk in case of unexpected price reversals.
Timeframe:
The projected momentum for SUPREMEIND is based on a short to medium-term outlook, but actual timing may vary based on market conditions.
Risk-Reward Ratio: Consider individual risk tolerance and adjust position size accordingly to maintain a favorable risk-reward ratio.
As with any investment opportunity, conduct thorough analysis and consider factors such as market trends, company fundamentals, and risk management strategies before making trading decisions.

SUPREME INDUSTRIES RECTANGLE BREAKOUTSupreme industries breaking a rectangle box
on #weekly basis
huge volume good rsi
#target 6400 /sl 4400
EDUCATIONAL IDEA

SUPREMEIND - Bullish above 2810Bullish Flag Pattern
Bullish above 2810
Disclaimers: I am not sebi registered analysis

Supreme Industries - Long TermPrice moving in a channel. Cup and handle breakout on a daily time frame. The depth of the Cup will be targeted upwards. The price is still in an uptrend.

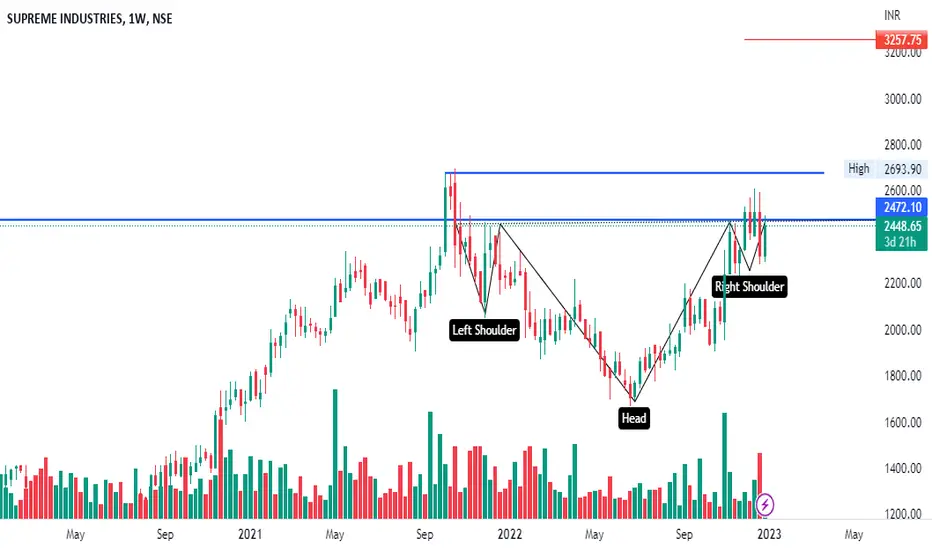
SUPREMEINDSUPREMEIND:- Head and shoulder pattern is showing formation, volume is also good, make some plans only after 2693, till then keep an eye.
Hello traders,
As always, simple and neat charts so everyone can understand and not make it too complicated.
rest details mentioned in the chart.
will be posting more such ideas like this. Until that, like share and follow :)
check my other ideas to get to know about all the successful trades based on price action.
Thanks,
Ajay.
keep learning and keep earning.
Stock for Christmas Celebration!Chart -> Supreme Ind Daily
Supreme Ind has the potential to give handsome returns until Christmas.
Wonderful inverse head and shoulder breakout with huge volume.
CMP: 2263
Targets: 2465, 2676
Good range: 2170 to 2200
SL: 2134 Daily close
Disclaimer: This is for educational purposes only, not any recommendations to buy or sell. As I am not SEBI registered, please consult your financial advisor before taking any action.


SUPREME INDUSTRIES LTD - Inverse Head & Shoulder + Cup & Handle 📊 Script: SUPREMEIND (SUPREME INDUSTRIES LIMITED)
📊 Nifty50 Stock: NO
📊 Sectoral Index: NIFTY 500 / NIFTY MIDCAP
📊 Sector: Industrials Capital Goods
📊 Industry: Plastic Products - Industrial
Key highlights: 💡⚡
📈 Script is trading at upper band of Bollinger Bands (BB) and giving breakout of it.
📈 MACD is giving crossover.
📈 Double Moving Averages also giving crossover.
📈 Volume is increasing along with price which is volume breakout.
📈 Script is giving breakout of Inverse Head & Shoulder + Cup & Handle + trendline.
📈 Current RSI is around 68.
📈 One can go for Swing Trade.
⏱️ C.M.P 📑💰- 2263
🟢 Target 🎯🏆 - 2474
⚠️ Stoploss ☠️🚫 - 2131
⚠️ Important: Always maintain your Risk & Reward Ratio.
⚠️ Purely technical based pick.
✅Like and follow to never miss a new idea!✅
Disclaimer: I am not SEBI Registered Advisor. My posts are purely for training and educational purposes.
Eat🍜 Sleep😴 TradingView📈 Repeat🔁
Happy learning with trading. Cheers!🥂

SUPREMEIND - Ichimoku Bullish Breakout Stock Name - Supreme Industries Limited
Ichimoku Cloud Setup :
1). Today's close is above the Conversion Line
2). Future Kumo is Turning Bullish
3). Chikou span is slanting upwards
All these parameters are showing bullishness at Current Market Price
and more bullishness AFTER crossing 2275
#This is not Buy and Sell recommendation to any one. This is for education purpose and a helping hand to learn trading in Market.
# Cloud Trading
# Ichimoku Cloud
# Ichimoku Followers
I hope you all like my analysis.
Please do share your thoughts into comment section.
Please give a like, it motivates me to do analysis.

SUPREME IND, Classic Cup and Handle Breakout NSE:SUPREMEIND SUPREME IND, Classic Cup and Handle Breakout
VERDICT Supreme Ind
Classic Cup and Handle Breakout
Indicators Bullish
T1 2360
T2 2405
T3 2680 Positional
SL 2170
Only For Study Purpose

SUPREMEINDCMP: 1969
- VCP breakout
- It's better to take an entry around 1935-40.
- Closed above 200 EMA after 3 months

Supreme Industries#SupremeInd CMP 1960 looks good for 2040/2220
SL 1850
ROCE 34.6 %
CWIP PY ₹ 51.0 Cr.
Debt to equity 0.01

SUPREME INDNote:
1. Views are personal and for educational purposes only. Recheck and take the trade as per your RR.
2. Always remember SL is your lifeline, not the big target...
3. Follow us for more patterns and like, share so that we feel it is helpful to many and share more patterns...
3. Views given here is not a tip rather it is for educational purpose... Aftermarket opens, the condition might change so learn to handle different conditions...
4. To learn more about patterns, Psychology behind the trade, and price action trading... contact us... Thanks...
Keep an eye ladies and gentlemen. Cheers and Happy Trading

SUPREMEIND - May rebound from the flip zoneCategory: Reversal
Key Highlights:
1. Bullish market structure on HTF
2. Sitting at the flip zone
3. Moving above 200 MA
Disclaimer: This is NOT investment advice. This chart is meant for learning purposes only. Invest your capital at your own risk.
Rajat Kumar Singh (@johntradingwick)
NSE Certified Technical & Fundamental Analyst
