Supreme industries Short opportunity !!!Supreme industries is looking good for a down move with very nice risk reward ratio...
Nothing much to explain.
Target and SL levels given in the chart
Just sharing my view...not a tip nor advice!!!
Thank you!!!
Supremeindustries

Supreme Ind (Daily) - Approaching Critical Res ConfluenceAfter a significant uptrend that concluded in June 2024, Supreme Industries entered a corrective downtrend lasting until April 2025. Since then, the stock has shown signs of a bullish reversal by establishing a pattern of higher lows , indicating that buyers are stepping in at progressively higher prices.
The Resistance Zone
Currently, the stock is approaching a major technical hurdle: a confluence of resistance . This is created by the intersection of a long-term downward-sloping (angular) trendline and a key horizontal resistance level. Multiple recent attempts to breach this zone, though unsuccessful, signal persistent buying interest and a buildup of pressure.
Indicator Analysis
Positive Signs: Trading volume has been healthy in recent sessions. Furthermore, the short-term Exponential Moving Averages (EMAs) have registered a bullish crossover , confirming positive short-term momentum.
Cautionary Signs: A long-term Golden Crossover (50-day SMA crossing above the 200-day SMA) has not yet occurred. This more significant signal would be needed to confirm a durable, long-term trend reversal.
Future Outlook & Key Levels
The future direction depends on the stock's ability to resolve the battle at the current resistance confluence.
Bullish Scenario: A decisive breakout and close above both trendlines would be a strong bullish signal. If this occurs, the stock could rally towards the next target of ₹5,060.
Bearish Scenario: If the resistance holds and the upward momentum fades, the stock could pull back to test its support level near ₹4,251.
Keep monitoring !!

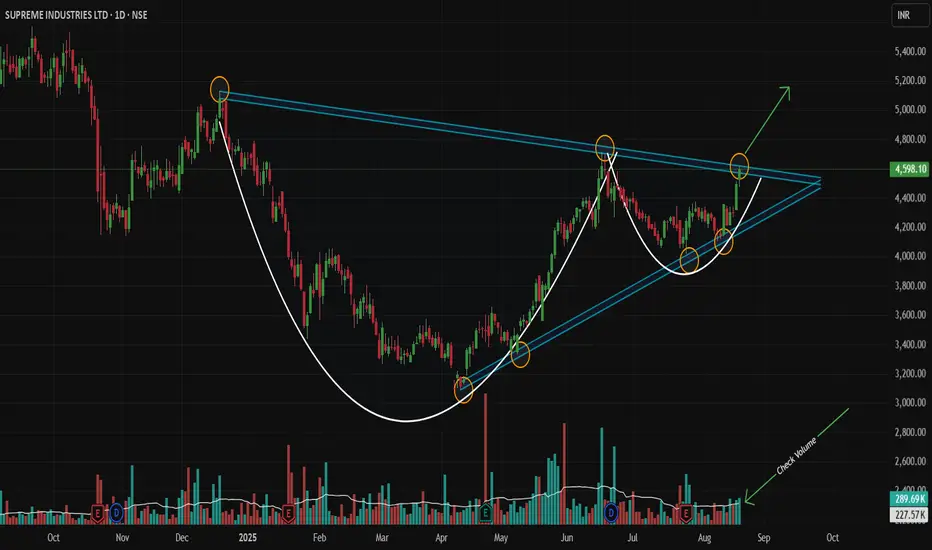
Nested Bullish Patterns Signal Major Breakout!Script: NSE:SUPREMEIND | Timeframe: Daily | Analysis Type: Technical (Pure Price Action) | Patterns: Symmetrical Triangle + Cup & Handle
Idea Summary 💡
A powerful, nested pattern setup is concluding on the daily chart! A large Symmetrical Triangle contains a secondary Cup and Handle (Bullish) pattern. This rare confluence signals strong accumulation and suggests an imminent, powerful upside breakout is likely!
Chart Pattern Logic 🔍
Primary Pattern (Symmetrical Triangle): Characterized by descending resistance (highs: Dec-18-2024, Jun-17-2025) and ascending support (lows: Apr-9-2025, May-9-2025, Jul-24-2025).
Secondary Pattern (Cup & Handle): Formed entirely within the triangle, adding a potent layer of bullish confirmation.
Confluence: This pattern-within-a-pattern setup significantly amplifies the potential for a strong upward resolution.
Trade Thesis 📈
Price is coiling at the triangle's apex under immense pressure. A decisive break above the upper trendline could ignite the next major bullish impulse phase.
Trade Setup ⚡
Direction: LONG 🟢
Entry Trigger: WAIT for a strong Marubozu green candle 🕯️ to close above the triangle's trendline on high volume (min. 1.5x average).
Stop Loss: Below the low of the breakout candle. 🛑
Profit Targets: 4700 🎯 | 4800 🎯 | 5125 🎯
Long-Term Target: 6000+ (Extended Target Based on Pattern Confluence & Momentum) 🚀
Risk Management: Trail stops aggressively after Target 1.
Got another stock you want me to break down? 📊
Drop the ticker in the comments below! If you found this idea useful, like and follow for more pure price action analysis.
Disclaimer: This post/information is solely for educational purposes and should not be construed as a recommendation or financial advice. Trading carries a risk of loss. Please conduct your own research or consult a financial advisor before making any investment decisions. The author and TradingView are not liable for any financial losses incurred based on this content.
Supreme Industries Indicates Potential Momentum Above 5150Details:
Asset: Supreme Industries Limited (SUPREMEIND)
Breakout Level: Sustaining above 5150
Potential Momentum: Upside momentum expected
Stop Loss: Below breakout level or as per risk tolerance
Timeframe: Short to medium-term
Rationale: Supreme Industries Limited (SUPREMEIND) has recently given a breakout and sustained above the 5150 level. This breakout could signify a bullish sentiment shift and pave the way for further momentum.
Market Analysis:
Technical Breakout: Sustaining above 5150 indicates a technical breakout, suggesting increased buying interest and potential upward momentum.
Market Sentiment: Positive market sentiment or company-specific factors may be contributing to the anticipated momentum in SUPREMEIND.
Potential Momentum:
With the breakout confirmed, SUPREMEIND may experience further upside momentum in the short to medium-term.
Risk Management:
Implementing a stop loss strategy below the breakout level is essential to manage risk in case of unexpected price reversals.
Timeframe:
The projected momentum for SUPREMEIND is based on a short to medium-term outlook, but actual timing may vary based on market conditions.
Risk-Reward Ratio: Consider individual risk tolerance and adjust position size accordingly to maintain a favorable risk-reward ratio.
As with any investment opportunity, conduct thorough analysis and consider factors such as market trends, company fundamentals, and risk management strategies before making trading decisions.

SUPREMEIND - Bullish above 2810Bullish Flag Pattern
Bullish above 2810
Disclaimers: I am not sebi registered analysis

SUPREME INDUSTRIES CAME OUT POSITIVE. TARGETSSupreme industries' results came out positive and the price is near the potential reversal zone of the XABCD bullish shark pattern.
The targets and the stop loss is mentioned on the chart.
Happy trading :)
This is just for educational purposes.

Breakout in Supreme Industries...Chart is self explanatory. Entry, Targets and Stop Loss are mentioned on the chart.
Disclaimer: This is for demonstration and educational purpose only. This is not buying or selling recommendations. I am not SEBI registered. Please consult your financial advisor before taking any trade.

Supreme Industries ....in consolidation modeThe stock is consolidating since last few weeks and is expected to move in the marked zone for few more days. once it breaks the upper resistance zone it will move upwards fastly.

SUPREMEIND Intraday Or BTSTSUPREMEIND is trading at its Weekly Trendline Support. So, we are just trying to play support buy combined with harmonic.
SUPREMEIND
Buy- Above 2130
Sl - 2090
Target - 2180 2200 2235

