Swiggy LtdSwiggy - The chart shows a well-defined ascending channel pattern, and price action is moving steadily between the parallel trendlines, respecting both the support and resistance lines
The latest candle shows a bounce from the lower channel support, which indicates continuation of the uptrend within the channel.
Buy above 440 | Target 460 and 460 | Stop loss 430
Swiggy

INFY 1D Time frame📉 Current Market Snapshot
Current Price: ₹1,525.60
Previous Close: ₹1,509.70
Day's Range: ₹1,521.10 – ₹1,542.90
52-Week High: ₹2,006.45
52-Week Low: ₹1,307.00
Market Cap: ₹6,33,794 crore
P/E Ratio: 23.0
Dividend Yield: 2.82%
ROE: 28.72%
Debt-to-Equity Ratio: 0.09
Beta: 1.11
EPS (TTM): ₹65.63
Face Value: ₹5.00
VWAP: ₹1,529.86
Volume: 12,856,963 shares
ATR (14): ₹5.72
MFI: 71.75
BANKNIFTY 4H Time frameCurrent Snapshot
Current Price around: ₹54,713 - ₹54,600
Day’s Range (4H): ₹54,400 – ₹54,705
Previous Close: ₹54,216
Opening Price (4H): ₹54,554
Volume: Moderate
🔑 Key Support & Resistance Levels
Immediate Support: ₹54,550
Next Support: ₹54,400
Immediate Resistance: ₹54,705
Next Resistance: ₹55,000
📈 Trend & Indicators
Trend: Mildly bullish; trading around 50-hour moving average.
RSI (14): 62 – Neutral to slightly bullish.
MACD: Positive → indicating mild bullish momentum.
Moving Averages: Short-term averages indicate neutral to slightly bullish bias.
🔮 Outlook
Bullish Scenario: Sustained move above ₹54,705 may push toward ₹55,000.
Bearish Scenario: Drop below ₹54,550 could bring a retracement to ₹54,400.
Neutral Scenario: Consolidation between ₹54,550 – ₹54,705; breakout needed for directional move.
📌 Key Factors to Watch
Performance of major banking stocks in BANKNIFTY.
Economic indicators such as interest rates and RBI policy updates.
Global market cues including US indices, crude oil, and currency movements.
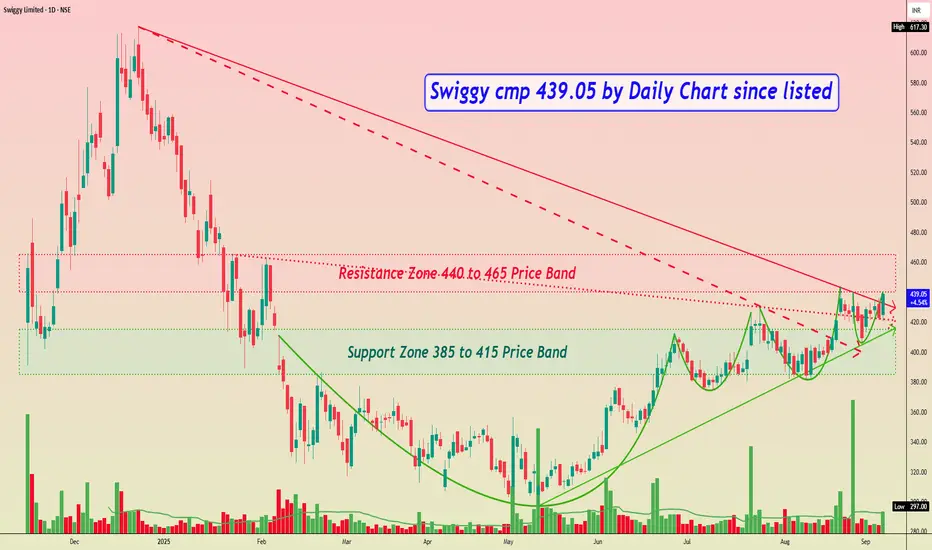
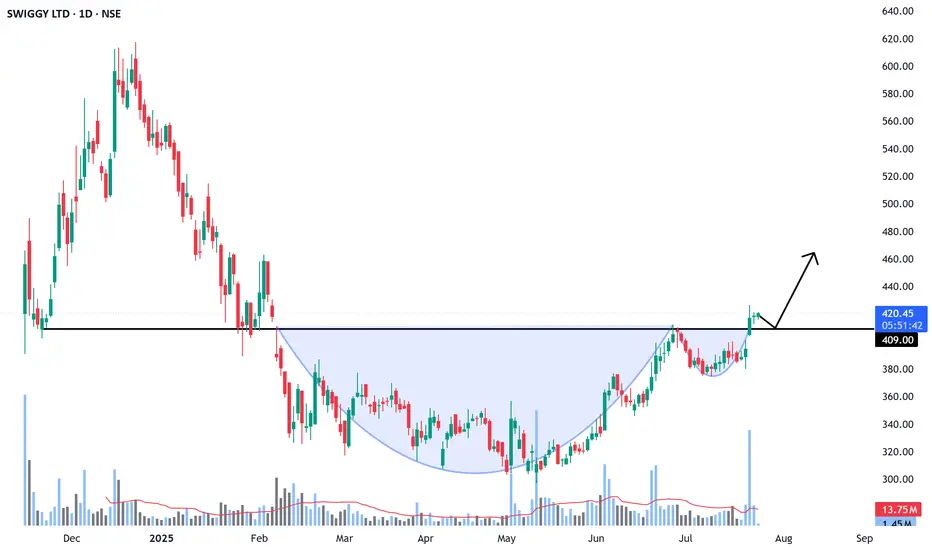
Swiggy cmp 439.05 by Daily Chart since listedSwiggy cmp 439.05 by Daily Chart since listed
- Support Zone 385 to 415 Price Band
- Resistance Zone 440 to 465 Price Band
- Rising Support Trendline well respected by Price momentum
- Bullish Cup and Handle followed by small Rounding Bottoms or a closely considerate VCP pattern
- Falling Resistance Trendline Breakout attempted with older Resistance Trendlines Breakout well sustained
- Volumes are spiking heavily at intermittent intervals and staying in close sync with the average traded quantity
ETERNAL LTDETERNAL – The stock trading in a rising parallel channel, making higher high and higher lows
Small consolidation (mini bullish flag) near the channel's upper half, which often leads to another upward leg if supported by volume.
If the stock breaks and sustains above 315 can get target 330 then 350. Manage the risk with strict SL at 300

Swiggy Ltd. Reserch ReportBuy/Sell/Hold Recommendation:
Given Swiggy’s strong revenue growth but continued losses and negative cash flows, the stock currently represents a high-risk, high-reward opportunity. Unless you have a high risk appetite and a long-term horizon, a "Hold" stance is appropriate—wait for visible margin improvement and positive cash flows before considering aggressive buying. For conservative investors, it’s best to avoid new buys until profitability and sustainable cash generation are in sight. Only enter or add if Swiggy shows concrete signs of turning profitable and scaling successfully.
HOld (Overvalued)
Swiggy Investment Report: Independent Strategic & Financial Outlook
Introduction
Swiggy, a leading player in India’s food delivery and quick commerce industry, continues to pursue aggressive growth and operational dominance, shaping its own strategic path amid sector challenges.
Financial Metrics
In FY25, Swiggy posted revenue of ₹15,227Cr but remained loss-making with a net deficit of ₹3,117Cr and negative EBITDA margins, reflecting heavy investment in technology, logistics, and expansion—especially in its Instamart quick commerce division. Capital expenditures and higher working capital are keeping free cash flows negative (-₹2,693Cr in FY25), underscoring the company’s high-growth, cash-consuming phase.
Strategic Progress & DCF Valuation
Swiggy’s management aims for positive cash flows and margin turnaround, with plans to steadily improve profitability by scaling operations and increasing efficiency. A detailed DCF analysis, based on realistic growth and margin improvement assumptions (cost of equity 11.79%, terminal growth 10%), implies an intrinsic value of around ₹143 per share—indicating the current market cap still prices in optimism about future execution.
Key Takeaways
Swiggy operates in a capital-intensive, competitive market, facing margin pressure but also strong revenue momentum.
Ongoing board and policy reforms reflect the company’s drive for operational maturity.
Long-term success hinges on rapid margin improvement, successful turnaround of Instamart, and conversion of scale into sustainable profits.
Conclusion
Swiggy’s independent outlook shows promise with its robust platform and growth potential, but significant risks remain until losses are narrowed and cash flows turn consistently positive. For investors, Swiggy presents a high-risk, high-reward bet—success will be determined by its pace of execution and ability to transition from investment-driven growth to profitable leadership in India’s booming delivery market.

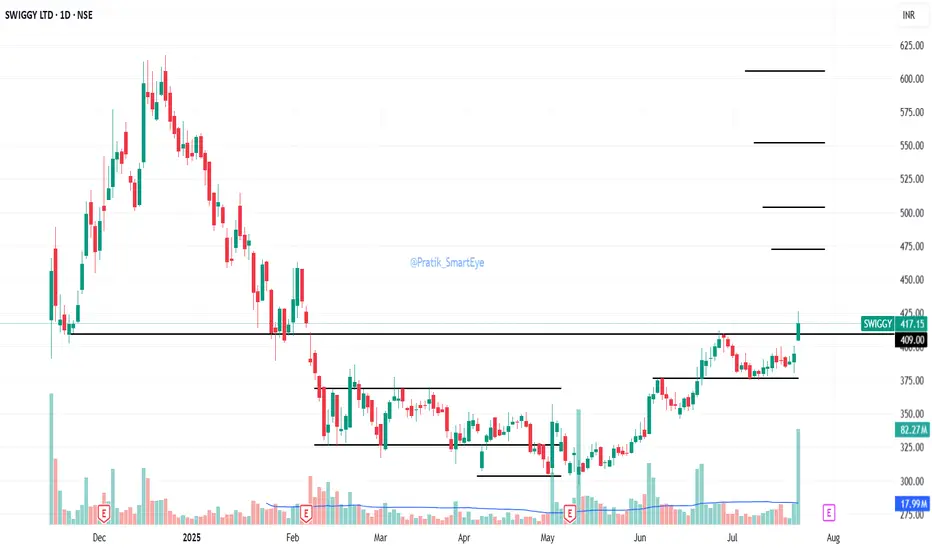
SWIGGY : Next Multi-bagger ??NSE:SWIGGY
🚀 SWIGGY LTD – Combined Technical + Fundamental Analysis
As of: 24 July 2025 | CMP: ₹420.50 |
📈 TECHNICAL ANALYSIS
🔷 Pattern: Cup and Handle Breakout
Cup & Handle pattern completed over 5 months (Feb–July 2025)
Breakout Level: ₹409 (marked horizontal resistance)
CMP: ₹420.50 — breakout confirmed with strong volume
Cup Depth: ₹409 – ₹285 = ₹124
🔍 Indicators & Price Action:
Price vs 50 EMA ✅ Above (bullish short-term trend)
Price vs 200 EMA ✅ Above (bullish long-term trend)
Volume ✅ Breakout confirmed with surge
RSI ~63 (strong but not overbought)
🔧 Key Levels:
Support Resistance Swing Target
₹409 (Breakout retest) ₹445 / ₹480 ₹533 (measured move)
Technical Verdict:
Bullish breakout from a long base. With volume confirmation and improving fundamentals, Swiggy is poised for a multi-week rally.
=======================================
📊 FUNDAMENTAL ANALYSIS
📈 1. Revenue Growth
Swiggy has shown consistent and impressive topline expansion over the past 3 years:
Financial Year Revenue (₹ Cr) YoY Growth
FY22 ₹5,705 –
FY23 ₹8,265 +45%
FY24 ₹11,115 +34%
FY25 (Est.) ₹14,500 +30% est.
Growth Drivers:
🚀 Instamart (Grocery) – fastest-growing vertical
🍽️ Food Delivery – steady in Tier I, expanding in Tier II/III
📍 Strong presence in metros, improving reach in smaller cities
💰 2. Profit Trajectory
Swiggy was known for heavy cash burn pre-IPO, but is now nearing profitability:
Financial Year Net Profit/Loss (₹ Cr) EBITDA (₹ Cr)
FY23 -₹4,179 -₹3,363
FY24 -₹1,482 -₹1,115
FY25 (Est.) +₹75 (Profit) +₹350
📉 Losses reduced by over 60% in 12 months
🔁 EBITDA-positive since Q4 FY25 — a major turning point
🛠️ Cost control, reduced discounting, and Instamart’s scale driving margin growth
🌱 3. Future Growth Prospects
Swiggy is now strategically positioned to capture multiple long-term themes:
Segment Outlook Comments
Instamart 🌟 High Growth 60%+ YoY growth, core revenue driver by FY26
Food Delivery 🔁 Steady to Moderate Strong in metros; Tier II/III scaling slowly
Dineout + Genie 🧊 Low Growth Not major contributors, but strengthen ecosystem
New Revenue 🧠 Ads, cloud kitchens High-margin potential in FY26/FY27
🧾 IPO proceeds deployed into logistics & tech infra (no major debt)
📈 Possible MSCI/Nifty Next 50 inclusion in FY26
🔓 Optionality: Entry into fintech/payments, loyalty programs, and dark kitchens
🔚 COMBINED VIEW – TECHNICAL + FUNDAMENTAL
Technical Pattern ✅ Cup & Handle breakout at ₹409
Revenue Trend ✅ Strong CAGR ~36%
Profit Outlook ✅ Profitability by FY25 end
Future Potential ✅ High – Instamart + Ads + Tier-II expansion
Risk ⚠️ Valuation premium + ONDC threat remains
⚠️ Disclaimer:
This analysis is for educational and informational purposes only.
We are not SEBI-registered analysts or advisors.
This is our personal view based on available data and market trends.
Please consult your SEBI-registered investment advisor before making any investment or trading decisions.
You are solely responsible for any financial decisions you make based on this content.
========================
Trade Secrets By Pratik
========================
Swiggy: Base BreakoutSwiggy: up 5.67% today CMP 417, tested the resistance of 409 on 27June25 as indicated previously followed by retracement & bounce.
Breakout above 409 supported with good volumes today.
Resistance 472/504/551/605
Support 409/376
Earnings expected on 31July25
Learn Institutional Trading Part-9🎯 Why Learn Advanced Option Trading?
Advanced option trading lets you:
✅ Profit in bullish, bearish, or sideways markets
✅ Use time decay to your advantage
✅ Limit risk while maximizing potential reward
✅ Create non-directional trades
✅ Build hedged and balanced positions
✅ Use data, not emotion for decision making
It shifts you from being a trader who hopes for direction to one who profits from market behavior — movement, volatility, time decay, and imbalance.
🧠 Core Concepts in Advanced Option Trading
1. Option Greeks
Understanding the Greeks is essential for advanced strategies.
Delta: Measures price sensitivity to the underlying (helps with directional trades).
Theta: Measures time decay. Option sellers use Theta to earn premium.
Vega: Measures sensitivity to implied volatility (IV).
Gamma: Measures how Delta changes — useful for adjustments and hedging.
Rho: Interest rate sensitivity (used in long-term options).
Greeks help you balance risk and reward and fine-tune your strategies based on volatility and time.
2. Implied Volatility (IV) & IV Rank
IV shows the market’s expectation of future volatility.
High IV = high premium; low IV = cheap premium.
IV Rank compares current IV to its past 52-week range — essential for deciding whether to buy or sell options.
💡 Advanced rule:
High IV + High IV Rank = Favor selling options
Low IV + Low IV Rank = Favor buying options
3. Multi-Leg Strategies
Multi-leg trades involve using more than one option to hedge, balance, or amplify your position.
Here are the most popular advanced option strategies:
🔼 Bullish Strategies
🔹 Bull Call Spread
Buy one lower strike Call, sell a higher strike Call
Profits if the market rises within a defined range
Lower cost than buying a single Call
🔹 Synthetic Long
Buy a Call and Sell a Put of the same strike
Replicates owning the underlying, but with options
🔽 Bearish Strategies
🔹 Bear Put Spread
Buy a higher strike Put, sell a lower strike Put
Profits if market falls within a defined range
🔹 Ratio Put Spread
Buy one Put, sell two lower-strike Puts
Low-cost or credit strategy with higher reward if price falls moderately
🔁 Neutral or Range-Bound Strategies
🔹 Iron Condor
Sell one Call spread and one Put spread
Profits if market stays between both spreads
Ideal in low volatility, sideways markets
🔹 Iron Butterfly
Sell ATM Call and Put, buy OTM wings
Profits from time decay and stable price
High Theta, limited risk and reward
🔹 Straddle (Buy/Sell)
Buy/Sell ATM Call and Put
Used when expecting high volatility (Buy) or low volatility (Sell)
🔹 Strangle
Buy/Sell OTM Call and Put
Lower cost than Straddle, wider profit zone
🛡️ Hedging Strategies
🔹 Protective Put
Hold underlying asset, buy a Put to limit downside
Like insurance for your long position
🔹 Covered Call
Hold stock, sell a Call to generate income
Profitable if the stock stays flat or rises slightly
🔹 Collar Strategy
Hold stock, buy Put and sell Call
Risk defined, reward capped — good for conservative investors
📊 Open Interest & Option Chain Analysis
Open Interest (OI) shows where the majority of contracts are built.
High OI + Price Rejection = Institutional Resistance/Support.
Watching Call/Put buildup gives clues about range, breakout zones, and expiry-day moves.
💡 PCR (Put Call Ratio): A sentiment indicator.
PCR > 1: More Puts → Bearish
PCR < 1: More Calls → Bullish
⏱️ Time Decay & Expiry Trades
Advanced traders use weekly options to capitalize on Theta decay. Weekly expiry strategies include:
Short Straddles/Strangles
Iron Condors
Calendar Spreads
These strategies make use of:
Fast premium decay on Thursday/Friday
Stable market periods
Defined risk setups
🧠 Advanced Psychology & Risk Control
Professional option traders don’t overtrade or overleverage. They:
Follow the 1–2% risk per trade rule
Avoid trading during event-based spikes (e.g., budget, Fed speeches)
Take non-directional trades in consolidating markets
Focus on probability over prediction
Maintain a trading journal and review setups
🎓 Pro Tips to Master Advanced Option Trading
✅ Understand the Greeks — especially Theta & Vega
✅ Use multi-leg strategies to reduce risk and cost
✅ Follow IV Rank — don’t buy expensive options
✅ Use high reward-to-risk setups
✅ Track OI build-up and option chain flow
✅ Avoid gambling — options are tools, not lottery tickets
✅ Always use hedged positions, especially when selling options
🧘 Final Words: Become the Strategist, Not the Speculator
Advanced Option Trading is not about guessing where the market will go — it’s about constructing trades that win in multiple scenarios.
It empowers you to:
Manage risk like a professional
Generate regular income from time decay
Adjust and defend trades when things go wrong
Trade with confidence, not emotion
If you’re ready to move beyond basic buying and start mastering the real edge in options, advanced strategies are your next level. This is how institutions trade. This is how real consistency is built.

BANKNIFTY - 1D Timeframe📅 Current Market Status (as of July 18, 2025)
Closing Price: ₹56,283
Fall Today: –547 points (–0.96%)
Intraday Range: ₹56,205 (Low) to ₹56,849 (High)
52-Week Range: ₹43,199 (Low) to ₹57,817 (High)
2025 Performance So Far: Up around 9.5%
🧮 Moving Averages – All Are Negative
From 5-day to 200-day, all moving averages are giving SELL signals.
This confirms a strong downtrend.
Price is below every major moving average → means no strength for recovery yet.
📉 Support and Resistance Levels
Type Price Range
Support ₹55,800 – ₹56,000
Resistance ₹56,700 – ₹57,200
If the price falls below ₹55,800, we may see further fall toward ₹55,000.
For any upward trend to begin, Bank Nifty must close above ₹57,200.
⚠️ Market Mood – What’s Going On?
Strong Downtrend: Bears are in control; market is falling continuously.
High Volume on red candles: Big traders are selling heavily.
Oversold Condition: Market has fallen too much, may bounce a little.
High Volatility: Big movements (500–600+ points) can happen daily.
✅ Easy Summary
Overall Trend: Bearish (Downtrend)
Short-Term Possibility: Small upward bounce may come due to oversold indicators
But: No proper recovery signal until Bank Nifty moves above ₹57,200
Traders should be cautious – trend is still weak and selling pressure is high.
🔮 What to Watch Next?
RSI Above 35: Could be an early sign of recovery.
MACD Crossover: Needed for trend reversal.
Low Red Candle Volume: Means selling may be ending.
₹55,800 Support: If this breaks, further downside likely
Trade Like Istitution Why Learn to Trade Like Institution?
Financial markets are not random. They are highly manipulated and structured systems, controlled by major financial entities. When you trade like institution, you stop guessing and start understanding:
Where the big players place their orders.
How liquidity zones work.
Why certain price levels are targeted before major moves.
How you can identify smart money footprints and follow the dominant trend.
This approach teaches you to trade strategically, patiently, and professionally — eliminating the emotional rollercoaster most traders experience.
What You Will Learn in “Trade Like Institution”
✅ Smart Money Trading Concepts
Understand how institutions manipulate markets, create liquidity, and trap retail traders. Learn the basics of accumulation, manipulation, and distribution phases.
✅ Market Structure and Order Flow
Read the market from an institutional perspective using pure price action and market structure analysis. Identify break of structure (BOS) and change of character (CHoCH) signals that reveal when the market is about to move.
✅ Order Block Identification
Learn to locate order blocks, where institutions place their large orders. These zones are often the key areas where price reverses or explodes in a specific direction.
✅ Liquidity Zones and Stop-Loss Hunting
Discover how to identify liquidity pools, understand stop-loss hunting techniques, and position yourself for trades after liquidity grabs.
✅ Risk Management Like Institutions
Master the art of risk management, learning how big players manage risk efficiently to stay profitable long-term, even after losses.
✅ High-Probability Trade Setups
Get access to reliable entry techniques with precise stop-loss placement and optimal reward-to-risk setups that minimize risk and maximize returns.
✅ Live Market Application
Learn through real-world market examples, live sessions, and chart analysis to see how institutional concepts apply in active markets like forex, stocks, indices, and crypto.
Who Should Learn to Trade Like Institution?
This course is designed for:
📊 New traders who want to start the right way without falling into retail traps.
💡 Intermediate traders who have experience but struggle with consistency.
💼 Full-time or part-time traders who wish to level up their skills.
📈 Investors who want to actively manage and grow their wealth.
🎯 Ambitious traders who want to make trading a serious and professional income source.
Benefits of Trading Like Institution
✅ Stop being a victim of market manipulation and start trading with the market movers.
✅ Eliminate confusion, follow clean price action, and trade with confidence.
✅ Avoid low-probability trades by understanding where the real market action happens.
✅ Build strong discipline and follow a professional trading process.
✅ Achieve long-term profitability by managing risk like professionals.
✅ Become a confident, independent trader capable of thriving in any market condition.
Trading success comes from learning the truth behind market movements and following the professional path. This course will completely transform your approach to the markets. With Trade Like Institution, you’ll stop guessing, start predicting, and trade with an edge just like the top institutional traders do every single day

GIFT Nifty Signals Bullish Start🏛️ What is GIFT Nifty?
Let’s start with the basics.
GIFT Nifty is the new name for what used to be known as the SGX Nifty—a derivative contract that mirrors the Nifty 50, but is traded outside India.
It now runs on the GIFT City platform (Gujarat International Finance Tec-City).
It gives traders, especially foreign institutional investors (FIIs), the ability to trade in Nifty futures even before the Indian market opens.
Think of it as an early indicator of how the Nifty 50 might perform when the Indian market opens at 9:15 am.
✅ Important: GIFT Nifty is NOT a separate index.
It simply reflects the expected movement of the Nifty 50 index, based on global market cues and overnight developments.
🧠 Why Did SGX Nifty Become GIFT Nifty?
Until July 2023, the Nifty futures were traded on the Singapore Exchange (SGX).
But to bring more liquidity and volume back to Indian shores and to establish India as a global financial hub, the trading of Nifty derivatives was moved from Singapore to the GIFT IFSC platform.
Thus, SGX Nifty became GIFT Nifty.
📈 Why GIFT Nifty’s Morning Move Matters
Each morning, traders, analysts, media houses, and even retail investors check GIFT Nifty levels.
Why?
Because it acts as a directional clue. Here’s how:
If GIFT Nifty is up by 100 points, it’s a sign that Nifty 50 is likely to open higher.
If it’s down by 75 points, it hints at a gap-down opening.
It reflects the sentiment of global markets, overnight US cues, geopolitical risks, and FII mood.
📊 Example:
GIFT Nifty trading at 22,450 (up 80 points)
Yesterday’s Nifty close: 22,370
→ Bullish sign → Indian markets may open with a gap-up of 70–100 points.
📌 What Does “Bullish Start” Mean?
A bullish start means the market is expected to open on a positive note—meaning, the index (like Nifty or Sensex) may start the day higher than the previous day’s closing.
This can happen due to:
Strong global cues (e.g., Dow Jones, Nasdaq closing higher)
Positive FII activity
Good earnings announcements
Supportive macroeconomic data
Favorable government or budget policy
Cooling of global tensions or crude oil prices
So, when GIFT Nifty shows a positive movement before 9 am, traders call it a bullish pre-market setup.
🔍 Real-World Example – July 18, 2025
On July 18, 2025:
GIFT Nifty was up by 55 points, indicating a positive start.
This came after a volatile weekly expiry on Thursday.
Strong earnings expected from companies like Reliance, JSW Steel, L&T Finance added to positive sentiment.
US markets closed flat, but no major negative surprise.
FIIs were net sellers, but DIIs absorbed selling pressure.
→ All this combined gave a green signal from GIFT Nifty to the domestic market.
💼 How Traders Use GIFT Nifty in Strategy
✅ 1. Pre-Market Planning
GIFT Nifty gives early clues, so:
Intraday traders plan opening range setups
Option traders adjust straddles/strangles based on expected gap
F&O traders look at overnight position rollover
✅ 2. Risk Management
A weak GIFT Nifty warns of gap-downs due to global negativity.
This allows traders to:
Hedge long positions
Tighten stop-losses
Avoid aggressive morning trades
✅ 3. Sectoral Rotation
If GIFT Nifty is up, focus shifts to high-beta stocks like Bank Nifty, Reliance, Adani Group, etc.
If it's down, defensive plays like FMCG and Pharma may perform better.
🧮 How to Read GIFT Nifty Properly?
Here are 3 simple tips:
✔️ Tip 1: Compare with Previous Day’s Nifty Close
If GIFT Nifty > Last close → Gap-up expected
If GIFT Nifty < Last close → Gap-down likely
✔️ Tip 2: Watch Global Cues
Dow/Nasdaq closing + crude oil + USD/INR = impact GIFT Nifty
If all show strength, GIFT Nifty usually reacts positively
✔️ Tip 3: Use With FII/DII Data
Bullish GIFT Nifty + FII Buying = Strong setup
Bullish GIFT Nifty + FII Selling = Weak opening might reverse later
🌎 GIFT Nifty & Global Linkage
India is now deeply linked with:
US markets (Nasdaq, S&P 500)
Crude oil
Dollar Index
Global interest rate policies (Fed, ECB)
So if:
US markets crash overnight → GIFT Nifty reacts instantly
Crude oil falls sharply → Positive for India → GIFT Nifty turns green
📍 Important: GIFT Nifty Is Not Always Accurate
Sometimes GIFT Nifty shows bullish signs, but:
Domestic news (politics, budget) pulls market down
FII/DII data surprises post-opening
Index gaps up but then reverses during the day
That’s why traders use GIFT Nifty as a clue, not a guarantee
🚦 Final Thoughts – Why You Should Watch GIFT Nifty
GIFT Nifty is like the morning alarm for the market:
It tells you what’s likely to happen before the bell rings.
Gives you a head start to plan your trades.
Helps spot sectoral strength, F&O positioning, and market mood.
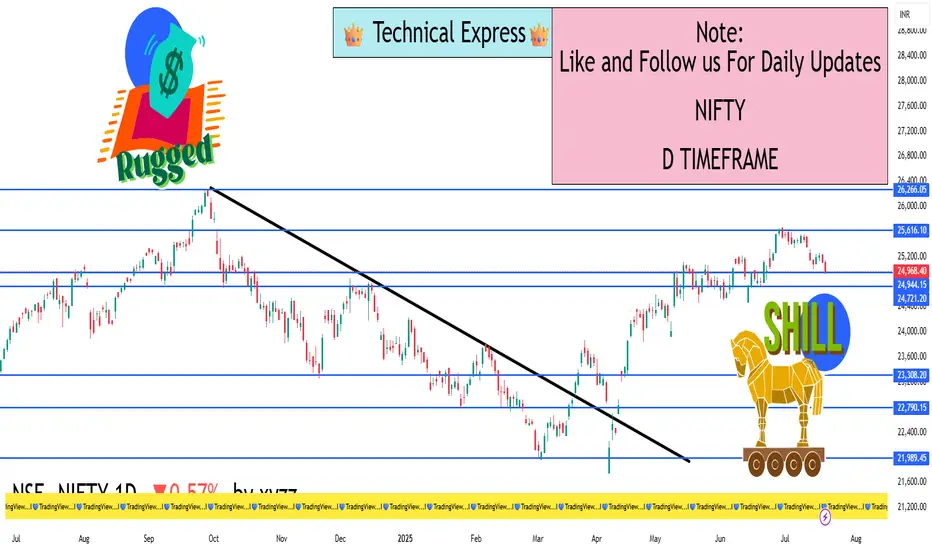
Nifty 50 – 1 Day Timeframe✅ Closing Summary:
Closing Price: ₹24,968.30
Change: −₹143.55 (−0.57%)
Opening Price: ₹25,108.55
Intraday High: ₹25,144.20
Intraday Low: ₹24,919.10
Nifty 50 traded in a narrow but bearish range throughout the session, losing nearly 0.6%, as market sentiment remained weak due to earnings pressure and global cues.
🔍 Key Reasons for the Decline:
Banking Sector Drag:
Major private sector banks like Axis Bank reported weaker-than-expected earnings, sparking a broad sell-off in financials.
Financial stocks make up a large portion of Nifty 50, pulling the entire index lower.
Cautious Investor Sentiment:
Global uncertainty regarding U.S. Federal Reserve interest rate decisions and economic slowdown concerns weighed on overall risk appetite.
Investors are also being cautious ahead of major Indian corporate earnings from companies like HDFC Bank, ICICI Bank, Reliance Industries, and others.
Foreign Institutional Selling (FII):
FIIs continued to sell Indian equities, especially large-cap financials and IT stocks.
This added selling pressure even as some domestic institutional investors tried to buy the dips.
Technical Weakness:
The index slipped below the 25,000 psychological support level, a sign of short-term technical weakness.
Intraday recoveries were capped near resistance, confirming the bearish tone.
📈 Technical Outlook (Short-Term):
Support Zone: ₹24,900 to ₹24,850
This is the next critical area. If broken, further decline toward ₹24,600 is likely.
Resistance Zone: ₹25,150 to ₹25,300
Bulls need to reclaim this zone for the trend to turn positive again.
Momentum Indicators:
RSI: Slipping below 45, showing weakening momentum.
MACD: Bearish crossover; trend remains under pressure.
Volume: Slightly above average, indicating serious selling interest at the top.
📆 Recent Trend Performance:
1-Day Return: −0.57%
1-Week Return: −0.35%
1-Month Return: +2.10%
6-Month Return: +12.8%
1-Year Return: +10.9%
Nifty 50 remains in a medium- to long-term uptrend, but short-term correction is underway, largely due to sector-specific drag and earnings volatility.
🧠 What Traders & Investors Should Know:
Day Traders: Watch for quick reversals near support at ₹24,900; consider shorting near resistance if recovery fails.
Swing Traders: Wait for either a bullish reversal candle or RSI bounce before entering fresh long positions.
Long-Term Investors: Despite the dip, the market remains healthy. This could be a buy-on-dip opportunity, especially in sectors like auto, pharma, and capital goods that are holding well.
💬 Conclusion:
Nifty 50 showed weakness on July 18 due to negative earnings surprises and bearish sentiment in financials. While technical indicators suggest short-term downside pressure, the broader long-term trend remains intact. Key support at ₹24,900 is crucial. A bounce from that zone can trigger a recovery, but a sustained break below it could accelerate the decline
FMCG & ConsumptionThink about your daily life — the toothpaste you use, the biscuits you eat, the shampoo you prefer, the tea you drink, the food delivery app you order from. Every one of these touches a part of the FMCG & consumption sector.
Now multiply that by 1.4 billion Indians, and you realize the size of this engine.
In 2025, the FMCG (Fast-Moving Consumer Goods) and consumption-driven stocks are at the center of a powerful story — one shaped by:
India's rising middle class
Rural income revival
Urban premiumization
Growth of e-commerce and quick commerce
Digital payments & new-age D2C (Direct-to-Consumer) brands
This isn't just a theme — it's a structural growth trend that never goes out of fashion.
Let’s break it down step-by-step.
🧼 What is FMCG & Consumption Sector?
FMCG stands for Fast-Moving Consumer Goods. These are everyday products people buy frequently:
Food & beverages (biscuits, noodles, soft drinks, snacks)
Personal care (soap, shampoo, deodorant)
Household items (detergent, floor cleaner, toothpaste)
Over-the-counter (OTC) products (balms, cough syrup, nutrition)
The Consumption theme expands on this to include:
Retail (organized & unorganized)
Quick commerce (Blinkit, Zepto)
E-commerce (Amazon, Flipkart, Nykaa)
Food delivery (Zomato, Swiggy)
Apparel & footwear (Trent, Aditya Birla Fashion)
Durables & electronics (TVs, fridges, fans, phones)
So whether it’s Maggi or Myntra, Parle-G or Paytm Mall — it all fits under Consumption.
🔥 Why FMCG & Consumption Is Trending in 2025
Let’s look at what’s driving this sector today:
1️⃣ Rural Demand Is Rebounding
After 2 years of low rural growth due to inflation and erratic monsoons, 2025 has brought strong crop output, stable agri prices, and more cash in hand.
Rural India forms over 40% of FMCG consumption, especially:
Entry-level soaps, snacks, tea
Sachet products
Local brands
Companies like Dabur, HUL, Marico, and Emami have all confirmed rural growth is picking up fast.
2️⃣ Premium Urban Consumption Is Booming
At the same time, India’s cities are upgrading:
Tier-2 cities now demand premium face creams, health foods, organic juices
Young consumers are choosing branded wear, subscription boxes, and gourmet snacks
Working women are driving personal care product sales
Urban India is moving from price to value, and that’s a goldmine for consumer brands.
3️⃣ Quick Commerce Is Changing Habits
Apps like Blinkit, Zepto, Swiggy Instamart are:
Delivering goods in 10–20 minutes
Creating new demand cycles (midnight snacking, impulse buys)
Becoming a new channel for FMCG sales
For FMCG companies, this means higher turnover and visibility, especially for smaller SKUs (sachets, ₹5/₹10 packs).
4️⃣ Direct-to-Consumer (D2C) Boom
New-age startups like:
Mamaearth (beauty, baby care)
WOW Skin Science (natural shampoos)
BoAt (audio & smart accessories)
Licious (fresh meats)
…are bypassing traditional stores and selling directly online.
This model:
Cuts middlemen
Boosts margins
Creates brand intimacy
And now many of these brands are listed or IPO-ready, adding fire to the consumption story.
5️⃣ China+1 & Make in India Push
Many global companies now manufacture in India, not China:
Personal care
Cosmetics
Packaged foods
This reduces costs, improves supply chains, and boosts exports of Indian FMCG brands too.
📈 Stock Market Performance (2023–2025)
Let’s take a look at how some top names have performed:
Stock Jan 2023 Price July 2025 Price Return
ITC ₹340 ₹460+ 35%
Hindustan Unilever ₹2,500 ₹2,800+ 12%
Dabur ₹550 ₹675+ 22%
Nestle India ₹18,000 ₹24,000+ 33%
Zomato ₹55 ₹195+ 250%+
Nykaa ₹120 ₹180+ 50%
Mamaearth (Honasa) ₹320 (IPO) ₹460+ 44%
Quick commerce, D2C and food delivery stocks have been top gainers.
Traditional FMCG majors are more slow & steady compounders.
🛒 Segments Inside FMCG & Consumption
Let’s divide this into sub-themes:
🍪 1. Packaged Foods & Beverages
Britannia (biscuits)
Nestle India (Maggi, chocolates)
Tata Consumer (tea, coffee, salt)
Varun Beverages (Pepsi bottling)
Bikaji, Prataap Snacks (local snacks)
🧼 2. Personal & Household Care
HUL (Dove, Surf Excel, Lifebuoy)
Dabur (Chyawanprash, Vatika)
Marico (Parachute, Saffola)
Godrej Consumer (Goodknight, Cinthol)
Emami (Fair & Handsome, Navratna)
🛍️ 3. Retail Chains & Apparel
Trent (Westside, Zudio)
V-Mart
Avenue Supermarts (D-Mart)
Aditya Birla Fashion (Pantaloons, Van Heusen)
Shoppers Stop
🍕 4. Online Food & Quick Commerce
Zomato
Jubilant Food (Domino’s)
Devyani International (KFC, Pizza Hut)
Zepto (IPO coming soon)
Blinkit (part of Zomato)
💄 5. Beauty & D2C Personal Care
Honasa (Mamaearth)
Nykaa
Lotus Herbals (Private)
WOW Skin Science (IPO Expected)
💡 Why Traders and Investors Love This Sector
✅ Always in Demand – Recession or boom, people still need soap and toothpaste.
✅ Strong Brand Power – Consumer loyalty = pricing power = margin stability.
✅ Low Capex Businesses – High return on capital, especially for asset-light D2C models.
✅ Growth via Premiumization – Indians are trading up from "cheap" to "value".
✅ Earnings Predictability – FMCG companies often beat or meet earnings estimates.
📊 How to Trade or Invest in This Theme
🎯 For Long-Term Investors:
Pick 3–4 companies across segments:
One traditional FMCG major (HUL, ITC)
One high-growth food player (Nestle, Varun Beverages)
One retail/delivery stock (Zomato, Trent)
One new-age D2C story (Mamaearth, Nykaa)
Hold for 3–5 years. These stocks are slow compounders with low risk + decent reward.
📉 For Traders:
Look for volume breakouts after consolidation
Track monthly updates on rural/urban growth
Trade around quarterly results and guidance
Use options strategy around earnings for volatility plays (like Zomato)
⚠️ Risks to Watch Out For
Risk Explanation
Inflation Pressure Higher input costs (milk, palm oil) hurt margins
Valuation Concerns Some D2C stocks may be overpriced
Competition from Local Players Especially in rural and Tier-3 cities
Dependency on Monsoon A weak monsoon can dent rural demand
🚀 The Road Ahead (2025–2030)
India is expected to:
Add 250 million middle-class consumers by 2030
See online retail double in size
Witness over 500 million people shop on mobile phones
Grow FMCG exports to Asia & Africa
The Indian consumption engine is just starting up. This isn't a temporary trend — it’s a secular, multi-decade opportunity.
✅ Conclusion
The FMCG & consumption story in India is:
Stable during slowdowns
Explosive during booms
Universal in reach — touching every home, city, and village
Now evolving rapidly with D2C, quick commerce, and premiumization
Whether you're an investor looking for consistent compounding or a trader looking for smart momentum plays, this is one of the most powerful sectors to focus on in 2025 and beyond

Difference Between Technical Analysis and Option Chain Analysis✅ 1. What is Technical Analysis?
Technical Analysis (TA) is the art and science of predicting future price movements based on historical price and volume data.
It’s like checking a stock’s past behavior on a chart to guess what it might do next.
🧠 How Does It Work?
Uses charts (candlestick, line, bar)
Studies patterns (head and shoulders, cup & handle, flags, etc.)
Applies indicators (RSI, MACD, Moving Averages, Bollinger Bands)
Identifies support & resistance levels
Helps time entry and exit points
📊 What Does It Tell You?
Is the stock trending up or down?
Is it overbought or oversold?
Where are strong support/resistance zones?
Is a breakout or breakdown happening?
🧰 Tools Used in Technical Analysis:
TradingView, Chartink, Zerodha Kite, Upstox Pro, etc.
Indicators: RSI, MACD, EMA, VWAP, Supertrend
Patterns: Breakout, Double Top, Flag Pattern, etc.
✅ 2. What is Option Chain Analysis?
Option Chain Analysis is specific to derivatives trading. It looks at open interest (OI), premiums, and strike prices to understand what option traders are betting on.
It helps you decode the behavior of big players (institutions) in the options market — especially on indices like Nifty, Bank Nifty or liquid stocks like Reliance, HDFC Bank, etc.
🧠 How Does It Work?
An option chain shows all available strike prices and their:
Call (CE) and Put (PE) premiums
Open Interest (OI) — how many contracts are outstanding
Changes in OI — fresh buying/selling activity
Volume traded
Implied Volatility (IV) — market’s expectations of volatility
📊 What Does It Tell You?
Where is the market expecting resistance? (High Call OI = resistance)
Where is the market expecting support? (High Put OI = support)
What are option writers (big players) doing?
Is the market bullish, bearish, or neutral?
🧰 Tools Used in Option Chain Analysis:
NSE Website (Option Chain)
Sensibull, Opstra, QuantsApp, StockMock
Open Interest Analysis Tools
PCR (Put Call Ratio)
Max Pain Theory
⚖️ Key Differences: Technical Analysis vs Option Chain Analysis
Feature Technical Analysis Option Chain Analysis
Used For Any stock, index, or crypto Only in derivatives (Options)
Data Based On Price, volume, chart patterns OI, strike prices, premiums, IV
Who Uses It? All traders (equity, F&O, forex, crypto) Mostly F&O traders and option
Time Horizon Intraday to long-term Intraday to expiry-based
📌 Practical Example (Nifty)
🔍 Technical View:
Nifty is making higher highs, higher lows
RSI = 60 → Momentum is still strong
20 EMA is acting as support
➡️ Suggests bullish trend — buy on dips
📈 Option Chain View:
Highest Call OI at 24,000 → Strong resistance
Highest Put OI at 23,500 → Strong support
Put writing increasing at 23,600 → Bulls defending this level
➡️ Suggests market may stay between 23,500–24,000
🎯 When to Use Which?
Situation Use This
Want to analyze a stock's trend Technical Analysis
Trading non-derivativ e stocks Technical Analysis
Intraday scalping Both (TA + OI levels)
Trading Nifty/Bank Nifty Options Option Chain Analysis
Looking for expiry range predictions Option Chain
Want to confirm breakout strength Combine both!
💡 Best Strategy: Combine Both!
Professional traders don’t treat these as either-or.
They often use:
📉 Technical analysis to find chart setups
🧠 Option chain data to confirm big player positions
Example:
A breakout on chart + strong Put OI at breakout level = high-probability trade.
✅ Summary
Aspect Technical Analysis Option Chain Analysis
Based on Charts, price, volume OI, premiums, strike data
Used for All trading instruments Only options
Helps in Timing trades, spotting patterns Predicting expiry range
Tools RSI, MACD, Patterns, EMAs OI, IV, Max Pain, PCR
Users Retail + institutional traders Mainly option traders, F&O players
🚀 Final Thought
Both tools are powerful in their own right. But when used together, they give you a 360° edge in the markets.
Technical analysis shows you what's happening on the chart.
Option chain analysis shows you what traders expect to happen behind the scenes.
Mastering both is the true trader’s advantage
What is FII and DII✅ What is FII and DII?
These are two major types of investors who invest huge amounts of money in the Indian stock market.
Acronym Full Form Meaning
FII Foreign Institutional Investor Big investors from outside India
DII Domestic Institutional Investor Big investors within India
🧠 Let’s Understand Them One by One:
🔵 FII – Foreign Institutional Investor
These are large investment firms, hedge funds, mutual funds, pension funds, insurance companies, etc. from outside India.
They invest in Indian equity markets, debt markets, bonds, etc.
Registered with SEBI to invest in Indian markets
📌 Examples:
Morgan Stanley
BlackRock
Goldman Sachs
Vanguard
JP Morgan Asset Management
🎯 Why They Invest in India?
Growth opportunity in Indian economy
Higher returns compared to developed markets
Long-term story of India = bullish
🔥 When FII inflow increases:
Nifty, Sensex, Bank Nifty usually go up
Especially impacts large-cap stocks (Reliance, HDFC, ICICI Bank)
🔴 DII – Domestic Institutional Investor
These are big Indian institutions that invest in Indian markets.
Includes:
Mutual Funds (like SBI MF, ICICI Pru MF)
Insurance companies (LIC, HDFC Life)
Banks (SBI, HDFC Bank treasury)
Pension funds (EPFO)
📌 They manage common people's money, and invest in:
Equity (stocks)
Debt (bonds, government securities)
🎯 Why DIIs Matter?
Provide stability to markets
When FIIs sell, DIIs often support the market by buying
📊 FII vs DII - Key Differences
Factor FII DII
Based I Foreign Countries India
Regulated By SEBI SEBI
Invest In Equity, Bonds, Derivatives Equity, Bonds, Mutual Funds
Impact On Market Highly volatile, quick to enter/exit More stable, long-term investing
Popular Examples BlackRock, JP Morgan, Nomura LIC, SBI Mutual Fund, ICICI Pru MF
🧭 Why Traders Watch FII/DII Data Daily
📈 FII/DII Activity Shows Market Mood
When FIIs are buying, markets often trend up
When FIIs are selling, markets can become volatile
When DIIs are buying, they may be supporting the market
Example:
"FII bought ₹2,500 Cr, DII sold ₹500 Cr"
→ Strong bullish sign, smart money is entering
🔄 What Happens When FIIs Sell and DIIs Buy?
FIIs sell during global tension or USD strength (they pull out money)
DIIs buy at dips to average out long-term positions
This creates volatility but also buying opportunities
🧠 Final Thoughts
FII = Foreign money → fast movers, sensitive to global news
DII = Indian money → stable investors, long-term focused
Daily FII/DII data tells us where smart money is flowing
📌 Smart traders always check FII/DII data before taking major trades — especially in Nifty, Bank Nifty, Reliance, Infosys, HDFC twins
PSU & Defence Stock Boom🏢 First, What Are PSU & Defence Stocks?
🔹 PSU Stocks
"PSU" stands for Public Sector Undertaking — companies where the Government of India holds a majority stake (more than 51%).
These companies operate in key sectors like:
Defence manufacturing
Railways
Energy (oil, gas, coal)
Power
Finance
Infrastructure
They have a long history of stability, but until recently, they were seen as slow-moving or inefficient.
🔹 Defence Stocks
These include companies that:
Make defence equipment (fighter jets, missiles, radars, warships)
Work with the Indian Armed Forces or export to global defence clients
Provide electronics, software, and parts for defence systems
In India, many defence companies are also PSUs, such as:
Bharat Electronics (BEL)
Hindustan Aeronautics (HAL)
Bharat Dynamics (BDL)
Mazagon Dock Shipbuilders
Cochin Shipyard
📈 Why Are PSU & Defence Stocks Booming in 2025?
Here are the main drivers behind this massive rally:
✅ 1. Make in India + Atmanirbhar Bharat (Self-Reliance)
The government wants India to become self-reliant in defence production, reducing dependency on imports.
Key points:
Ban on importing 450+ defence items that must now be made locally
Big push to increase defence exports
Support to Indian PSUs to ramp up production
Result: More contracts for Indian defence companies = higher revenues and profits.
✅ 2. Massive Order Books
Many PSU defence companies are sitting on huge order books, sometimes 5–7x their annual revenue.
Examples:
BEL: Order book of ₹65,000+ crore
HAL: Got ₹45,000+ crore order for fighter jets + helicopters
Mazagon Dock: Building submarines and destroyers for Navy
Bharat Dynamics: Orders for missiles, torpedoes
The market loves visibility — and order books give confidence in future earnings.
✅ 3. Government Capex Boom
India’s Union Budget 2025 has focused heavily on:
Defence capex: ₹6 lakh crore+ earmarked for the military
Railways & infrastructure spending
Indigenisation of key technologies
This benefits PSU stocks like:
RVNL, IRCON, RITES (railway infra)
BEL, BDL, HAL (defence manufacturing)
BHEL, Cochin Shipyard (industrial & shipbuilding)
✅ 4. PSU Re-Rating + Efficient Management
For years, PSUs were seen as "government-run, slow, and inefficient."
But things have changed:
Better transparency
Higher dividend payouts
Restructuring of loss-making units
More professional management
Now, investors are re-rating these companies — giving them better valuations than before.
✅ 5. Retail & FII Interest
Retail investors are loving PSU stocks because:
Many trade below ₹100–300 levels (psychologically attractive)
High dividend yields (5–10%)
Visible government support
FIIs are entering because:
Valuations are still reasonable
These sectors have strong growth tailwinds
India is among the top 5 global defence spenders
✅ 6. Global Geopolitics
With rising global tensions (Russia-Ukraine, China-Taiwan), countries are increasing defence spending.
India is emerging as a credible exporter of:
Radars
Drones
Warships
Missiles
This has opened up global demand for Indian defence PSUs.
🧾 Real-World Success Stories
Let’s look at some stocks that delivered multibagger returns recently:
Stock Price (Jan 2023) Price (July 2025) Gain %
Mazagon Dock ₹450 ₹2,400+ 400%+
BEL ₹95 ₹320+ 230%+
HAL ₹1,100 ₹4,300+ 290%+
IRFC ₹25 ₹120+ 380%+
RVNL ₹30 ₹300+ 900%+
This is not just hype. These stocks rallied due to:
Strong earnings
Better efficiency
Clear government push
Long-term order visibility
📊 Technical Outlook (July 2025)
PSU Index (NSE PSU Bank + Infra):
At all-time highs
Weekly RSI: Strong, but near overbought (watch for healthy correction)
Trend: Bullish
Defence Stocks:
Many in stage 2 rally (post-consolidation breakout)
Delivery volumes high = institutional buying
F&O interest rising in BEL, HAL, IRFC
🔍 Best PSU & Defence Stocks to Watch (2025–26)
🚀 Defence PSU Leaders
Stock Why It's Hot
BEL Radar, electronics, missile systems, exports
HAL Fighter jets, helicopters, strong order book
BDL Missile maker, strategic tech player
Mazagon Dock Submarine, destroyers, Navy contracts
Cochin Shipyard Exports + defence orders
🛤️ Railway + Infra PSUs
Stock Why It’s Hot
IRFC Rail project financer, consistent income
RVNL Railway EPC projects, delivery volume spike
IRCON Infra + overseas rail projects
RITES Consultancy + export contracts
🔋 Power & Energy PSUs
Stock Sector Focus
BHEL Power infra, defence components
NTPC Renewable + base power growth
ONGC Oil exploration, dividend stock
🧠 Should You Invest Now?
✅ Pros:
Many PSU stocks still offer value despite big rally
Dividends are attractive (3%–8%)
Government is unlikely to reduce support before 2026 elections
Sector is in a long-term structural uptrend
❌ Risks to Consider:
Valuations may be overheated in some names
Any global peace news may reduce defence urgency
PSU stocks may correct if general market sentiment turns negative
Political uncertainty (pre-election) can cause temporary sell-off
📌 What’s the Strategy for Traders?
📅 Short-Term Traders:
Look for breakouts with high delivery volume
Ride trends on daily/weekly chart
Use trailing stop-loss to lock in profits
Don’t chase upper circuits blindly
🕰️ Swing Traders:
Focus on 3–5 week setups
Use support-resistance, trendlines, 50 EMA entries
Look for consolidation + breakout patterns (e.g. flags, cup-handle)
🪙 What’s the Strategy for Long-Term Investors?
Identify quality PSU stocks with high ROE, low debt, and strong order book
Enter on pullbacks or minor corrections
Hold for 2–5 years horizon
Reinvest dividends to build compounding returns
Don’t fall for “cheap but junk” stocks — quality matters
📚 Final Thoughts
The PSU & Defence Stock Boom of 2025 is driven by real, structural changes, not just hype.
India is becoming a global defence player, and PSU companies are finally being run like businesses — with efficiency, innovation, and profitability.
This rally may pause or cool off in between — but the multi-year story is far from over.
💡 "In a country that wants to defend itself, build itself, and grow itself — PSU & defence are the frontlines."

Swiggy: a probable long trade➡️Entered this with a stop loss of 374
➡️21 ema support
➡️Consumption theme has been picking up and I am hopeful that this scrip would be a beneficiary of the theme
➡️supply zone may act as a demand zone
➡️the volume on negative days have been meagre in comparison to the volume on positive days

SWIGGY |cup & handle breakout **Swiggy Ltd.** based on your latest chart:
> **Swiggy (NSE)** forming cup & handle breakout above ₹389.50 ☕🚀
> Cleared descending channel with authority
> RSI 53.61 → room to run
> Volume 🔥 51.8M = strong conviction
> Next resistances: ₹402.95 / ₹456.70
> Target zone: ₹520–₹570+
> Momentum + structure = tasty trend cooking 🛵📈
> #Swiggy #BreakoutStocks #CupAndHandle #StocksToWatch
Want to add a thumbnail or carousel for this one? I can whip up captions, chart overlays, or even turn this into a visual thread.
Swiggy Base and Trendline BONSE:SWIGGY gains as Morgan Stanley starts coverage with 'overweight' rating; sees 22% upside.
On Daily Chart, it Could Signal a 35% Breakout - Here's the Exact Level Every Trader is Watching
Price Action Analysis:
The chart reveals a classic consolidation phase following Swiggy's IPO debut in November 2024. After an initial surge to highs around 465 levels post-listing, the stock underwent a significant correction, falling to lows near 297 in March 2025. Currently trading at 362.75, the stock shows signs of building a base in the 310-370 range.
Volume Analysis:
Volume patterns indicate institutional interest with notable spikes during key price movements. The stock gained nearly 17% on its trading debut, signalling growing investor confidence in food and grocery delivery firms. The recent volume of 22.31M shares suggests active participation, though lower than peak trading days.
Key Technical Levels:
Support Levels:
- Primary Support: 305-310 (marked by green horizontal line)
- Secondary Support: 297 (March 2025 low)
- Critical Support: 280 (psychological level)
Resistance Levels:
- Immediate Resistance: 370-375 (red horizontal line marking recent highs)
- Major Resistance: 420-430 (post-IPO consolidation zone)
- Ultimate Target: 465 (all-time high)
Base Formation:
The stock has formed a rectangular consolidation base between 310-370 levels over the past 3-4 months. This 4-month base-building phase indicates potential accumulation by institutional investors, typical behaviour post-IPO as initial volatility settles.
Technical Patterns:
A descending trendline resistance (marked in white) from the March highs is being breached. The current price action suggests a potential breakout from this falling wedge pattern, which is typically bullish.
Trade Setup:
Entry Strategy:
- Conservative Entry: 375+ on breakout above resistance with volume confirmation
- Aggressive Entry: 365-368 on current levels for base play
Exit Levels:
- Target 1: 400 (intermediate resistance)
- Target 2: 430 (major resistance zone)
- Target 3: 465 (all-time high retest)
Stop Loss:
- For breakout trade: 355 (below recent consolidation)
- For base play: 305 (below primary support)
Position Sizing and Risk Management:
- Risk per trade: Maximum 2% of portfolio
- Position size calculation: (Portfolio value × 2%) ÷ (Entry price - Stop loss)
- For a 100,000 portfolio: (100,000 × 2%) ÷ (365 - 305) = 33 shares maximum
- Reward-to-risk ratio: 1:2.5 minimum
Sectoral and Fundamental Backdrop:
NSE:SWIGGY food delivery business achieved profitability in March, with a current market cap of 83,088 crores and revenue of 15,227 crores. However, the company still reports losses of 3,117 crores, indicating it's in a growth investment phase.
The IPO was priced at ₹390 per share, raising ₹11,327.43 crores, providing substantial capital for expansion. The company operates a hyperlocal on-demand delivery model, connecting nearby restaurants and service providers to customers, with diversification into grocery delivery (Instamart) and logistics services.
The food-tech sector in India remains attractive due to increasing digitization and changing consumer behaviour. Recent antitrust concerns regarding discount practices by fast-delivery companies, including Swiggy, indicate regulatory scrutiny, which could impact future growth strategies.
Risk Factors:
- High cash burn rate despite revenue growth
- Intense competition with Zomato, Zepto and other players
- Regulatory challenges in the quick commerce space
- Market volatility affecting new-age tech stocks
My Take:
The technical setup suggests accumulation phase completion with potential for a significant move higher, supported by improving fundamentals in the core food delivery business, achieving profitability. Follow the Strict Trade Plan as Explained Above.
Keep in the Watchlist.
NO RECO. For Buy/Sell.
📌Thank you for exploring my idea! I hope you found it valuable.
🙏FOLLOW for more
👍BOOST if you found it useful.
✍️COMMENT below with your views.
Meanwhile, check out my other stock ideas on the right side until this trade is activated. I would love your feedback.
Disclaimer: "I am not a SEBI REGISTERED RESEARCH ANALYST AND INVESTMENT ADVISER."
This analysis is intended solely for informational and educational purposes and should not be interpreted as financial advice. It is advisable to consult a qualified financial advisor or conduct thorough research before making investment decisions.
"Swiggy Karo, Phir Jo Chahe Karo!"Swiggy CMP 385
Swiggy Ltd
About
Founded in 2014, Swiggy Ltd is a new-age, consumer-first technology company offering users an easy-to-use convenience platform, accessible through a unified app.
Key Points
Business Model - Swiggy operates a diversified hyperlocal commerce platform through its unified app - ''SWIGGY'' The company, known for pioneering hyperlocal commerce in India, offers a range of services through five main segments:
Food Delivery - Launched in 2014, this core segment enables users to browse, order, and have meals delivered from a wide network of restaurant partners. Swiggy monetizes this by charging fees from restaurants, delivery charges, and platform-based advertising opportunities.
Gross Order Value: Food Delivery GOV reached ₹247,174.41 million in fiscal 2024.
Average Order Value Rs.408 in FY24
Delivery Fee collected as a % of GOV : 3.11%
Cost of Delivery as a % GOV: 14.31%
Out-of-Home Consumption Includes services for dining and events, such as Dineout (for restaurant reservations and promotions) and SteppinOut (events management). Swiggy leverages its established restaurant partnerships to extend user engagement beyond home deliveries.
Quick Commerce Instamart, launched in 2020, offers fast delivery of groceries and household items, leveraging a network of “dark stores” to achieve rapid delivery times. This segment is expanding with new product categories and cities.
This is just to boost my confidence. No Suggestions for buying. I will keep checking and updating my mistake if last post gone wrong...
Disclosure: I am not SEBI registered. The information provided here is for educational purposes only. I will not be responsible for any of your profit/loss with these suggestions. Consult your financial Adviser before making any decisions.
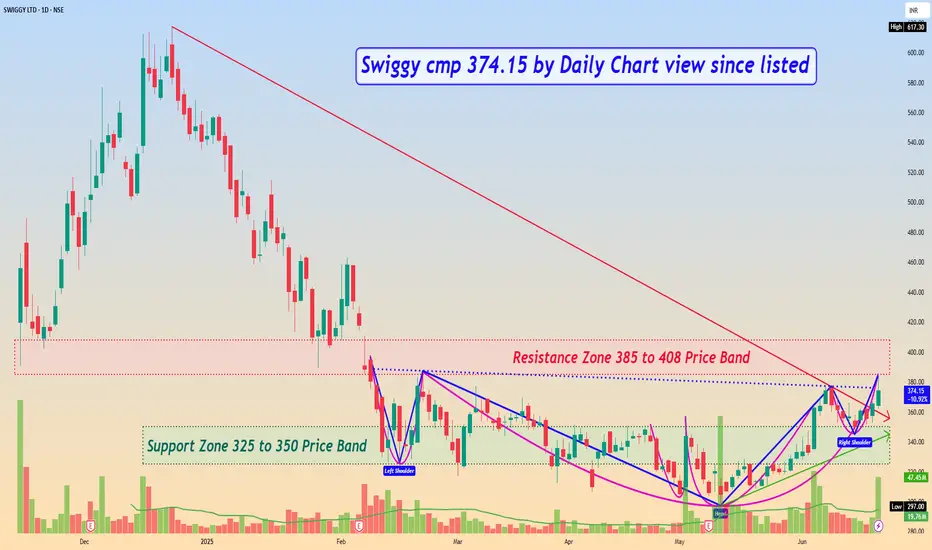
Swiggy cmp 374.15 by Daily Chart view since listed**Swiggy cmp 374.15 by Daily Chart view since listed*
- Support Zone 325 to 350 Price Band
- Resistance Zone 385 to 408 Price Band
- Rising Support Trendline seems been well respected
- Falling Resistance Trendline Breakout seems sustained
- *Multiple Bullish Rounding Bottoms plus considerate Head & Shoulders below Resistance Zone*
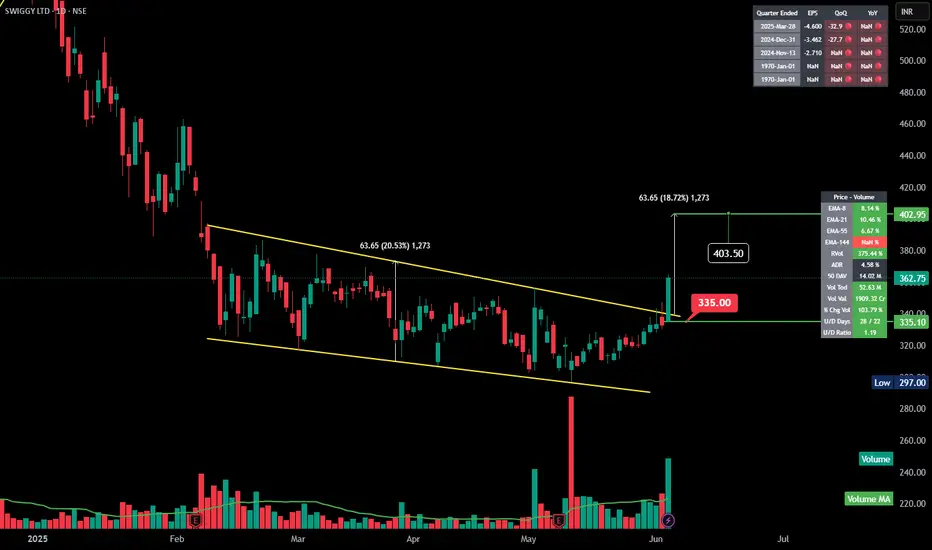
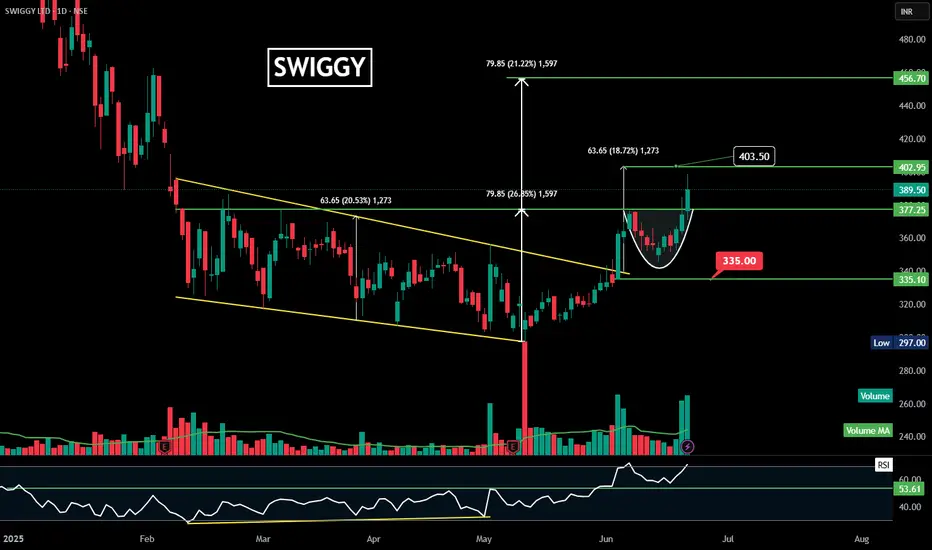
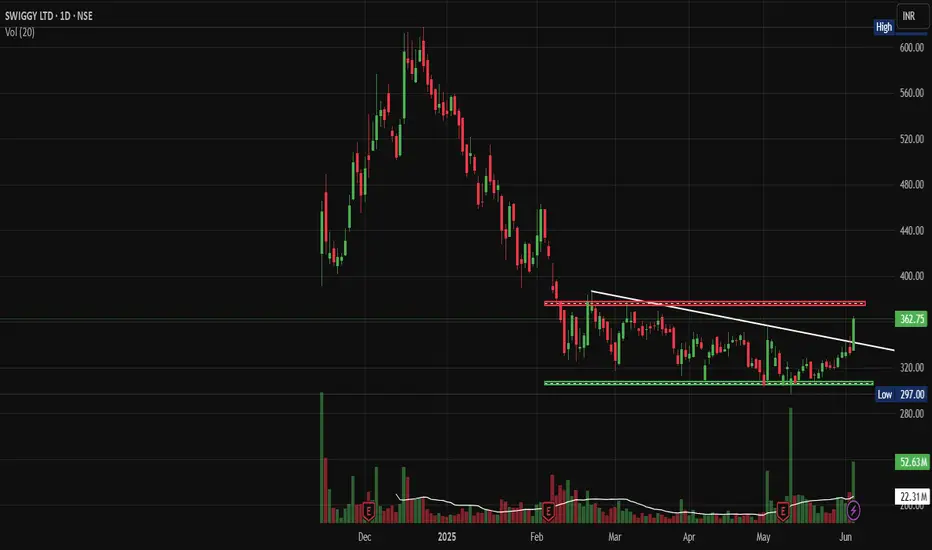
SWIGGY | Falling Channel Breakout | Good VolumeBased on the images you've uploaded, here's a detailed analysis and summary of the SWIGGY LTD chart:
---
### **Chart Pattern and Technical Overview:**
* **Falling Channel:**
The price action was contained in a downward-sloping channel, marked by two yellow trendlines (upper and lower boundaries).
This pattern reflects a period of consolidation within a larger downtrend.
* **Breakout:**
Recently, the price has broken out of this descending channel, closing above the upper trendline around the 335.00 level.
Such a breakout is typically considered bullish, suggesting a potential trend reversal or at least a short-term move to the upside.
* **Volume Confirmation:**
A significant increase in volume accompanied the breakout, confirming the strength of this move.
High volume breakouts generally have a higher probability of sustaining.
* **Price Targets & Measurements:**
* The breakout target is projected based on the height of the channel (approx. 63.65 points).
* Measured breakout target:
$\text{Breakout level (335.00)} + \text{Channel height (63.65)} = 403.50$.
* Current price: 362.75.
* Immediate resistance zone near 403.50.
---
* **Volume:**
* Today’s volume (52.63M) is above the 50-day average (14.02M).
* This indicates strong interest and participation by traders.
---
### **Key Levels:**
✅ Support: **335.00**
✅ Resistance: **403.50**
✅ Low: **297.00**
---
### **Conclusion & Implication:**
The breakout from the falling channel with strong volume suggests a potential bullish continuation towards 403.50, as long as 335.00 holds as support. Watch for further volume spikes and price action near the target zone to determine sustainability.
---