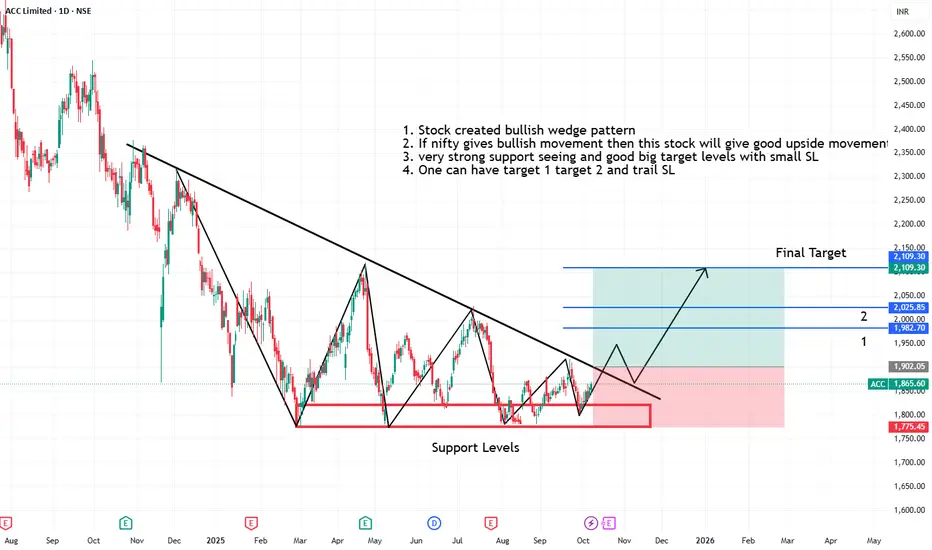
Acc creating bullish wedge pattern on strong support levels1. Stock created bullish wedge pattern
2. If nifty gives bullish movement then this stock will give good upside movements
3. very strong support seeing and good big target levels with small SL
4. One can have target 1 target 2 and trail SL
Swing
Redington swing trade and upcoming result Redington swing trade and upcoming result target 280,next target 300,T3-330rs,

Suzlon Energy Ltd – EMA Crossover & Volume Confirmation (Daily CSuzlon Energy has shown a bullish EMA crossover on the daily chart, supported by a strong volume burst, signaling renewed buying interest after a corrective phase. The price has reclaimed the baseline resistance zone (₹59–₹61), and a sustained move above it could open the path toward the next major resistance near ₹68.
This setup suggests a potential trend reversal with strong momentum confirmation.
🎯 Key Levels:
CMP: ₹59.99 (+1.27%)
Baseline Resistance: ₹59 – ₹61
Target Zone: ₹67 – ₹69
Support Zone: ₹54 – ₹55
Stop-Loss: ₹53 (on daily close basis)
📊 Technical View:
20 EMA has crossed above 50 EMA, indicating a bullish trend shift.
Volume spike during the crossover adds strength to the move.
Price breakout from consolidation confirms accumulation.
Sustaining above the baseline could trigger a continuation rally toward ₹68+.
🧠 View:
Suzlon Energy is showing early signs of trend reversal after weeks of consolidation. A close above ₹61 with sustained volume can extend momentum toward ₹68, while ₹54 acts as key support.

Pn gadgil Technical -
Strong absorption after huge selling,
Break above where selling started.
Risk -7/8%
Target -16/20% after trailing with 20/30emas
Fundamentals -
Company Maharashtra based jewellery retailer growing at 25-30%.
Company is starting PAN India expansion this quarter by opening FOCO stores in UP and MP.
They are guiding for 20-23 stores for this year along with PAT margins from 3.5-4%.
This stock trending due to it quarterly results on social media

Intraday Trading vs Swing TradingIntroduction
Brief overview of trading in financial markets.
Importance of choosing the right trading style for profitability and risk management.
Statement of purpose: Compare intraday trading and swing trading across multiple dimensions such as time horizon, risk, capital requirements, strategy, and psychology.
1. Understanding Intraday Trading
1.1 Definition
Buying and selling financial instruments within the same trading day.
Positions are squared off before the market closes.
1.2 Characteristics
Short-term focus (minutes to hours).
High trade frequency.
Requires constant market monitoring.
1.3 Tools & Techniques
Technical indicators: RSI, MACD, moving averages, Bollinger Bands.
Chart patterns: Flags, triangles, head & shoulders.
Level 2 data, real-time market depth.
1.4 Advantages
Potential for high profits in a single day.
No overnight risk exposure.
Quick capital turnover.
1.5 Disadvantages
High stress due to rapid decision-making.
Significant brokerage and transaction costs.
Requires advanced knowledge and quick reflexes.
2. Understanding Swing Trading
2.1 Definition
Holding positions for several days to weeks to capture medium-term price movements.
2.2 Characteristics
Medium-term focus.
Fewer trades but larger profit potential per trade.
Less time-intensive compared to intraday trading.
2.3 Tools & Techniques
Technical analysis: Trendlines, support/resistance, moving averages.
Fundamental analysis: Earnings reports, sector trends, macroeconomic indicators.
Swing patterns: Breakouts, pullbacks, reversals.
2.4 Advantages
Less stressful than intraday trading.
More time to analyze and make informed decisions.
Lower transaction costs due to fewer trades.
2.5 Disadvantages
Exposure to overnight and weekend risks.
Capital is tied up longer.
Requires patience and disciplined risk management.
3. Time Horizon and Trading Frequency
Intraday: Trades last minutes to hours; multiple trades daily.
Swing: Trades last days to weeks; limited trades but larger exposure.
Impact on lifestyle: Intraday requires active screen time; swing allows more flexibility.
4. Capital Requirements
Intraday: Leverage is often used; margin requirements are smaller but risk is higher.
Swing: Requires more capital per trade due to longer holding periods and lower leverage.
Risk of capital erosion: Intraday mistakes can wipe out a day’s gains; swing mistakes can impact several days of profit potential.
5. Risk and Reward Dynamics
Intraday: High volatility can yield high rewards but also steep losses.
Swing: Moderate volatility, potential for larger cumulative gains, but exposure to overnight gaps.
Risk management strategies: Stop-loss orders, position sizing, diversification.
6. Trading Psychology
Intraday:
Requires quick decision-making and mental resilience.
Emotional discipline is crucial; fear and greed can destroy profits quickly.
Swing:
Patience is essential to ride trends.
Ability to handle temporary drawdowns without panic-selling.
7. Strategy and Analysis
Intraday Trading Strategies:
Scalping: Quick small gains.
Momentum trading: Riding strong price trends within the day.
Swing Trading Strategies:
Trend-following: Entering trades along prevailing trends.
Reversal trading: Buying dips and selling rallies.
Technical vs fundamental analysis balance: Swing trading often incorporates both; intraday is heavily technical.
8. Costs and Tax Implications
Intraday:
Higher brokerage and STT due to frequent trades.
Short-term gains taxed differently depending on jurisdiction.
Swing:
Lower trading costs.
Gains may qualify for medium/long-term capital gains benefits.
9. Suitability for Different Traders
Intraday: Best for active, risk-tolerant, experienced traders with fast decision-making skills.
Swing: Suitable for part-time traders, working professionals, and those seeking less stressful trading.
10. Technology and Tools
Intraday: Real-time charts, high-speed internet, advanced trading platforms.
Swing: Standard charting tools, technical analysis software, news alerts.
Algorithmic trading: Both can benefit but intraday relies more heavily on automated systems.
11. Performance Metrics
Intraday:
Profit per trade is smaller but cumulative daily gains can be significant.
Key metrics: Win rate, risk-reward ratio, drawdown percentage.
Swing:
Profit per trade larger due to capturing trends.
Key metrics: Holding period returns, average gain/loss, volatility capture.
12. Case Studies
Example of successful intraday trades: High-volume stocks, news-based spikes.
Example of successful swing trades: Trend-following in indices or sectoral stocks.
Comparison of returns, drawdowns, and effort required.
13. Hybrid Approaches
Combining intraday scalping with swing trading to diversify income streams.
Portfolio allocation between short-term and medium-term trades.
Pros and cons of hybrid trading.
14. Choosing Your Style
Assess your risk tolerance, time availability, capital, and psychological comfort.
Test both styles using paper trading before committing real capital.
Flexibility and adaptation to changing market conditions.
15. Conclusion
Recap of key differences: time horizon, risk, rewards, strategies, tools.
Emphasis on personal suitability over “best style.”
Encouragement to practice disciplined trading, regardless of style.

Shalimar paint Today stock given break correction start candle break out
,
Mostly after big volume 80/90% consolidation or mostly fall
But here after selling pressure absorption happens look like.
Delivery % 18-19 Sept (24% & 30%)
30 sept delivery % 51.9%
Looklike earning buying after results post price showing reaction

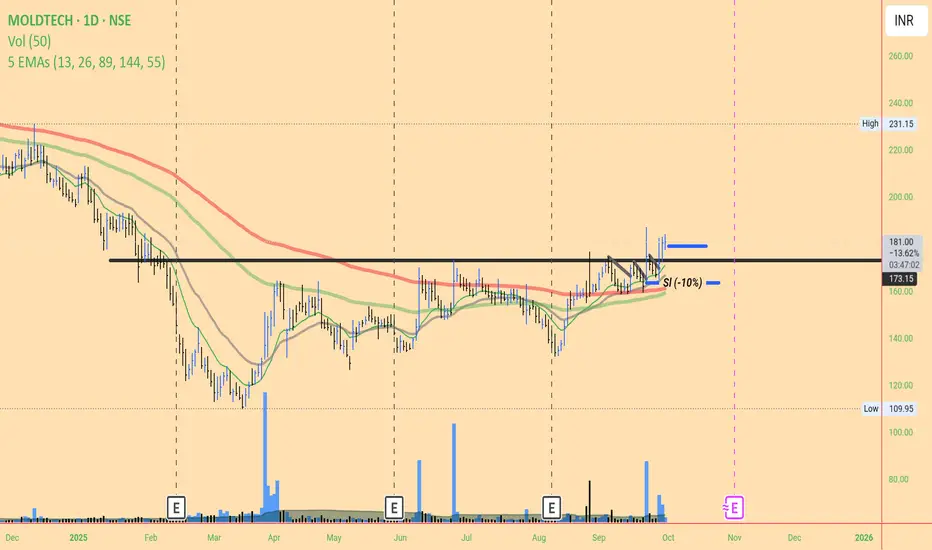
Mold-Tech #technicalanalysis
pattern look like vcp from left to right move price became narrow.
High volume after absorption ,
* Now price break 1st correction candle above trade. Entry point
* Sl -10% , from entry point 179 current price,
Reason below high volume after selling zone absorption area below that.
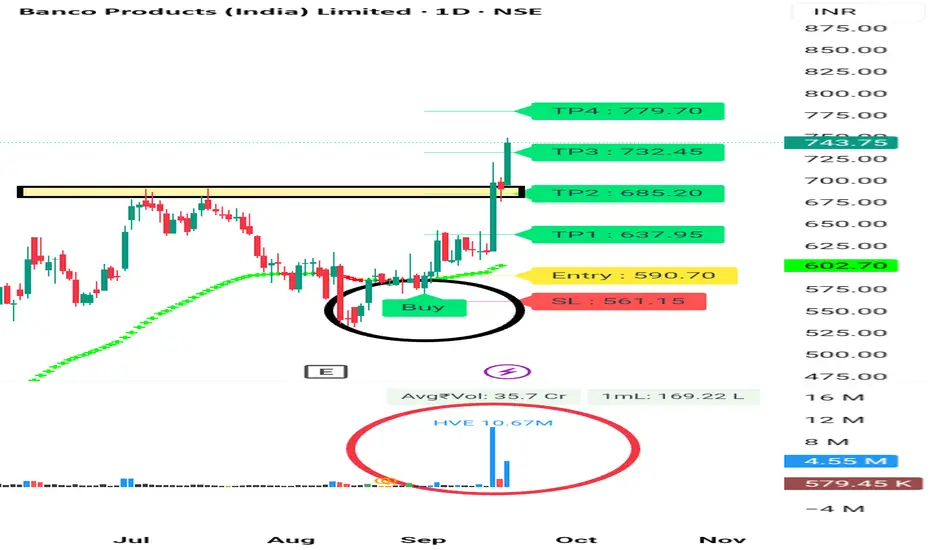
Breakout Stock For Swing Trading Banco india is a very good stock in his secret. It's given breakout with high volume.
It's looking good for Swing trading tgt 5 -8%
SL 5% . then Trail SL.
It's given good breakout.
You can Visit my Tradingview Profile for more information.
Consult your financial advisor before making any position in stock market.
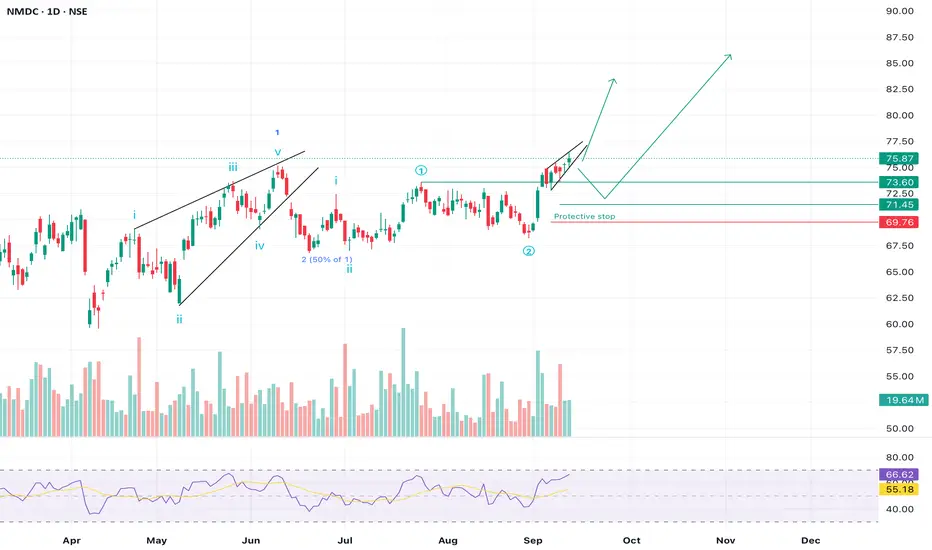
NMDC setting the stage for RALLYNMDC looks to be setting up for a potential impulsive rally after completing a corrective wave. The structure suggests strength, with protective levels clearly defined.
🧩 Elliott Wave Structure
• We can see a completed 5-wave move up earlier this year (Wave 1).
• That was followed by a healthy correction (Wave 2), which retraced close to 50% of Wave 1 — a textbook retracement zone.
• Now, price action is forming a new Wave 3 setup, which tends to be the strongest move in Elliott Wave cycles.
📈 Key Levels to Watch
• Current Price: ₹75.87
• Immediate Support: ₹73.60 – ₹73.37 zone
• Protective Stop: ₹71.45 (below recent swing low, Wave 2 invalidation area)
• Upside Path: If price sustains above ₹76, we may see a quick move towards ₹80–82 first, and eventually ₹85+ in the coming weeks.
🔍 Technical Indicators
✅ RSI is rising and trading around 66, showing bullish momentum but still shy of overbought levels.
✅ Moving averages are sloping upward, supporting the bullish bias.
✅ Volume spikes on green candles indicate strong participation from buyers.
📊 Possible Scenarios
1. Bullish Continuation: A breakout above ₹76 could trigger momentum buying, leading to higher targets quickly.
2. Pullback Before Rally: Price may retest the ₹73–74 zone before resuming the uptrend — a healthy retest would make the rally stronger.
Protective stop is marked near ₹71.45. If price falls below this, it may indicate that the wave structure has failed, and deeper correction could follow.
⸻
Disclaimer:
This analysis is for educational purposes only and not investment advice. Please consult a SEBI-registered financial advisor before making any trading or investing decisions.
Muthoot finance uptrend stocks Muthoot finance id good In this Sector. That's good fundamentals company'. It's in uptrend in 45Min chart . It's taking support at every fall. It's going up with ema.
We can take Position with SL. U can easily book 3 -5% in this stock .keep SL of 3 -5%. Means 1 :1 R :R. THEN trial SL .

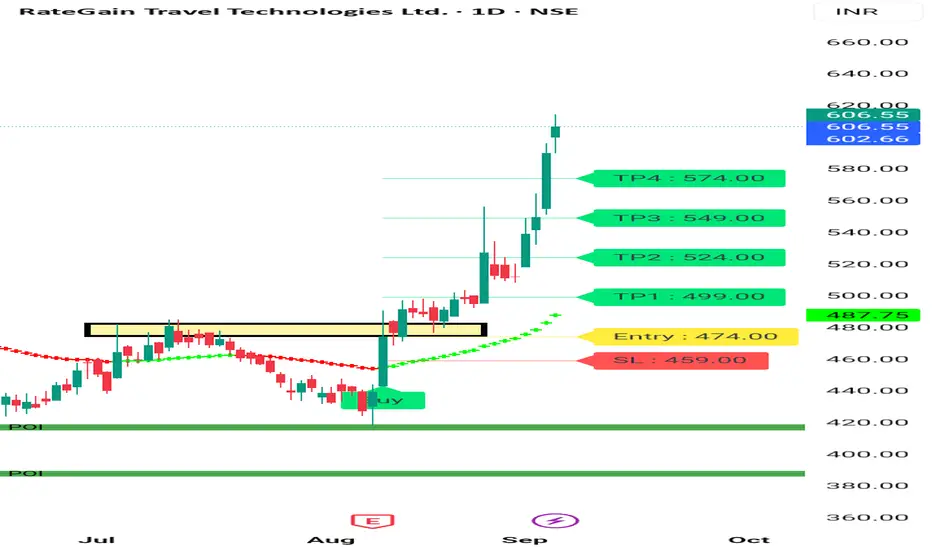
RATE Gain Bullish Structure Rate Gain is Given Good Breakout Above 485 From 485 it's moved to 600 . It's All Time High is 897 . It's given Weekly Breakout also . Ist Daily Rsi above 80 , it has to take Retracement Before Further Movement. It may move to 800 Levels in next 3 -6 months . Wait for Good Risk Reward. At Current price not good entry .who have already they can Trial SL .
For more information Watch my Profile . Always Trade with SL. No trade without Stoploss.
Consult your financial advisor before making any position in stock market.
Bajaj Finance - Seems to be on SupportCMP 853 on 12.08.25
In the last 15-20 days, the stock price has come down to 853 from 970. Present level may act as support again, as can be seen on the chart.
If it bounces back, it will form a Double bottom pattern.
Stochastic RSI is showing a reversal sign too.
Targets may be 885/915+.
If it sustains below 840-835 levels, the setup will go weak.
The risk-reward ratio is good at this point.
This illustration is for educational and sharing purposes; this should not be taken as a buying or selling recommendation.
All the best.

VEDANTA Swing Trade with 1:3 RR (Long)Sellers failed to take price below the demand zone and a clear Change of Character (market structure shift) happened that shows buyers have taken control of the price of Vedanta.
So if Nifty and Metal sector are not bearish in coming sessions, then it is high probability that Vedanta will touch Rs 475.
Don't use hard SL. Manage position sizing as it is a high probability setup.
Connect with me if you have any questions. I am happy to help.
ChoCh - Change of Character
Sw or Sweep - Liquidity Sweep
BoS - Break of Structure

RALLIS - Ready for Momentum BurstNSE:RALLIS
Technical Analysis
⦿ Its moving in a good uptrend with stair pattern in a Wide channel.
⦿ On 15th of July company posted good results but since than - the stock is just consolidating now its been 1 month, Now it will be time to capitalize on that good earning.
⦿ The current base is clean and a static resistance is formed @386
⦿ Price is Approaching for 3rd time and from last 3 days upmove volume has surged.
⦿ Planning a trade above resistance and keeping a simple 2% stoploss to capture 10% Move.
🟢Entry - 386
♦️Stop - 375
🎯Tgt - 400,425+
The above information is for educational purposes only.
Before acting on any investment idea please do your own analysis and follow proper risk-to-reward, position sizing rules
⦿ If you found this idea Useful, please like and comment 👍💬
Keep Learning,
Happy Trading 🤞**

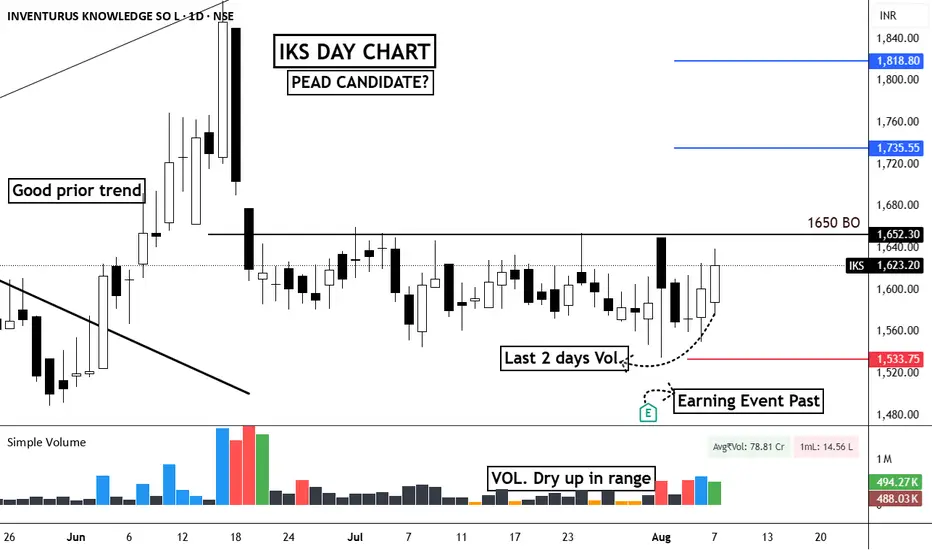
PEAD in Inventurus Knowledge (IKS)EQUITY SWING SETUP 📊
#IKS | Daily Chart Analysis
🔹Structure:-
Price is forming a rounded bottom inside a range, showing Volume Dry-Up during the consolidation phase.
Earnings event is past, reducing uncertainty, and the last two days show pickup in volume, hinting at accumulation.
Key breakout level is ₹1650, above which momentum can accelerate — possible PEAD (Post-Earnings Announcement Drift) candidate.
🟢ENTRY:
Buy above ₹1655 with strong volume confirmation.
♦️RISK:-
Stop Loss: ₹1533 (below recent swing low & support zone)
🎯TARGETS:-
1st Target: ₹1735
2nd Target: ₹1818
📌Detailed Analysis:
Volume dried up significantly during the range, a classic sign of weak hands exiting.
The base is tight, indicating strong hands holding.
Breakout above ₹1650 could trigger a quick momentum burst, especially given the post-earnings context.
Watch for strong volume on breakout day to confirm institutional participation.
📈Mark the levels on your chart and track price behavior near the breakout zone.
APTUS Swing Trade (20% upside)Simple swing trade setup based on institutional buying footprint.
No indicators, no silly chart patterns.
Pure buyer/seller psychology and trend based setup.
Risk Management for setups like these:
This is a high probability setup. The only thing to take care of is the position sizing in case the overall market ( Nifty ) is bearish for some weeks. Decrease position and increase SL size to maintain your Risk. Have patience.
Message me for more such setups and learning insights and to know how to find such setups and properly ride the complete trend fors trades like these.
Risk Reward for these setups are very good so you have to manage the risk before the next up-trend move kicks in. Part of the game.
Any question or want to have any convo over stock market ? Do message. Happy to help and connect with fellow traders.
Thanks.
Gaurav

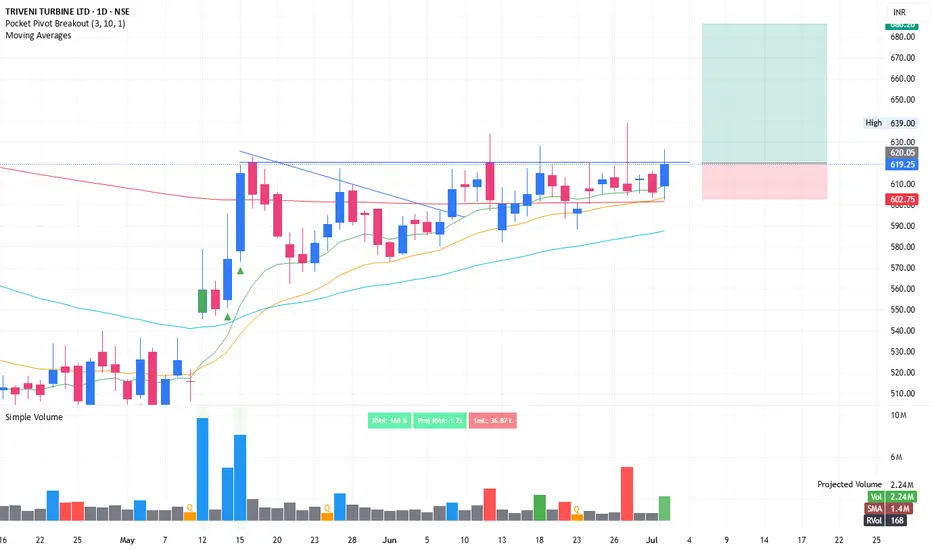
Range break, 1:3 Risk reward, Expecting 10% move in few daysTRITURBINE: Again coming up with swing trade idea. tight consolidation in range of 3% within last 5-6 days. Price is hovering around 10 and 20 EMA. Rejection on 27th Jun shows weak hands going away. Breaking above the pivot line could lead to significant push when crossing with good volume.
SL is somewhere around 3% (Refer the long position drawn over the chart).
One can invest 10% portfolio size as per following calculations
Position sizing and managing risk is the key.
Portfolio is: 1,00,000
Position size: 10,000
Risk 3%: 300. Which means only 0.3% of overall portfolio value is under risk.
Stay connected for commentary for coming days
Disclaimer:
The information provided herein is for educational and informational purposes only and should not be construed as investment advice. The stock analysis and recommendations are based on publicly available information, data sources believed to be reliable, and our interpretation at the time of writing.
Investing in equities involves risks, including the risk of loss of capital. Past performance is not indicative of future results. Readers and investors are advised to conduct their own research or consult a qualified financial advisor before making any investment decisions.
The author(s), affiliates, or associated entities may hold positions in the stocks mentioned, and such positions are subject to change without notice.
We do not guarantee the accuracy, completeness, or timeliness of any information presented, and we disclaim any liability for financial losses or damages resulting from the use of this content.
HCLTECHBased on my analysis for long Only for education purpose only not for any buying or selling recommendations.

TATACONSUMHi guys, In this chart i Found a Demand Zone in TATACONSUM for Long Term, Observed these Levels based on price action and Demand & Supply. WW. Don't Take any trades based on this Picture
...because this chart is for educational purpose only not for Buy or Sell Recommendation..
Thank Q

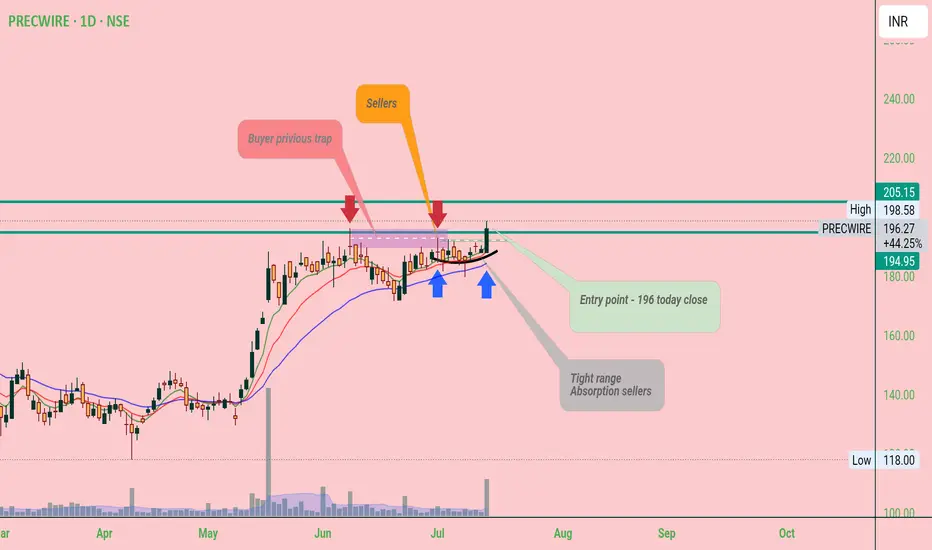
Precwire Price trading at near resistance area if close above 205₹
Good move up side posible
Pattern look like cup & handle
Put your sl below handle below risk max 10% around
HeranbaSwing Trade -
Look interesting at current level - still closing pending
If today close above break out level
Maybe we can see Good move upside.
Risk around 8-10% around
Target next resistance


Swing trading opportunity with good risk : reward in GOKULAGROAgain coming up with swing trade idea. tight consolidation in range of 2-4% within last 5-6 days. Price is hovering around short term EMA. Looks like weak hands are exiting. Breaking above the pivot line could lead to significant push when crossing with good volume.
SL is somewhere around 3% (Refer the long position drawn over the chart).
One can invest 10% portfolio size as per following calculations
Position sizing and managing risk is the key.
Portfolio is: 1,00,000
Position size: 10,000
Risk 3%: 300. Which means only 0.3% of overall portfolio value is under risk.
Stay connected for commentary for coming days.
Disclaimer:
The information provided herein is for educational and informational purposes only and should not be construed as investment advice. The stock analysis and recommendations are based on publicly available information, data sources believed to be reliable, and our interpretation at the time of writing.
Investing in equities involves risks, including the risk of loss of capital. Past performance is not indicative of future results. Readers and investors are advised to conduct their own research or consult a qualified financial advisor before making any investment decisions.
The author(s), affiliates, or associated entities may hold positions in the stocks mentioned, and such positions are subject to change without notice.
We do not guarantee the accuracy, completeness, or timeliness of any information presented, and we disclaim any liability for financial losses or damages resulting from the use of this content.
