SRF LTD: Price Compression at Key Resistance|Clean Breakout Play📌 Structure: Daily Timeframe
SRF has been consolidating inside a clean descending channel, printing lower highs while demand holds near the channel base.
Price is now pressing against well-tested channel resistance — a clear decision zone.
🔴 Key Reads
Descending resistance respected multiple times
Tight price compression near supply → volatility contraction
Buying interest visible near demand
Muted volume during consolidation → pre-expansion behaviour
This is structure-led, not momentum-driven.
🟢 Breakout Rules (Strict)
Trade triggers only if:
Strong green Marubozu / near-Marubozu
Daily close above descending resistance
Clear volume expansion
No close above resistance = no trade.
🎯 Trade Plan
Entry: Breakout close
SL: Low of breakout candle
Target 1: ₹3300, then trail
Management: Trail via higher lows / structure
Defined risk. Reward from range expansion, not prediction.
🧠 Why It Works
- Long consolidation builds energy
- Repeated rejections weaken supply
- Channel breakouts often expand fast
Clean price + volume = institutional participation
⚠️ Invalidation
Weak breakout
Low volume
Rejection wick with close back inside channel
→ No trade
📊 Final Word
SRF is coiled, not weak.
Patience first. Execution only on confirmation.
➡️ Let price prove strength. 👍 Appreciate if this helps.
⚠️ Disclaimer
This is a technical study for educational purposes only, based purely on price action and volume.
Not financial advice. Please manage risk as per your own trading plan.
🔔 Follow
If you like clean, no-indicator, price–volume based setups,👉 Follow for more structure-led trade ideas and chart studies.
💬 Your Turn
Have a stock you want analysed using pure price action & volume?
Drop the name in the comments — I’ll pick a few and share clean charts.
Swingtrade

Buy APL Apollo TubesShort Term Trading Advice by Goodluck Capital
Buy APL Apollo Tubes
● Buy Range- 1940 - 1960
● Target- 2060 - 2080
● StopLoss- below 1890
● Upside Potential- 6% -7%
● Approx trade duration 12 - 14 days

Buy Multi Commodity Exchange of IndiaShort Term Trading Advice by Goodluck Capital
Buy Multi Commodity Exchange of India
● Buy Range- 10475 - 10575
● Target- 11000 - 11200
● StopLoss- below 10180
● Upside Potential- 5% -6%
● Approx trade duration 12 - 14 days

PEL : Golden Retracement • Demand Reaction • Risk-Defined Trade📊 PRIMAL ENTERPRISES | 2H STRUCTURE-BASED SWING SETUP
Golden Retracement | Demand Reaction | Risk-Defined Trade
📌 Chart Context & Market Structure
Price has completed a strong impulsive decline from the prior swing high and is now reacting from the Golden Retracement Zone (Fib 50%–78%), which historically acts as a decision area between trend continuation and deeper correction.
This zone also overlaps with a higher timeframe demand pocket, increasing its technical significance.
Key observations from the chart:
Strong bearish impulse followed by slowing downside momentum
Price testing Fib 50%–78% retracement → value re-assessment zone
Clear invalidation level marked via hourly close below demand
🔍 Why This Zone Matters (Educational Insight)
📌 The golden retracement zone represents an area where:
Smart money evaluates whether the prior trend is still valid
Late sellers get absorbed by institutional demand
Failed demand here often leads to accelerated downside due to liquidity vacuum
If buyers defend this zone, price usually transitions into a corrective → impulsive recovery.
If demand fails, price seeks the next high-liquidity support below.
📈 Bullish Projection (Primary Scenario)
If price:
Holds above the golden retracement zone
Forms higher lows on lower timeframes
Shows acceptance above the immediate resistance
➡️ Expect a structural recovery phase.
Upside Path (Projection):
Near-term resistance breakout → momentum pickup
Sustained move above 1,237 confirms strength
Swing expansion toward 1,274 – 1,289 zone
This aligns with a mean-reversion + trend resumption structure.
📉 Bearish Risk Scenario (If Demand Fails)
If price:
Fails to attract buying interest within Fib 50%–78%
Breaks demand with an hourly close below 1,082
📌 It signals demand exhaustion and breakdown of value perception, increasing the probability of a deeper corrective leg toward the next higher-timeframe demand zone below.
This is why risk is clearly defined, not assumed.
🎯 Trade Strategy (Educational, Not Advisory)
Bullish Swing Strategy:
Entry: Demand hold + bullish structure confirmation
Stop Loss: Hourly close below 1,082
Targets: Partial near resistance → Swing target 1,274 – 1,289
Risk Management Logic:
Trade is invalid if demand fails — no hope-based holding
Position sizing based on SL distance
Patience required; no chasing breakouts
🧠 Key Learning Takeaway
📌 When price reacts at the golden retracement:
Acceptance = trend continuation
Rejection = deeper correction
The goal is not prediction — it is preparing for both outcomes with clarity and discipline.
🧾 Conclusion
This setup offers:
Clear structure
Defined risk
Favorable risk-reward if demand holds
Let price confirm. Let structure guide. Let risk stay controlled.
⚠️ Disclaimer
I am not a SEBI-registered analyst. This analysis is for educational purposes only. Please conduct your own analysis or consult a qualified financial advisor before taking any trades.

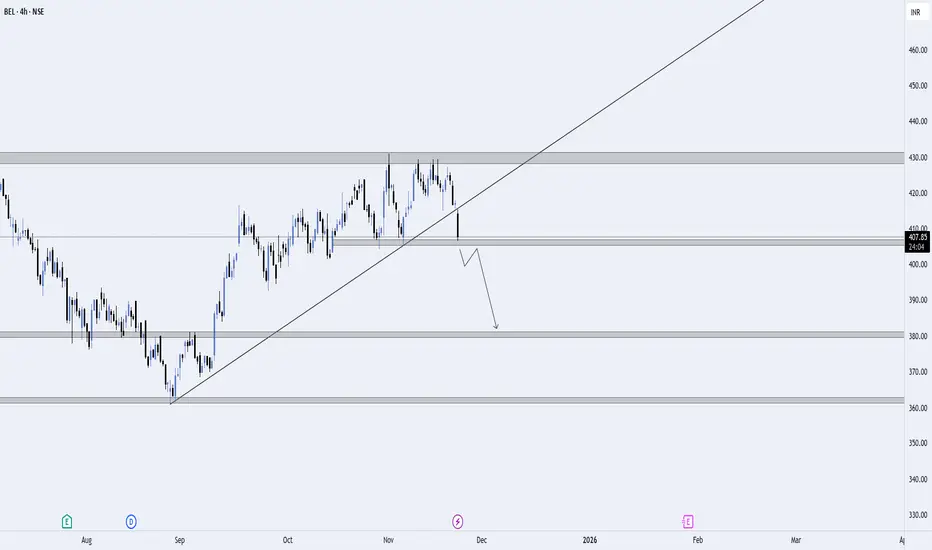
BEL – Trendline Breakdown & Supply Zone Rejection | Bearish SetuBEL has rejected strongly from the higher-timeframe supply zone around ₹425–₹430, followed by a clean trendline breakdown. This breakdown signals weakening bullish momentum and opens the door for a deeper correction.
📌 Key Highlights
Strong rejection from the major supply zone.
Clear trendline break, indicating a shift in structure.
Price currently hovering near ₹408–₹410 support.
Expecting a pullback before continuation.
🎯 Entry Plan (Breakdown + Retest)
🔽 Preferred Entry Model
1. Breakdown:
Price breaks below the minor structure at ₹406–₹408 with a strong bearish candle.
2. Retest:
Wait for price to pull back toward ₹408–₹410 (previous support → now resistance) OR a retest of the broken trendline.
3. Entry Trigger:
Enter short only after a bearish rejection (wick rejections / bearish engulfing / breakdown of retest low).
📍 Ideal Entry Zone:
₹400 – ₹403
🎯 Targets
TP1: ₹395
TP2: ₹382
Final Target (HTF Demand): ₹360 – ₹365
❌ Invalidation
Setup invalid if BEL reclaims ₹425 and sustains above the supply zone.
📈 Bias
Bearish as long as the price stays below the breakdown zone and the trendline.
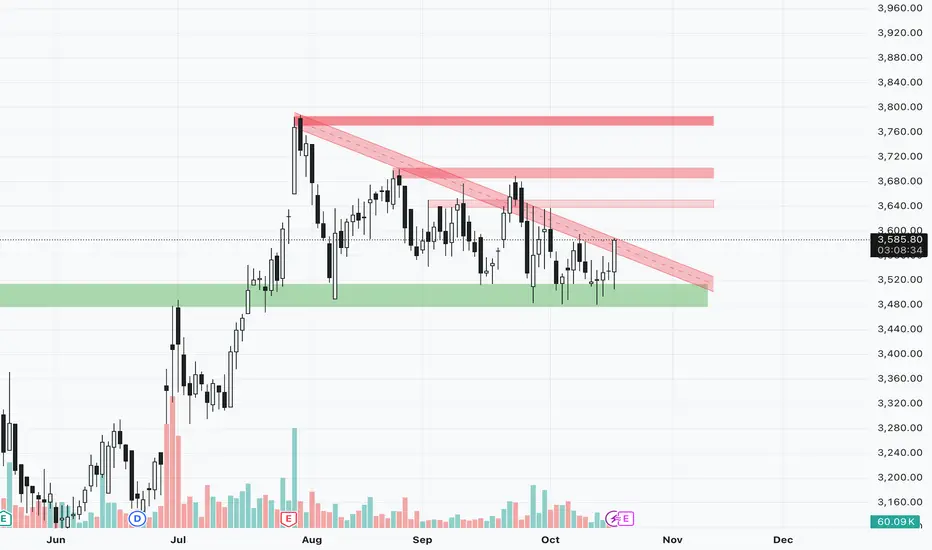
TCS – Supply Zone + Channel Resistance | Short Idea (4H)Price has reached a major supply zone aligned with the upper channel resistance, creating a high-probability rejection zone.
The confluence of:
Horizontal resistance
Supply zone
Rising channel top
makes this area a strong rejection point.
🔵 Reason for Short Setup
Price is reacting at a previous rejection zone
Clear bearish wick activity near resistance
Channel structure shows exhaustion at the top
Risk:Reward remains favorable
🎯 Trade Plan
Entry: Around current rejection zone
Stop-Loss: Above supply zone + channel breakout
Target 1: Mid-channel
Target 2: Lower channel support
🔍 Market Structure
4H trend is still forming higher lows, but momentum weakens at resistance
If price closes above the blue zone, setup becomes invalid
Watching for confirmation candle (bearish engulfing / rejection wick)
⚠️ Invalidation
A strong 4H close above the blue resistance breaks the idea.
💬 Note
This is a pure price-action confluence setup. Will update once price reaches mid-channel target or shows breakdown signals.

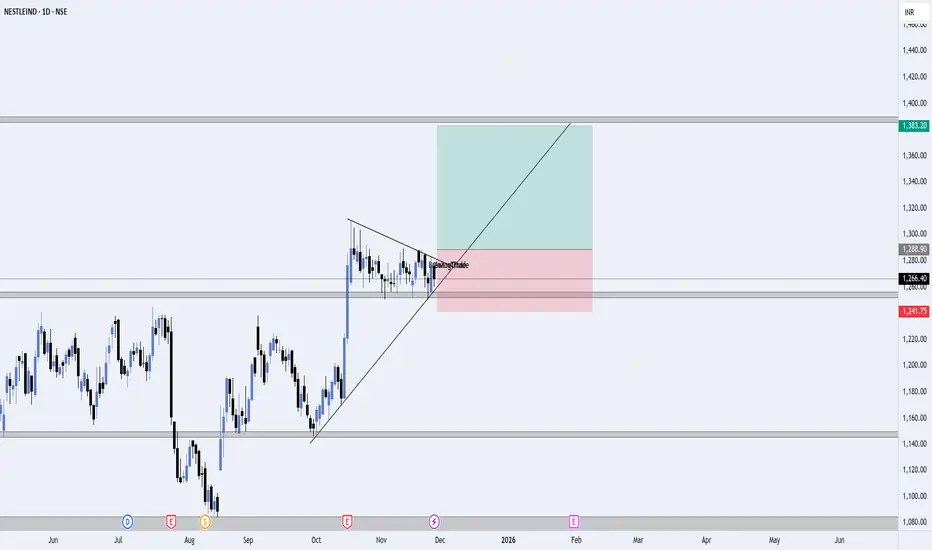
NESTLEIND – Symmetrical Triangle Breakout Setup (1D Chart)I’m watching Nestle India for a potential bullish breakout from a symmetrical triangle on the daily timeframe. Price has been consolidating after a strong impulsive move, and it is now respecting both trendline support and triangle resistance.
🔍 What I'm Seeing
Price created a strong rally, followed by a healthy consolidation.
A symmetrical triangle pattern has formed — showing tight price compression.
Price is currently sitting near the trendline support, indicating buyers are still active.
A breakout above the triangle could trigger the next bullish leg.
📈 Trade Idea
Entry Zone: Around current levels near the triangle breakout
Stop Loss: Placed below the trendline + recent swing lows
Target: Previous strong resistance zone near ₹1383
This gives a clean risk-to-reward setup with a logical structure: risk below support, target at the next major supply zone.
🎯 Why This Setup Makes Sense
Triangle breakout often leads to strong directional moves.
Trendline support confirms buyer strength.
Market structure is shifting bullish after breaking the downtrend earlier.
⚠️ Risk Note
This is not financial advice. Always manage risk properly and wait for a confirmed breakout candle before entering.
Intraday Trading vs Swing TradingIntroduction
Trading in financial markets can be broadly classified based on the holding period of positions. Among the most popular approaches are Intraday Trading and Swing Trading. Both strategies aim to profit from price movements in stocks, commodities, currencies, or derivatives, but they differ significantly in execution, time horizon, risk exposure, and required skill sets. Understanding these differences is crucial for traders to align their style with personal risk tolerance, market knowledge, and lifestyle.
Intraday Trading
Definition:
Intraday trading, often called day trading, involves buying and selling financial instruments within the same trading day. Positions are opened and closed before the market closes, ensuring no overnight exposure. The primary objective is to capitalize on small price fluctuations within the day.
Key Characteristics:
Time Horizon:
Trades last minutes to hours; rarely extend beyond one trading session. Traders monitor charts constantly, looking for quick opportunities.
Leverage:
Intraday traders often use leverage to amplify gains. While this can increase profits, it also magnifies potential losses.
Technical Analysis:
Decision-making heavily relies on technical indicators, charts, patterns, and volume analysis. Fundamental factors are less significant for short-term moves.
Liquidity:
High liquidity stocks are preferred to ensure positions can be entered and exited quickly without affecting price significantly.
Common Strategies:
Scalping: Making numerous trades to capture small price gaps.
Momentum Trading: Identifying strong trends and riding them for quick profits.
Breakout Trading: Buying/selling when price breaks key support/resistance levels.
Advantages:
Quick realization of profits.
No overnight risk due to market gaps.
High number of trading opportunities daily.
Risks and Challenges:
Requires constant attention and quick decision-making.
High transaction costs due to frequent trades.
Emotionally taxing; can lead to impulsive decisions.
Small errors can lead to significant losses due to leverage.
Ideal Trader Profile:
Intraday trading suits disciplined, experienced traders with access to advanced trading tools, strong risk management, and the ability to handle stress.
Swing Trading
Definition:
Swing trading involves holding positions for several days to weeks, aiming to capture medium-term price movements. Unlike intraday trading, swing traders accept overnight exposure and aim to profit from market swings rather than minute-to-minute volatility.
Key Characteristics:
Time Horizon:
Trades are held from a few days to several weeks. Swing traders monitor trends and patterns over longer time frames, such as daily or weekly charts.
Market Analysis:
Both technical and fundamental analysis play roles. Swing traders use chart patterns, trend lines, moving averages, and sometimes news events to guide trades.
Risk Exposure:
Positions are exposed to overnight market risks, such as news events or economic announcements that can cause gaps.
Position Sizing:
Typically, swing traders use moderate leverage or none, reducing risk of large losses.
Common Strategies:
Trend Following: Entering trades along the direction of a prevailing trend.
Counter-Trend Trading: Taking positions against short-term extremes in a larger trend.
Breakout and Pullback Trading: Capturing price movements after breaking support/resistance or after a retracement.
Advantages:
Less time-intensive than intraday trading.
Opportunities to profit from larger price moves.
Reduced stress compared to day trading.
More room for analysis and planning trades.
Risks and Challenges:
Exposure to overnight or weekend gaps.
Patience required; trades may take days to materialize.
Market reversals can erode profits.
Requires solid risk management to handle potential drawdowns.
Ideal Trader Profile:
Swing trading is suitable for part-time traders or those unable to monitor markets continuously. It requires patience, analytical skills, and emotional control to ride trends over days or weeks.
Key Differences Between Intraday and Swing Trading
Aspect Intraday Trading Swing Trading
Time Horizon Minutes to hours Days to weeks
Overnight Exposure No Yes
Focus Short-term price fluctuations Medium-term price trends
Leverage Often high Moderate or low
Analysis Mainly technical Technical + fundamental
Risk High due to leverage Moderate; exposure to overnight gaps
Profit Potential Small per trade; requires high frequency Larger per trade; fewer trades
Emotional Demand Very high Moderate
Tools Needed Real-time charts, fast execution platforms Charting software, research tools
Transaction Costs High due to frequent trades Lower due to fewer trades
Choosing Between Intraday and Swing Trading
Selecting the right trading style depends on several factors:
Time Commitment:
Intraday trading demands full-time monitoring. Swing trading can fit around a regular job.
Risk Appetite:
Traders seeking quick gains with tolerance for high risk may prefer intraday trading. Conservative traders or beginners may favor swing trading.
Capital Requirements:
Intraday trading may require more capital to maintain margin requirements. Swing trading generally needs less margin.
Personality:
Traders who enjoy fast-paced environments, quick decisions, and intense focus lean towards intraday trading. Those preferring research, patience, and a slower pace find swing trading more comfortable.
Market Conditions:
Highly volatile markets favor intraday trading, while stable trending markets are more suitable for swing trading.
Combining Both Approaches
Some traders combine intraday and swing trading strategies to balance risk and opportunity. For instance:
Intraday for quick profits: Exploiting short-term volatility.
Swing for medium-term positions: Capturing larger moves without daily stress.
This hybrid approach requires discipline, strong risk management, and clear rules for position sizing.
Risk Management Considerations
Regardless of style, risk management is critical:
Stop-Loss Orders:
Limit losses on each trade. Intraday traders may set tight stops; swing traders allow wider stops to account for volatility.
Position Sizing:
Avoid risking too much capital on a single trade. The common guideline is 1–2% of capital per trade.
Diversification:
Spread trades across multiple instruments to mitigate sector or stock-specific risks.
Emotional Control:
Emotional discipline is essential. Both styles demand strict adherence to trading plans and avoidance of impulsive decisions.
Conclusion
Both intraday trading and swing trading offer opportunities to profit in financial markets but cater to different trader profiles, time commitments, and risk tolerances. Intraday trading focuses on rapid, short-term gains requiring intense monitoring and quick execution, whereas swing trading emphasizes medium-term trends, patience, and less stressful decision-making.
Choosing between these styles requires honest self-assessment of skills, capital, emotional resilience, and available time. Many successful traders blend both approaches strategically, capturing short-term moves while holding selected positions over days for larger trends. Ultimately, success depends not just on style, but on disciplined execution, strong risk management, and continuous learning in ever-changing markets.

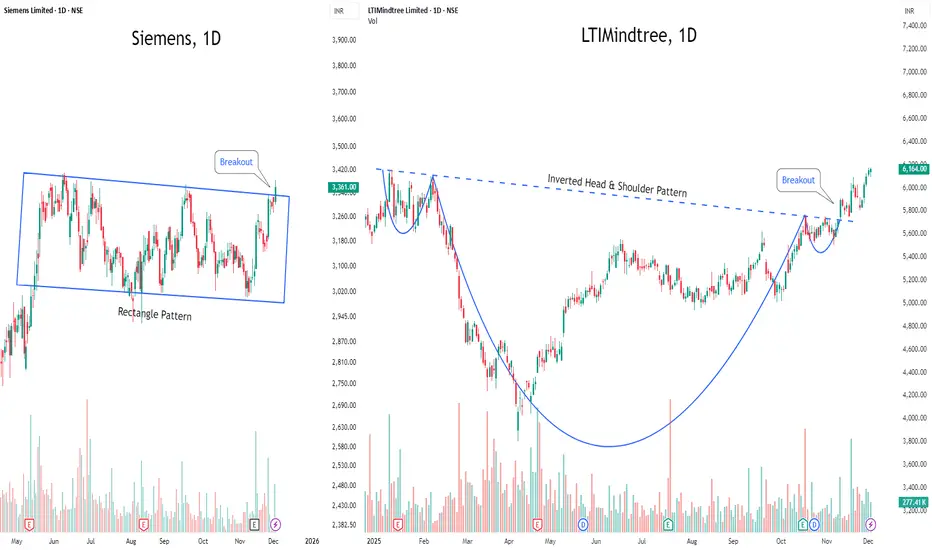
Breakout Radar: Two Stocks Turning Up the Heat This Week1️⃣ SIEMENS NSE:SIEMENS — Quiet No More
After chilling inside a rectangle range, SIEMENS just stepped out with a clean breakout.
The consolidation phase is done — now the chart is hinting at fresh upside energy. Momentum is officially back on the table. ⚡📈
2️⃣ LTIMINDTREE NSE:LTIM — Reversal Royalty
This one spent weeks building a textbook Inverted Head & Shoulder — and now it’s broken the neckline with style.
The breakout looks solid, and the stock is gearing up for a potential upside rally. 🚀💫
🔥 Two strong chart setups.
🔥 Two momentum-packed breakouts.
Perfect picks for traders eyeing action this week.
BTCUSD – Demand Zone Reaction & Trendline Reclaim | Bullish Setu📌 Key Highlights
Liquidity grab below previous lows triggered strong bullish momentum.
Clear demand zone reaction with buyers defending the same region multiple times.
Price has reclaimed the ascending trendline, showing a potential shift in short-term structure.
Now sitting in the retest zone, aligned with intraday support.
🎯 Trade Plan
Entry Zone: Retest of the trendline + support cluster
Invalidation: Below the demand zone (~$84,600)
Targets:
TP1: $93,200
Final Target: $94,000 supply zone
📈 Bias
Bullish, expecting continuation toward the next supply zone as long as BTC holds above the trendline and the retest support.
❌ Invalidation
Setup becomes invalid if BTC breaks below $84,600, which would signal weakness and potential continuation to the downside.

HAL – Trendline Rejection & Short SetupPrice has approached a major descending trendline and shown clear rejection near the supply zone. The structure is still respecting lower highs, indicating sellers are active at the top of the range.
I’ve taken a short position based on:
Retest of the descending trendline
Rejection from the previous supply zone
Overall bearish momentum within the channel
Good risk–reward towards the major demand zone around 4360
Invalidation:
Idea becomes invalid if price breaks and sustains above the trendline + supply zone.
Targets:
Major support / demand zone around 4360
Further downside if structure breaks
This is a technical analysis–based idea, not financial advice.
Let’s see how price reacts in the coming sessions.

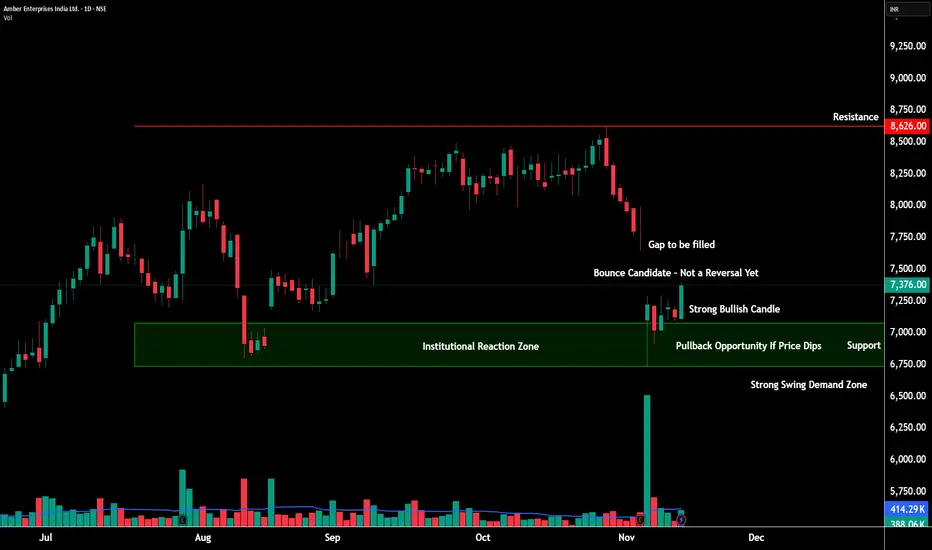
AMBER at a Critical Turning Point – Trend Shift or Just a Bounce💹 Amber Enterprises Ltd (NSE: AMBER)
Sector: Consumer Durables | CMP: 7376 | View: Early Reversal Attempt Inside Downtrend Structure
Chart Pattern: NA
Candlestick Pattern: Bullish Engulfing
📊 Price Action – What’s Really Happening?
Amber finally showed signs of life after a sharp slide from 8600 levels.
Buyers stepped in near 7180–7200, creating a clean intraday reversal base.
But — the larger trend is still down, so this bounce must prove itself above 7480–7536.
🧭 Support & Resistance
Resistances: 7484 | 7536 | 7592 | 7785
Supports: 7183 | 7090 | 6990 | 6882
Demand zones are strong → resistance zones are layered and heavy.
This is why confirmation matters.
📈 STWP Trading Analysis:
Bullish Breakout: 7400 | Stop Loss: 7180
A clean bounce developed from the swing demand zone after strong absorption of selling pressure. Despite this intraday strength, the daily chart remains in a downtrend with lower highs and lower lows. A possible close above 7480–7535 could shift bias to short-term bullish continuation. Below 7180, weakness can reappear quickly.
🧩 Final STWP Outlook
Momentum: Mild |Trend: Bearish | Risk: Moderate | Volume: Improving
⚠️ Disclosure & Disclaimer – Please Read Carefully
This content is strictly for educational and informational purposes.
It is not a buy/sell recommendation and should not be treated as investment advice.
I am not a SEBI-registered investment adviser.
Markets carry risk, and price can move unpredictably.
Always evaluate your risk, position size, and suitability before trading.
Consult a SEBI-registered adviser before making any financial decision.
Position Status: No active STWP position in AMBER at the time of analysis.
Data Source: TradingView & Market Data Snapshot.
💬 Found this breakdown useful?
🔼 Boost this post to help more traders learn structured analysis
✍️ Comment your views or setups — let’s grow together
🔁 Share it with traders who want clean, disciplined analysis
👉 Follow @STWP for more structured trade setups, zone-based insights, and disciplined trading approach.
🚀 Stay Calm. Stay Clean. Trade With Patience.
Trade Smart | Learn Zones | Be Self-Reliant 📊
Torrent Pharma Long Swing CandidateChart Analysis :
Price making a flat decending triangle pattern while holding a major weekly support of 3500 levels and looking to breakout above the trendline resistance zone and can be considered for long. One can enter here or wait for 3600 above daily close or one hour sustain above 3600.
Key Levels :
Targets (Resistance) - 3650/3685/3700/3750
StopLoss (Major Support) - 3500 below daily close
Disclaimer:
I am not SEBI registered. This analysis is for educational purposes only and not investment advice. Please do your own research before trading or investing.
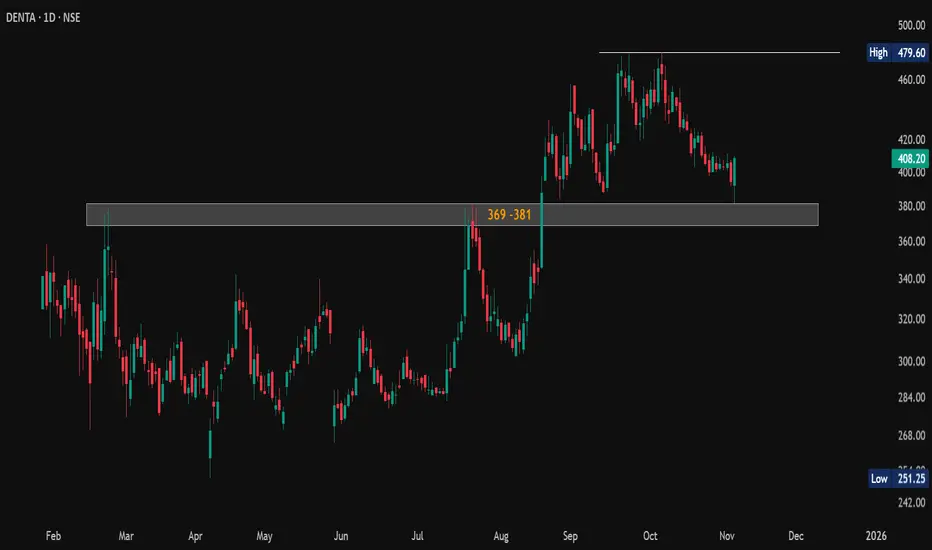
#DENTA Rebounds Strongly from Key Support!#DENTA (Denta Water & Infra Solutions Ltd.)
🔥 Strong bounce from key demand zone 369–381.
📉 Next support: 345–357 (WCB below 345 weakens setup).
📈 Previous resistance now acting as solid support.
💪 Trend intact above 345 (WCB).
🎯 Next resistance: 479–480.
Structure remains bullish — buy-on-dips setup in play! ⚡
#BreakoutRetest #PriceAction #Investing #TradingSetup #ChartAnalysis
📌 Disclaimer: This analysis is shared for educational purposes only. It is not a buy/sell recommendation. Please do your own research before making any trading decisions.
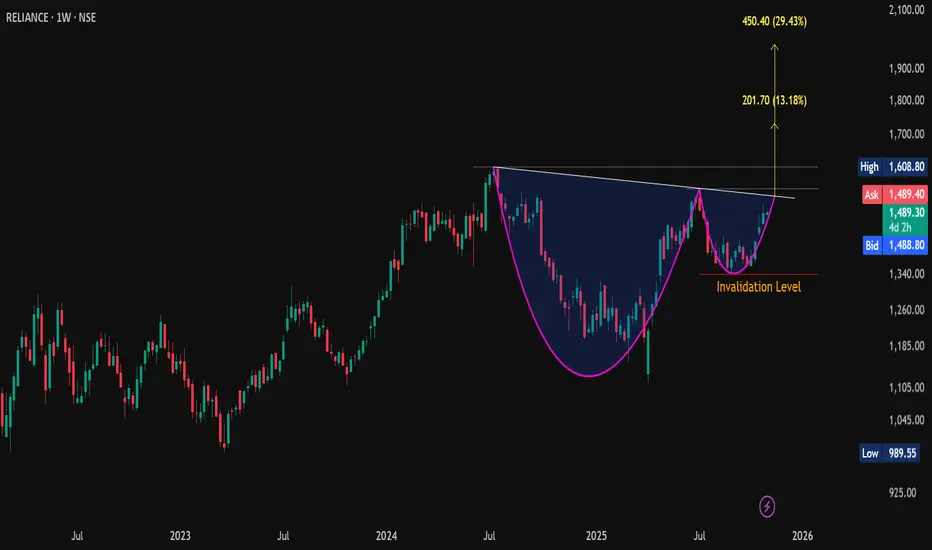
#Reliance | Cup & Handle Breakout Setup📊 CMP: 1489
💥 Breakout Level: WCB above Handle Neckline
🎯 Pattern Targets: 1730 / 1980+ (16 & 33% from CMP)
🛡 Support: 1456 / 1407-1409
🚧 Resistance: 1527-1551 / 1597-1609
❌ Invalidation Level: Below 1340.60 (WCB)
#CupnHandle #ChartPattern #PriceAction #SwingTrade
📌 Disclaimer: This analysis is shared for educational purposes only. It is not a buy/sell recommendation. Please do your own research before making any trading decisions.
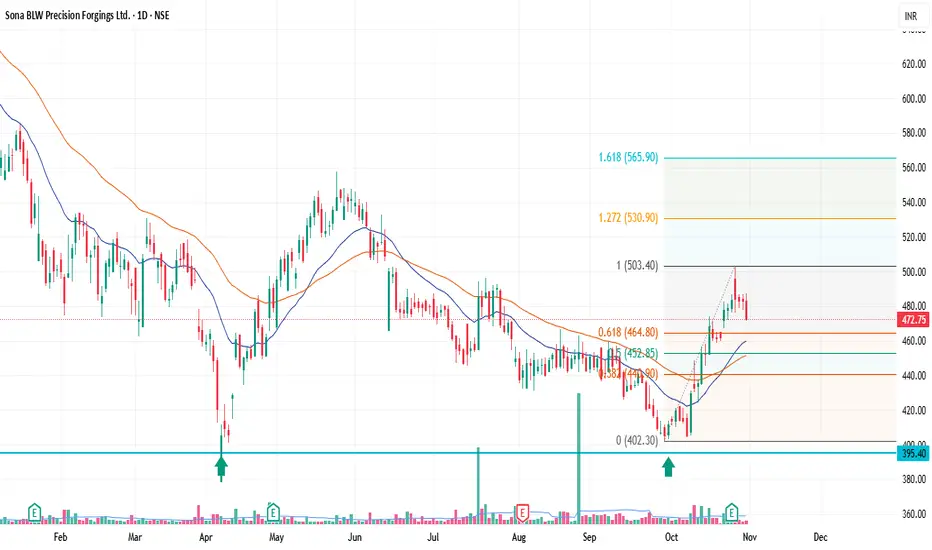
Sona BLW Precision Forgings Ltd. (SONACOMS) — pullback setup(SONACOMS) — Bullish Pullback Setup
📅 Timeframe: 1D | 💰 CMP: ₹472.75 | 📈 Volume: Above average
Technical View
Sona BLW has completed a strong impulse wave from ₹402 → ₹503, followed by a healthy pullback.
Price is now retracing near the 0.618 Fib level (₹464.8), aligning with the 21EMA — a zone that often acts as support during trend continuation.
Volume on the breakout was strong, showing accumulation interest.
Trade Plan
Entry Zone: ₹465–₹470
Stop Loss: ₹450 (below 0.5 Fib and 20EMA)
Targets:
🎯 T1: ₹503
🎯 T2: ₹530 (Fib 1.272)
🎯 T3: ₹566 (Fib 1.618)
Summary
✅ Uptrend resumption likely if ₹450 holds
✅ Rising 21EMA & 50EMA support the structure
✅ Strong breakout volume confirms institutional buying
Bias: Bullish
Risk–Reward: ~1:2.5+
Invalidation: Close below ₹450
Disclaimer : Risk management is crucial in this volatile market, so keep position sizing appropriate. This analysis is intended for educational purposes and not financial advice.
NIFTY Weekly OutlookNIFTY Weekly Outlook
NIFTY has closed almost flat but with bearish sentiment last week, ending at lows. 2 Consecutive rejection candles at 26100 has been formed in weekly TF. Hourly major swings are placed 26115 and 25690. Neutrally we should wait for breakout of any to plan the directional trade.
After a small pullback if index breaks 25690 then index will test 25100 zone as per Half Bat pattern.
By any chance if low of the current week does not break and breaks 26115 in the higher side, index will show double force move above 26115 to a new All Time High.
I am Not SEBI Registered
This is my personal analysis for my personal trading. Kindly consult your financial advisor before taking any actions based on this.

#BajajAuto | Inverse Head & Shoulders Breakout Alert!📊 CMP: 9057 | 🎯 Pattern Target: 9900+ (+10% from cmp)
🛡 Support: 9012-9005 / 8956 | 🚧 Resistance: 9168-9174 / 9225-9237 / 9455-9490
❌ Invalidation Level: Below 9005 (4 HCB)
#BajajAuto | #InverseHeadnShoulders | #ChartPattern | #SwingTrade | #PriceAction
📌 Disclaimer: This analysis is shared for educational purposes only. It is not a buy/sell recommendation. Please do your own research before making any trading decisions.

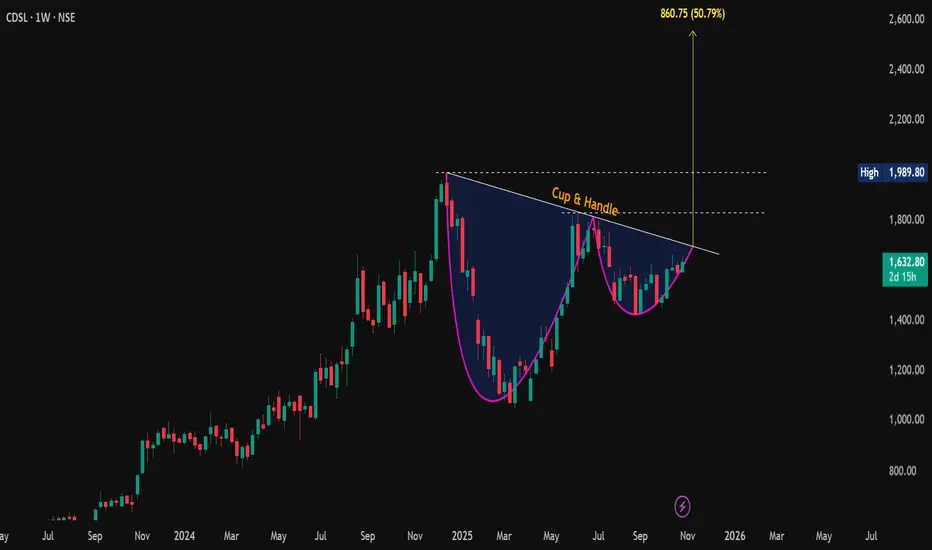
#CDSL – Cup & Handle Brewing!📊 CMP: 1632.8
☕🎯 Target: 2500+ 🚀
🛡 Support: 1597–1582 | 🔥 Resistance: 1776–1829 / 1944–1990 (ATH)
📈 Breakout above neckline = +50% potential move!
❌ Invalidation below 1421 (WCB)
#CDSL | #CupAndHandle | #ChartPattern | #SwingTrade | #PriceAction
📌 Disclaimer: This analysis is shared for educational purposes only. It is not a buy/sell recommendation. Please do your own research before making any trading decisions.
#HUDCO – Inverse Head & Shoulders Alert!📈 CMP: 225.90
🎯 Pattern Target: 340+ 🚀
🏔 ATH: 353.70
🛡 Support: 220–212 | 🔥 Resistance: 246–254 / 263
⚡ Breakout above neckline = +40% move!
❌ Invalidation below 202.50 (WCB)
#HUDCO | #InverseHeadnShoudlers | #ChartPattern | #SwingTrade | #PriceAction
📌 Disclaimer: This analysis is shared for educational purposes only. It is not a buy/sell recommendation. Please do your own research before making any trading decisions.

MCX | Strong Bullish Candle + VWAP Alignment + Swing Reversal Se📈 MCX | Strong Bullish Candle + VWAP Alignment + Swing Reversal Setup 🚀
🔹 Entry Zone: ₹9,305.50 – ₹9,335.00
🔹 Stop Loss: ₹8,962.50 (Risk ~343 pts)
🔹 Supports: 9,081 / 8,856.50 / 8,729.50
🔹 Resistances: 9,432.50 / 9,559.50 / 9,784.00
🔹 Swing Demand Zone: ₹7,880 – ₹7,725.50
🔹 Intraday Demand Zone: ₹9,052 – ₹8,975.50
🔑 Key Highlights
✅ Strong Bullish Candle signaling buyer dominance and swing reversal
✅ Bullish VWAP Alignment confirming upward control by buyers
✅ RSI improving from oversold region, supporting reversal momentum
✅ Bollinger Squeeze-Off indicating volatility expansion likely
✅ Volume near average levels – potential for fresh accumulation on breakout
🎯 STWP Trade View
📊 Momentum supports a bullish continuation if price sustains above ₹9,432. A breakout beyond ₹9,560 can extend the rally toward ₹9,784.
⚠️ The ₹9,052–₹8,975 zone offers intraday support, while ₹7,880–₹7,725 remains the long-term swing accumulation area for positional traders.
💡 Learning Note
This setup highlights how VWAP alignment with a strong bullish candle near demand zones acts as a multi-layer confirmation of trend reversal. Watching for volume pickup near resistances helps validate institutional buying strength.
Final Outlook: Momentum: Strong, Trend: Bullish, Risk: Low, Volume: High
________________________________________
________________________________________
⚠️ Disclosure & Disclaimer – Please Read Carefully
The information shared here is meant purely for learning and awareness. It is not a buy or sell recommendation and should not be taken as investment advice. I am not a SEBI-registered investment adviser, and all views expressed are based on personal study, chart patterns, and publicly available market data.
Trading—whether in stocks or options—carries risk. Markets can move unexpectedly, and losses can sometimes exceed the money you have invested. Past performance or past setups do not guarantee future results.
If you are a beginner, treat this as a guide to understand how the market works and practice on paper trades before risking real money. If you are experienced, always assess your own risk, position sizing, and strategy suitability before entering trades.
Consult a SEBI-registered financial adviser before making any real trading decision. By engaging with this content, you acknowledge full responsibility for your trades and investments.
Position Status: No active position in MCX at the time of analysis.
Data Source: TradingView & NSE India (Past Chart Reference) (Historical levels)
💬 Found this useful?
🔼 Give this post a Boost to help more traders discover clean, structured learning.
✍️ Drop your thoughts, questions, or setups in the comments — let’s grow together!
🔁 Share with fellow traders and beginners to spread awareness.
👉 “If you liked this breakdown, follow for more clean, structured setups with discipline at the core.”
🚀 Stay Calm. Stay Clean. Trade With Patience.
Trade Smart | Learn Zones | Be Self-Reliant 📊

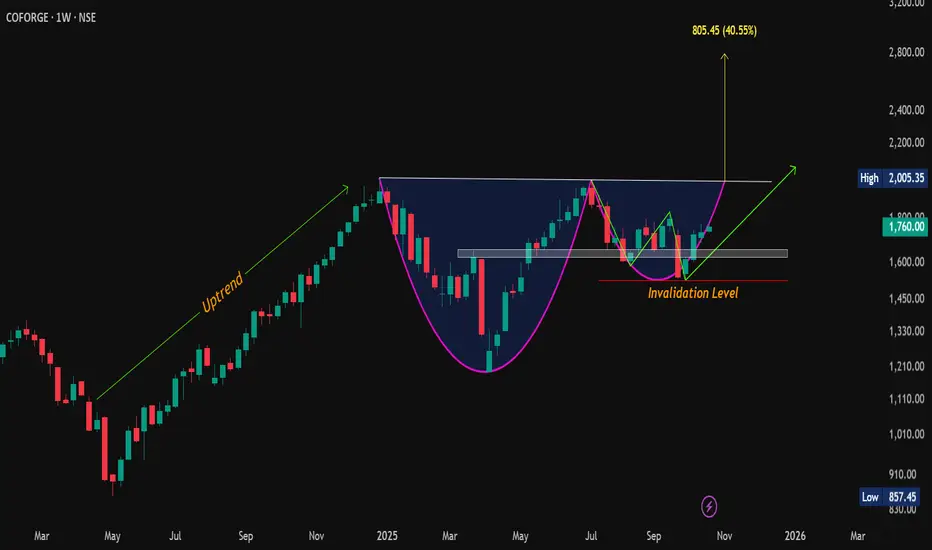
Pattern Inside a Pattern! Cup & Handle Meets the W on #Coforge💰 CMP: 1760
🎯 Cup & Handle Target: 2790 (~58% from cmp)
⚡️ W-Pattern Target: 2060
🧱 Supports: 1658-1622 / 1584
🚧 Resistances: 1795-1830 / 1950-2005
❌ Invalidation: Weekly Close Below 1525
📈 Bullish setup loading… watch for breakout above neckline!
#Coforge | #CupAndHandle | #WPattern | #ChartPatterns | #SwingTrading | #PriceAction | #BreakoutSetup
📌 Disclaimer: This analysis is shared for educational purposes only. It is not a buy/sell recommendation. Please do your own research before making any trading decisions.
ADANI PORTS | Bullish Momentum + RSI Breakout - STWP________________________________________
📊 ADANI PORTS | Bullish Momentum + RSI Breakout 🚀
Ticker: NSE: ADANIPORTS | Sector: Port & Logistics
CMP: ₹1,437.80
Rating: ⭐⭐⭐⭐ (Bullish Momentum Breakout – For Educational Purposes Only)
Pattern Observed: 📈 Price Action Setup – Breakout from Consolidation Zone
Candlestick Pattern: Strong Bullish Momentum Candle
________________________________________
🟦 Chart Summary
Adani Ports has formed a strong bullish candle on high volume, breaking above a short-term consolidation resistance zone. The structure reflects renewed buying strength and momentum, suggesting a possible continuation toward higher resistance levels in the near term.
________________________________________
🟨 Technical Indicators Summary
The chart highlights Bullish Momentum supported by a Strong Bullish Candle, indicating renewed buying interest. A clear RSI breakout confirms strengthening momentum, while the Bollinger Band Squeeze-On Compression suggests that volatility is contracting — often a precursor to a sharp directional move. This combination of momentum, structure, and volume alignment signals a potential breakout zone, reflecting a powerful setup where multiple indicators converge to reinforce short-term bullish sentiment.
________________________________________
🟩 Supports: 1,408 / 1,379 / 1,362
🟥 Resistances: 1,454 / 1,471 / 1,500
________________________________________
🟩 Swing Trade Study (Educational Viewpoint)
From a technical study perspective, Adani Ports is showing signs of a bullish breakout above ₹1,441.90, which may signal momentum continuation. The reference support for this structure lies near ₹1,387.10, defining the chart-based risk zone of around ₹54.8. This observation is shared only for educational and analytical purposes to demonstrate structured swing analysis.
________________________________________
🟩 Intraday Observation (For Learning Purposes)
For intraday study, the potential bullish breakout zone lies between ₹1,437.80 and ₹1,442, with immediate support around ₹1,424. Any price reaction near ₹1,430–₹1,435 could serve as an educational case for identifying intraday re-entry zones when price retests breakout areas. Traders should always apply strict stop-loss and risk management if trading live.
Final Outlook: Momentum: Strong, Trend: Bullish, Risk: Low, Volume: High
💡 Learning Note:
This case study helps learners understand how volume confirmation, RSI breakout, and price structure alignment can signal early trend continuation opportunities — a key concept in technical market reading.
________________________________________
⚠️ Disclosure & Disclaimer (SEBI-Compliant)
This content is created solely for educational and informational purposes to help readers understand technical analysis and market structure.
It does not constitute investment advice, research recommendation, or a solicitation to buy or sell any security.
The author is not a SEBI-registered investment adviser or research analyst.
All charts, patterns, and levels are based on personal study and historical data available from public sources such as TradingView and NSE India.
Position Status: No active position in ADANIPORTS at the time of publication.
Trading and investing involve risk. Market movements can be unpredictable, and losses may exceed invested capital.
Readers are strongly advised to consult a SEBI-registered investment adviser before making any trading or investment decisions.
By engaging with this post, you acknowledge that you take full responsibility for your own trades, decisions, and outcomes.
________________________________________
💬 Found this useful?
🔼 Boost this post to support structured learning content.
✍️ Share your thoughts, questions, or observations — let’s grow together!
🔁 Share with learners and traders to promote responsible market education.
👉 “If you liked this breakdown, follow for more disciplined, educational trade setups.”
🚀 Stay Calm. Stay Clean. Trade With Patience.
Trade Smart | Learn Zones | Be Self-Reliant 📊
________________________________________
