HDFCBANK 1D Time frameCurrent Snapshot
Last Traded Price: ₹965.90
Day’s Range: ₹960.30 – ₹965.65
52-Week Range: ₹806.50 – ₹1,018.85
Market Cap: ₹14.82 lakh crore
Volume: 2.46 million shares
VWAP: ₹962.88
📈 Trend & Indicators
Trend: Neutral to mildly bearish; trading below 50-day and 200-day EMAs.
RSI (14): 48.73 – Neutral; no overbought or oversold signals.
MACD: Positive at +1.19 – Suggests short-term bullish momentum.
Moving Averages: Short-term MAs indicate a neutral to bearish outlook.
🔮 Outlook
Bullish Scenario: Break above ₹965.65 with strong volume could target ₹975–₹980.
Bearish Scenario: Drop below ₹960.30 may lead to further decline toward ₹953–₹955.
Neutral Scenario: Consolidation between ₹960–₹965; breakout needed for directional move.
📌 Key Factors to Watch
Market Sentiment: Broader market movements can influence HDFC Bank's performance.
Economic Indicators: Changes in interest rates or inflation can impact banking stocks.
Company News: Any announcements regarding HDFC Bank's financials or strategic initiatives.
Swingtrading

SBIN 1H Time framePrice Snapshot
Current price around : ~ ₹818
52-week high/low: ~ ₹875 / ₹680
Recent price action: modest upside from support, but resistance overhead
📈 Indicators & Momentum (Hourly Approx)
Moving Averages (short-period) are just below current price → giving support
Medium/longer hourly MAs (20-50 hr) are above → resistance zones
RSI (1-hour): neutral to slightly bullish, not overbought yet
Momentum indicators show mild strength but not a breakout — watching for volume to confirm
🧭 Short-Term Outlook
Bullish scenario: If SBI holds above ~₹820 and breaks past ~₹825-830, upward target could be ~₹840+
Bearish scenario: If it loses support around ~₹805-810, risk of pullback toward ~₹800 or below
Bias: Slightly bullish in the short term, provided support holds and resistance tests are successful

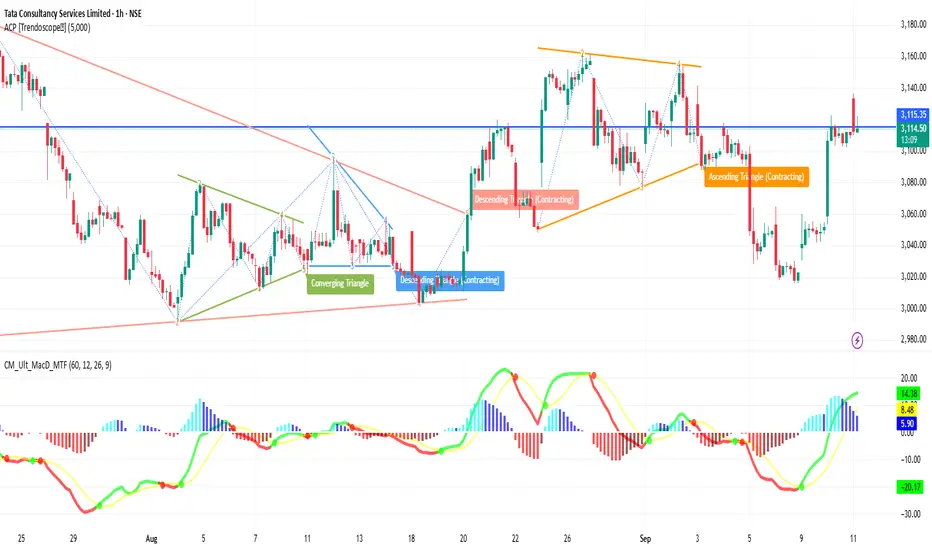
TCS 1H Time frameTCS 1-Hour Snapshot
Price is around ₹3,110
Showing small gains in recent sessions
Has been under pressure from broader IT sector weakness, but holding above some short-term support
🔎 Technical Indicators & Trend
Moving Averages (short-term hourly) are slightly below current price → providing support
Medium-term MAs (50-hour etc.) are above → resistance overhead
RSI (hourly) is moderately neutral—neither strongly overbought nor oversold
Trend strength appears modest; no sharp momentum bars or volume spikes indicating breakout
🔧 Support & Resistance Levels (1H)
Support: ~₹3,080–₹3,090 first support zone
Resistance: ~₹3,130–₹3,140 nearby resistance
🧭 Short-Term Outlook
Bullish Case: A break above ~₹3,130-3,140 with volume could push toward ~₹3,160
Bearish Case: If it fails to break resistance and drops below ~₹3,090, possible move toward ~₹3,060
Overall Bias: Slightly bullish to neutral; waiting for confirmation from resistance breakout
SENSEX 1H Time frameCurrent Snapshot
Sensex Last Price: around 81,425
Intraday High (1H): near 81,580
Intraday Low (1H): around
📈 Trend View (1H)
Above 81,580 → 82,000 = bullish momentum likely.
Below 81,225 → 81,000 = bearish sentiment can increase.
Staying between these = sideways consolidation.
📊 Trend & Bias
Above 81,600–82,000 → bullish breakout, upside momentum likely.
Below 81,000 → bearish pressure, possible drift toward 80,500.
As long as price holds higher lows on 1H candles, trend stays mildly positive.
⚠️ Risk Factors
Sudden global news or domestic policy updates may cause sharp reversals.
If volume is weak during up-moves, breakouts may fail.
Overbought conditions on momentum indicators (RSI/MACD) could slow the rally.

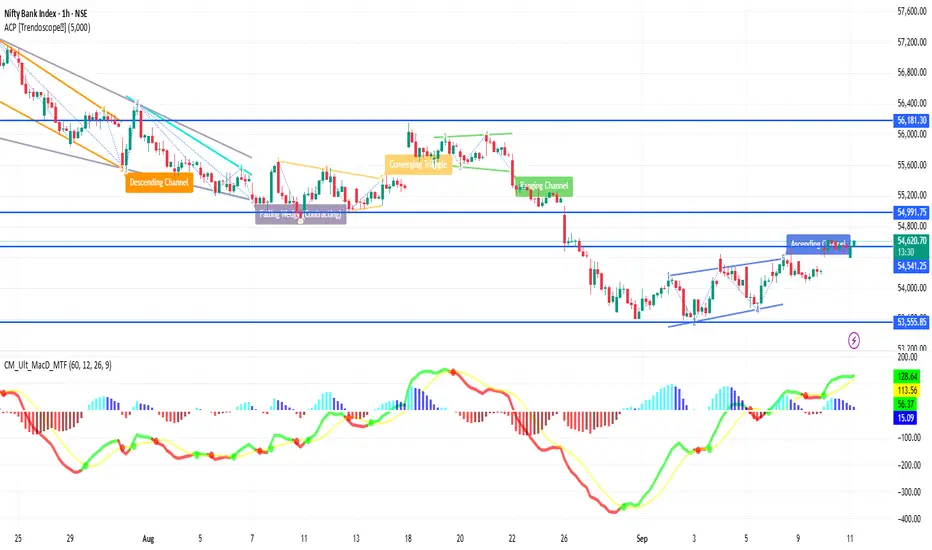
BANKNIFTY 1H Time frameBankNifty 1H Snapshot
Current Price: ~54,581
Recent Range: ~54,400 – 54,700
Bias: Slightly bullish, holding above short-term support
📈 Key Levels
Immediate Resistance: 54,650 – 54,700
Next Resistance: 54,800 → if broken, can open upside momentum
Immediate Support: 54,450
Deeper Support: 54,300 → then 54,000
🔎 Indicators (1-Hour)
RSI: Mid-60s → bullish but not yet extreme
MACD: Positive crossover → supports buying momentum
Stochastic: Near overbought → watch for minor pullback
🧭 Outlook
Bullish Case: Sustained above 54,600 → next push toward 54,700-54,800
Bearish Case: Slip below 54,450 → opens weakness toward 54,300
Overall Bias: Moderately bullish while holding above 54,450
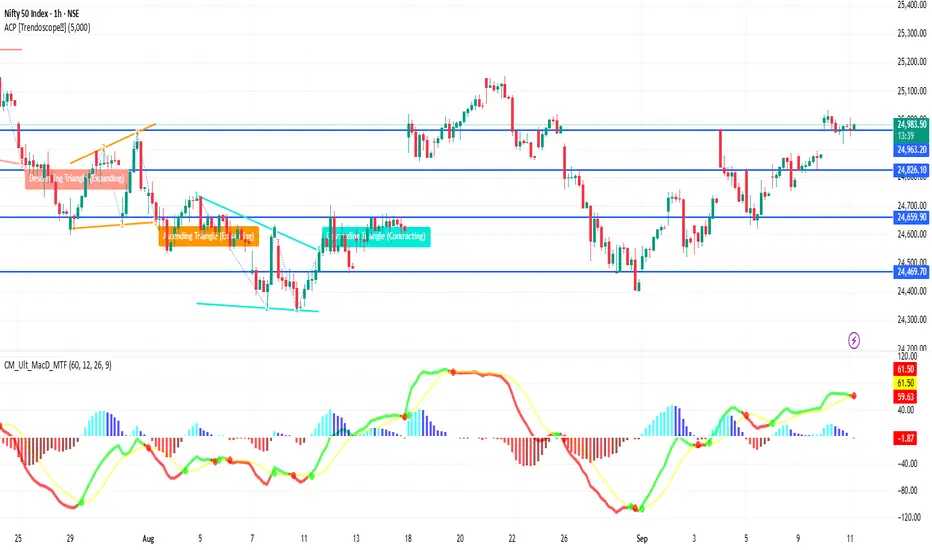
NIFTY 1H Time frameSupport: ~24,930 → crucial short-term base
Resistance: ~25,047 → price has tested this zone, rejection possible if it fails to close above
If price decisively breaks above ~25,047, next target is ~25,174
If it drops below ~24,868, downside risk toward ~24,778
🧭 Outlook (1-Hour)
Bullish Case: Hold above ~24,930 → upside toward ~25,047-25,174
Bearish Case: Drop below ~24,868 → weakness toward ~24,778 or lower
Overall Bias: Slightly positive, but price is near resistance and needs good volume or momentum to break above
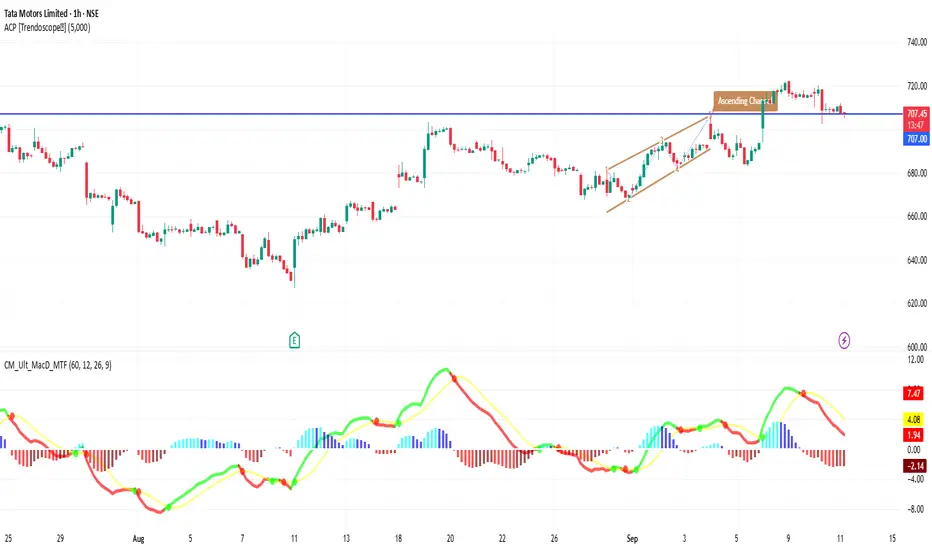
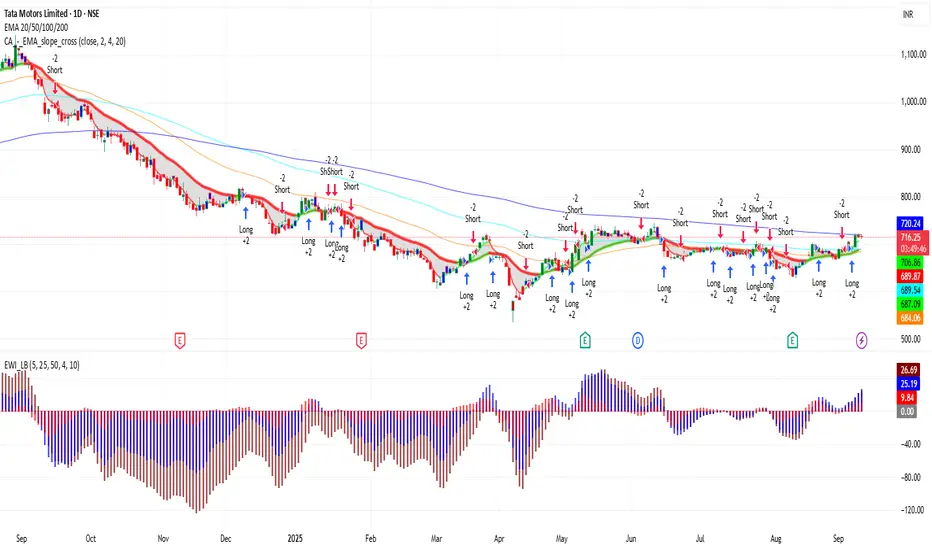
TATAMOTORS 1H Time frameMarket Snapshot
Current Price: ~₹708
Intraday Range: ~₹706 – ₹712
Bias: Sideways to mildly bullish
📈 Moving Averages (1H)
20-hour MA: ~₹707 → acting as short-term support
50-hour MA: ~₹704 → supportive level below
200-hour MA: ~₹699 → strong base, long-term intraday support
All moving averages are aligned above each other → bias is bullish.
🔎 Indicators
RSI (14, hourly): ~59 → Momentum positive, not overbought
MACD (1H): Bullish crossover, showing upward momentum
ADX: ~20 → Trend strength is still weak to moderate
Stochastic: Near overbought → caution for minor pullback
🔧 Key Levels
Support: ₹705 → first support, then ₹700 as stronger base
Resistance: ₹712 → immediate resistance, next at ₹715
🧭 Short-Term Outlook
Bullish Case: Break above ₹712–715 zone could push price toward ₹720+.
Bearish Case: Failure at resistance + RSI overbought may drag it back to ₹705 or even ₹700.
Overall Bias: Slightly bullish, but resistance is close and strong.
GMDC Breakout GMDC BREAKOUT on 45 min and 1 hrs. Gmdc is in good Momentum. It's can give another 4 -5% movement easily. It can be achieve 580 tgt easily. It's already moved good.
Now keep trial SL and Enjoy Journey.
Buy was given near 426.
Tgt 580 - 600
Consult your financial advisor before making any position in stock market. My all views are for educational purposes only.
Visit my profile for more information

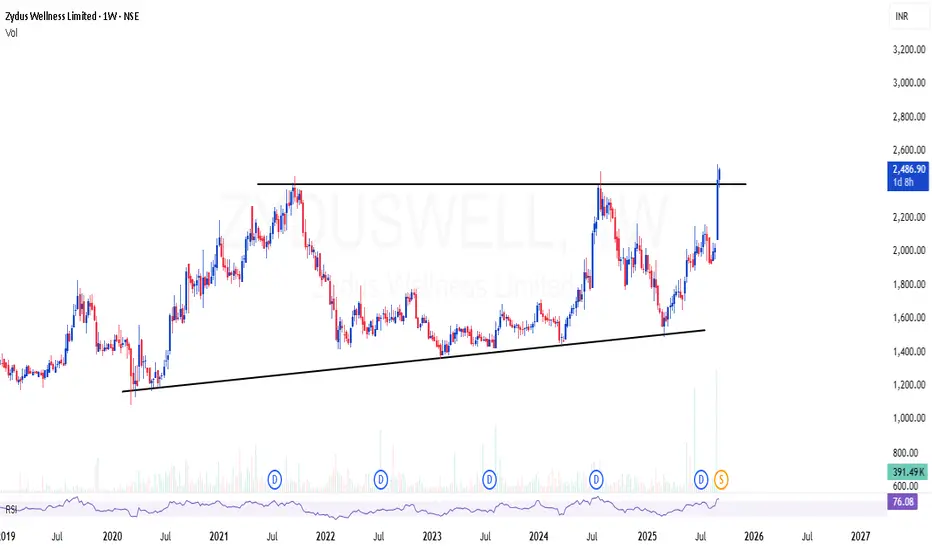
ZYDUSWELL | Simple channel breakout - Looks potential 60-70%ZYDUSWELL | Simple channel breakout - Looks potential 60-70%
CMP : 2486 (Dip : 2200)
SL below : 2000
Target : 4000+
SBIN 30Minutes Time frame📍 SBIN – 30M Important Levels (Current)
🔹 Support Zones
820 – 825 → Immediate intraday support
805 – 810 → Strong support zone; buyers likely to defend
790 – 795 → Major support; breakdown here may trigger deeper downside
🔹 Resistance Zones
840 – 845 → Immediate intraday resistance
855 – 860 → Strong resistance; breakout may extend upside momentum
875 – 880 → Major resistance; if crossed, can fuel a bigger rally
⚖️ 30M Trend Outlook
SBIN is currently in a range-bound to bullish phase on the 30M chart.
Holding above 825 keeps the short-term bias positive.
Breakout above 845 may target 860 – 880.
Breakdown below 825 may pull it back toward 810 – 795.

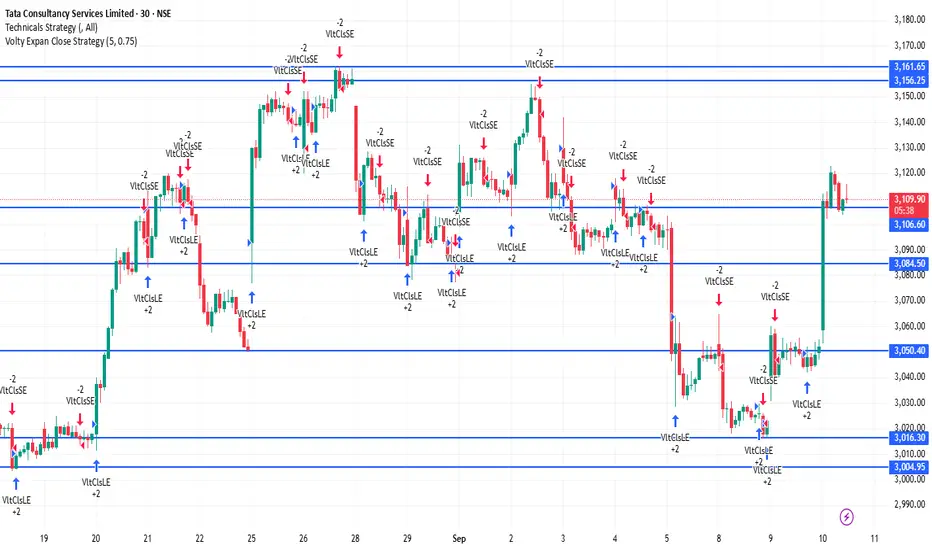
TCS 30Minutes Time frameTCS – 30-Minute Time Frame Important Levels (Current Estimate)
Support Zones
₹3,080 – ₹3,090 → Immediate intraday support
₹3,050 – ₹3,060 → Stronger support level where dip-buying may emerge
₹3,020 – ₹3,030 → Major support; a breakdown here may indicate intraday weakness
Resistance Zones
₹3,130 – ₹3,140 → Immediate intraday resistance
₹3,160 – ₹3,170 → Strong resistance zone; a breakout may extend upward momentum
₹3,200 – ₹3,210 → Major resistance; surpassing this can fuel a more sustained rally
Intraday Trend Outlook (30M Chart)
The trend appears mildly bullish as long as TCS holds above ₹3,080.
A clear move above ₹3,140 can open the path toward ₹3,160–₹3,200.
If it falls below ₹3,050, price may pull back toward ₹3,020, and a break under that could signal further downside.
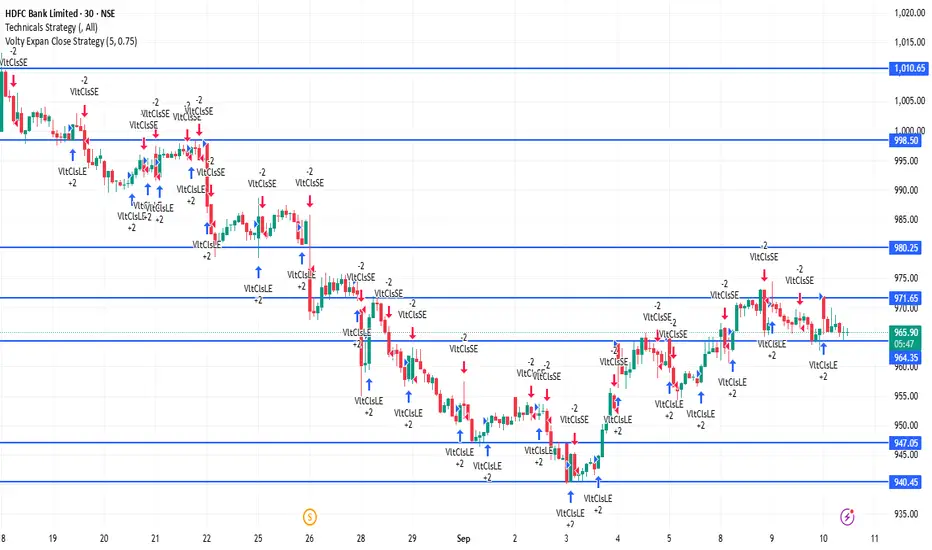
HDFCBANK 30Minutes Time frameHDFC Bank – 30M Important Levels (Current)
These levels are calculated using today’s intraday pivot data and provide reliable reference points for short-term trading.
Pivot Point (Mid-Level): ~₹967
First Resistance (R1): ~₹972
Second Resistance (R2): ~₹979
First Support (S1): ~₹960
Second Support (S2): ~₹955
These intraday pivots help highlight key zones where intra-day price action often stalls, reverses, or accelerates.
Intraday Trend Outlook (30M Chart)
Above ₹972: Bullish momentum may continue, with potential upside toward ~₹979.
Between ₹960 – ₹972: Neutral-to-bullish range; watch for sustain or reversal.
Below ₹960: Bearish pressure may build, potentially testing down to ~₹955.
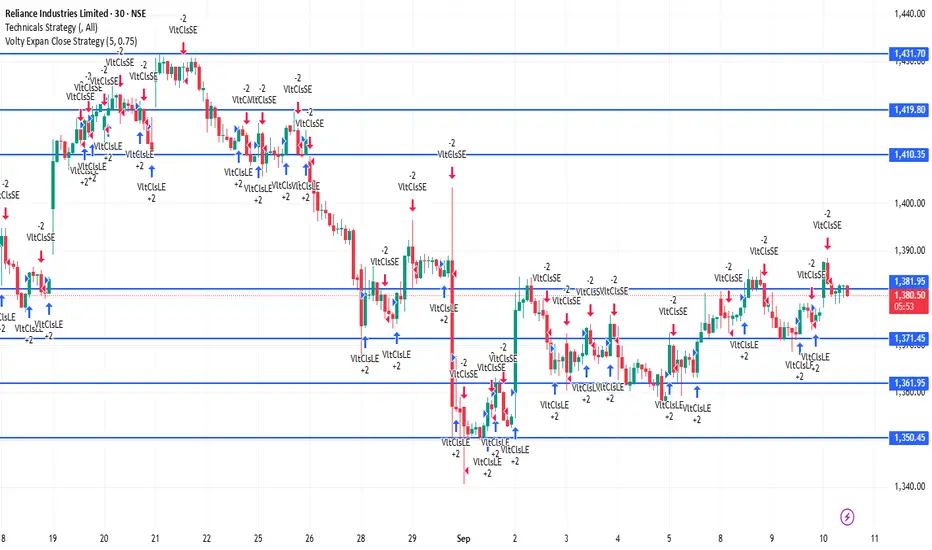
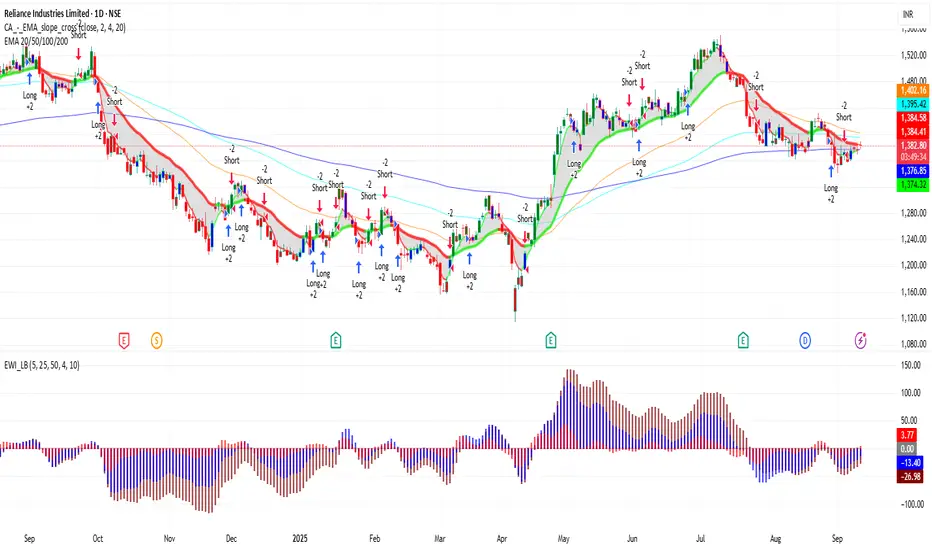
RELIANCE 30Mitunes Time frame📊 Reliance Industries (30M Chart)
Current Zone: Trading around ₹1,380–₹1,382.
🔻 Support Levels:
₹1,375 → Immediate intraday support
₹1,369–₹1,370 → Strong support zone
₹1,362–₹1,363 → Major support
🔺 Resistance Levels:
₹1,382–₹1,383 → Immediate hurdle
₹1,387–₹1,388 → Strong resistance zone
₹1,394–₹1,395 → Major resistance
📈 Trend Outlook (30M):
Above ₹1,383 → Momentum stays bullish, price may push toward ₹1,388–₹1,395.
Between ₹1,369–₹1,382 → Neutral to slightly bullish consolidation zone.
Below ₹1,369 → Weakness may drag price toward ₹1,363 or lower.
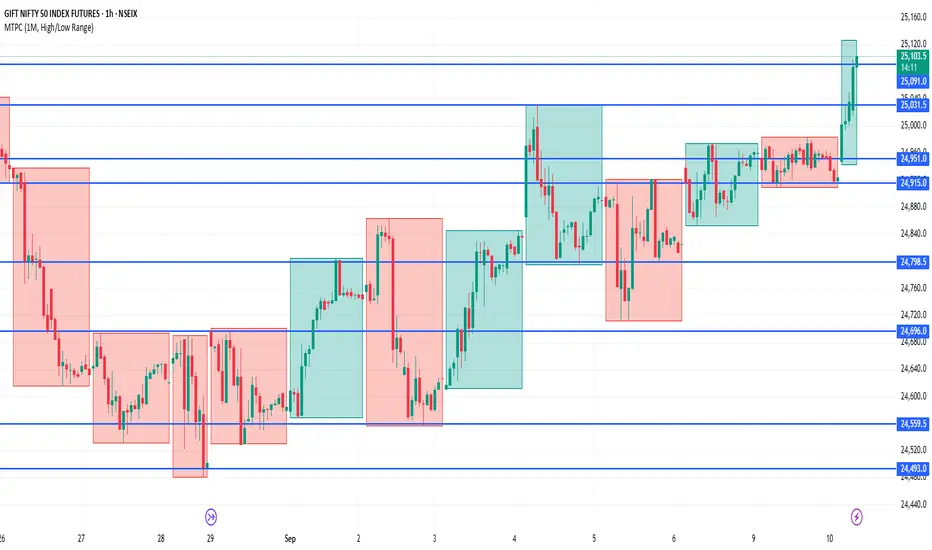
NIFTY1! 30Minutes Time frame📊 NIFTY1! – 30-Minute Timeframe (Current)
Current Price Zone: Approximately 25,092
🔻 Support Levels:
25,060 – Immediate support
25,020 – Stronger support zone
24,980 – Major support; breakdown here may lead to further weakness
🔺 Resistance Levels:
25,130 – Immediate resistance
25,180 – Strong resistance zone
25,220 – Major resistance; breakout above this level may signal bullish momentum
📈 Intraday Trend Outlook
Above 25,130: Bullish momentum likely; potential upside toward 25,180–25,220.
Between 25,060 – 25,130: Neutral to slightly bullish consolidation zone.
Below 25,060: Weakness may develop; potential slide toward 25,020–24,980.
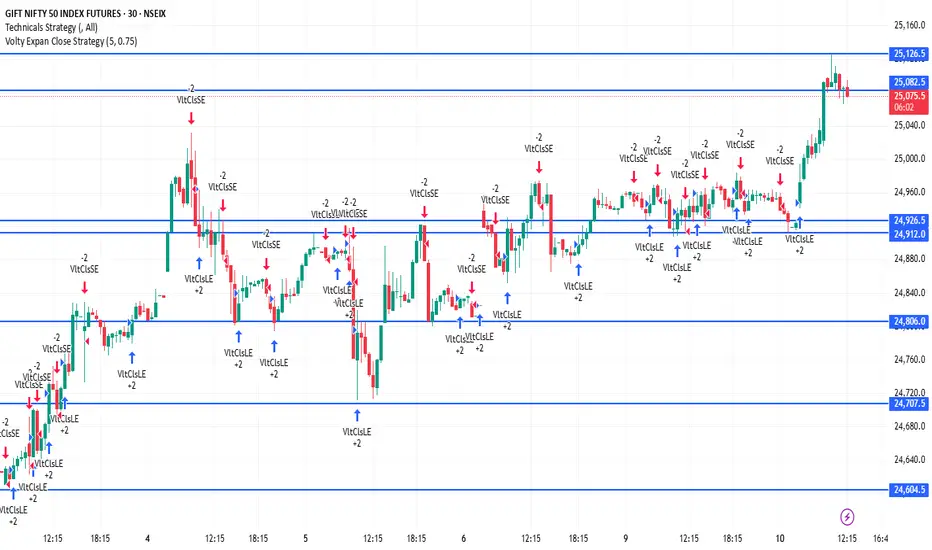
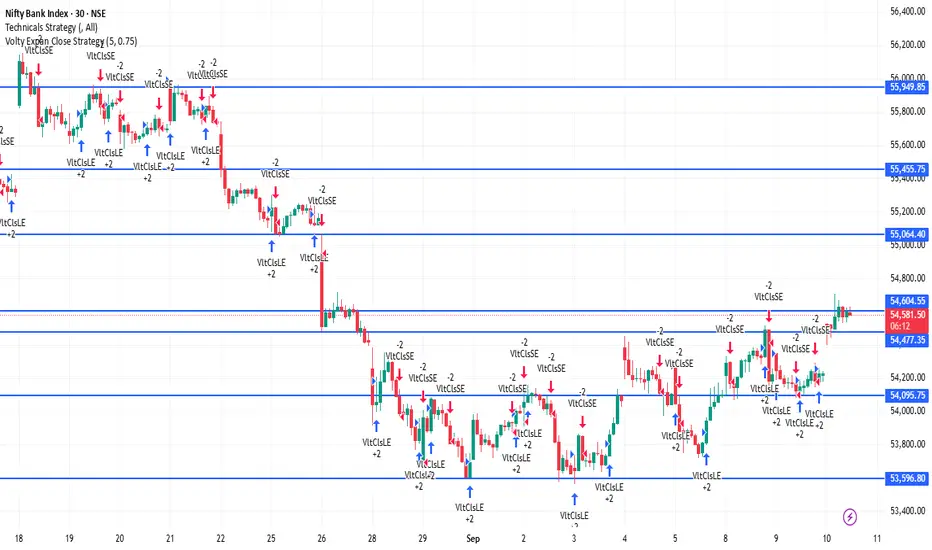
BANKNIFTY 30 Minutes Time frame Bank Nifty (30-Minute Timeframe Snapshot, 10 Sept 2025 ~12:30 PM IST)
Current Level: Around 54,615 – 54,620
Change: Up roughly +400 points (+0.7% approx.) compared to yesterday’s close
Key Pivot Levels (30-min basis)
Pivot: 54,215
Resistance Levels:
R1: 54,351
R2: 54,487
R3: 54,623
Support Levels:
S1: 54,080
S2: 53,944
S3: 53,809
✅ In short: Bank Nifty is trading strongly above its pivot (54,215) and is hovering close to R3 (54,623) on the 30-minute chart, showing bullish momentum.
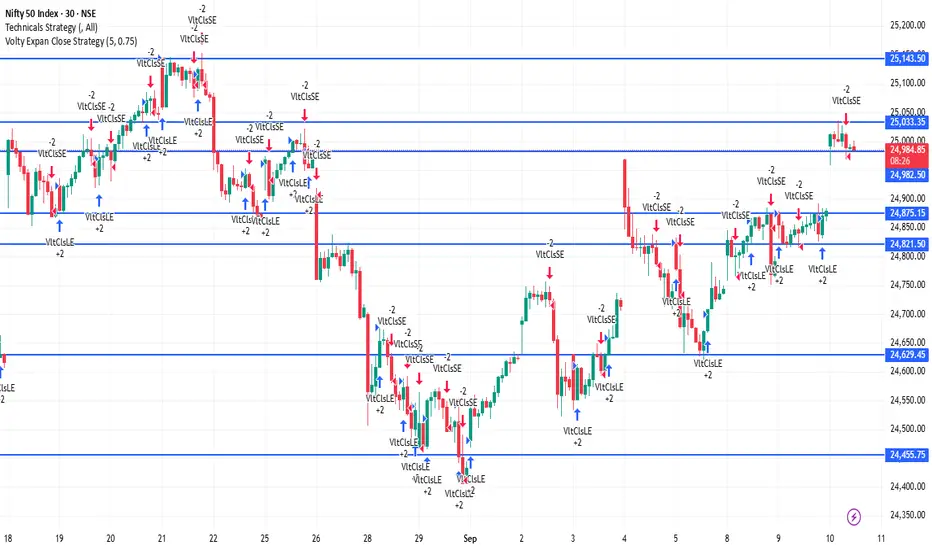
NIFTY 30Minutes Time frameNifty 50 Snapshot (10 Sept 2025 ~12:30 PM IST)
Current Level: Around 24,990 – 25,000
Change: Up about +125 points (~+0.5%) from the previous close
Pivot Levels (Daily Basis – works for 30-min chart too)
Pivot Point: 24,858
Resistance Levels:
R1: 24,902
R2: 24,936
R3: 24,980
Support Levels:
S1: 24,824
S2: 24,780
S3: 24,747
✅ Analysis (30-Minute View):
Nifty is trading around 25,000, which is above R3 (24,980). This shows strong bullish momentum intraday. If it sustains above R3, the market may extend gains further; otherwise, some profit-booking can pull it back toward R2 or R1 levels.
RELIANCE 1D Time frame📍 RELIANCE – 1D Important Levels (Current)
🔹 Support Zones
2,870 – 2,900 → Immediate daily support
2,820 – 2,840 → Strong support; buyers expected here
2,750 – 2,770 → Major support; breakdown may trigger deeper correction
🔹 Resistance Zones
2,950 – 2,970 → Immediate daily resistance
3,020 – 3,050 → Strong resistance zone; breakout may extend bullish momentum
3,120 – 3,150 → Major resistance; if crossed, Reliance may trend strongly higher
⚖️ Daily Trend Outlook
Reliance is in a sideways-to-bullish phase on the daily chart.
Price is consolidating between 2,870 support and 2,970 resistance.
A breakout above 2,970 – 3,020 can open upside towards 3,050 – 3,150.
A breakdown below 2,870 can drag it toward 2,820 – 2,770.
TATAMOTORS 1D Time frame📍 TATAMOTORS – 1D Important Levels (Current)
🔹 Support Zones
900 – 910 → Immediate daily support
870 – 880 → Strong support; buyers likely to defend here
835 – 850 → Major support; breakdown here may shift trend bearish
🔹 Resistance Zones
940 – 950 → Immediate daily resistance
970 – 980 → Strong resistance; breakout above this can fuel momentum
1,000 – 1,020 → Major psychological resistance; if crossed, bullish trend strengthens further
⚖️ Daily Trend Outlook
Tata Motors is in a bullish phase on the daily chart, making higher lows and sustaining above key supports.
As long as price holds above 900, the stock remains positive.
A breakout above 950 – 980 may open the path towards 1,000+.
A breakdown below 900 may lead to weakness toward 880 – 850.
KOTAKBANK 1D Time frame📍 KOTAKBANK – 1D Important Levels (Current)
🔹 Support Zones
1,730 – 1,750 → Immediate daily support
1,680 – 1,700 → Strong support; buyers likely to defend here
1,620 – 1,640 → Major support; breakdown here may turn trend bearish
🔹 Resistance Zones
1,780 – 1,800 → Immediate daily resistance
1,830 – 1,850 → Strong resistance zone
1,900 – 1,920 → Major resistance; breakout above this can fuel strong upside momentum
⚖️ Daily Trend Outlook
Kotak Bank is currently in a sideways to mildly bullish phase on the daily chart.
Price is consolidating between 1,730 support and 1,800 resistance.
A breakout above 1,800 – 1,850 could trigger a rally towards 1,900+.
A breakdown below 1,730 may drag the stock toward 1,700 – 1,640.

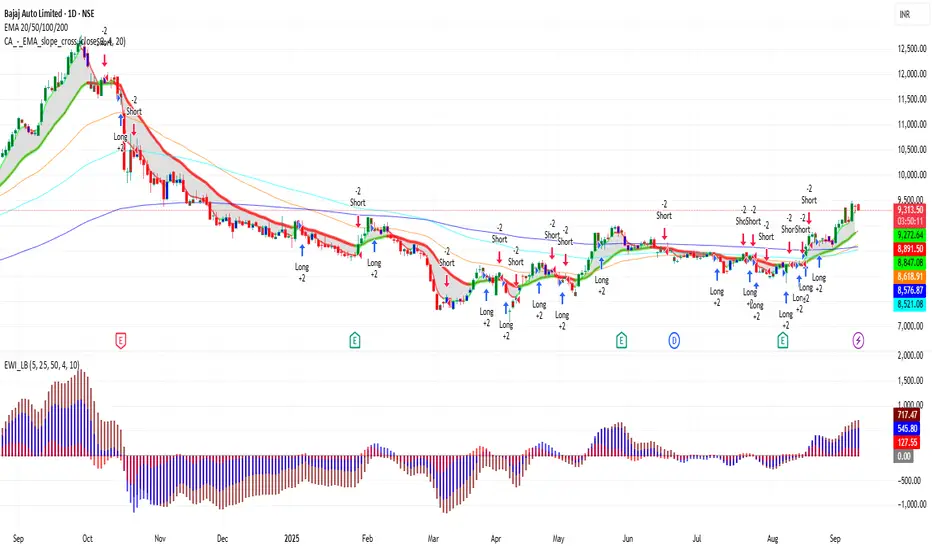
BAJAJ_AUTO 1D Time frame📍 BAJAJ_AUTO – 1D Important Levels (Current)
🔹 Support Zones
9,050 – 9,100 → Immediate daily support
8,800 – 8,900 → Strong support; buyers likely to defend this zone
8,500 – 8,600 → Major support; breakdown here may shift trend bearish
🔹 Resistance Zones
9,300 – 9,400 → Immediate daily resistance
9,550 – 9,650 → Strong resistance zone; breakout may extend upside momentum
9,800 – 10,000 → Major psychological resistance; if crossed, bullish trend strengthens further
⚖️ Daily Trend Outlook
Bajaj Auto is in a bullish structure on the daily chart, forming higher lows.
As long as price stays above 9,050, the stock remains positive.
A breakout above 9,400 – 9,650 can take it towards 9,800 – 10,000.
A breakdown below 9,050 could drag it towards 8,900 – 8,600.
XAUUSD 1H📍 XAUUSD – 1H Key Levels
🔹 Support Zones
$1925 – $1927 → Immediate intraday support
$1918 – $1920 → Stronger short-term support
$1910 – $1912 → Major support zone, breakdown could trigger deeper fall
🔹 Resistance Zones
$1935 – $1937 → First intraday resistance
$1945 – $1947 → Strong resistance area where sellers may re-enter
$1955 – $1960 → Major resistance; breakout above this can fuel a larger rally
⚖️ Quick Summary
Above $1935, bulls may push toward $1945 – $1960.
Below $1920, bears could drag price back to $1910 – $1900.
Range to monitor: $1920 – $1935 (decisive breakout will set next trend).
XAUUSD (Gold) – 1H Chart Analysis
🔹 Trend Overview
On the 1-hour chart, XAUUSD is currently showing short-term bullish bias but with nearby resistance.
Price action is making higher lows, but upside moves are facing supply zones.
🔹 Key Levels to Watch
Immediate Support Zone: $1918 – $1922
Major Support: $1910 – $1912
Immediate Resistance Zone: $1935 – $1940
Stronger Resistance: $1950
🔹 Indicators (1H Chart)
Moving Averages → Price trading above 20 EMA and near 50 EMA, showing short-term strength.
RSI (Relative Strength Index) → Around 60–65, leaning bullish but not overbought.
MACD → Positive crossover, momentum favoring buyers.
Volume → Buying volume spikes at dips, showing accumulation.
🔹 Intraday Trading Scenarios
Bullish Case
If price sustains above $1935, upside can extend to $1945 – $1950.
Breakout above $1950 opens path toward $1960+.
Bearish Case
If price drops below $1922, retracement towards $1912 – $1910 is possible.
Strong breakdown below $1910 may test $1900.
🔹 Summary
Bias: Mildly Bullish (as long as above $1920 support)
Support Levels: $1922 / $1910
Resistance Levels: $1935 / $1950
Traders should watch the $1920 – $1935 zone for the next decisive move.

NIFTY1!📍 NIFTY1! – 1H Key Levels
🔹 Support Zones
22,450 – 22,500 → Immediate intraday support
22,350 – 22,400 → Stronger support, buyers likely active here
22,200 – 22,250 → Major support zone, breakdown can invite selling pressure
🔹 Resistance Zones
22,650 – 22,700 → Immediate resistance on 1H chart
22,800 – 22,850 → Strong resistance area, breakout may fuel rally
23,000 → Psychological and major resistance zone
⚖️ Quick Summary
Above 22,700, momentum may push Nifty Futures towards 22,850 – 23,000.
Below 22,450, weakness could drag price back to 22,350 – 22,200.
Current 1H trend bias is mildly bullish, but range-bound moves are possible between 22,450 – 22,700 before a breakout.
BTCUSD📍 BTCUSD – 1H Key Levels
🔹 Support Zones
$55,200 – $55,500 → Immediate intraday support
$54,500 – $54,800 → Strong support zone, buyers likely to defend here
$53,800 – $54,000 → Major support, breakdown here could trigger deeper correction
🔹 Resistance Zones
$56,800 – $57,000 → Immediate 1H resistance
$57,800 – $58,200 → Strong resistance, breakout can fuel further upside
$59,000 – $59,500 → Major resistance, likely to act as a supply zone
⚖️ Quick Summary
As long as BTCUSD trades above $55,500, short-term bias remains bullish.
Breakout above $57,000 may push price towards $58,200 – $59,500.
Breakdown below $54,800 may drag price back towards $54,000 – $53,800.
Current 1H bias: Range-bound to bullish, waiting for a breakout from $55,500 – $57,000 zone.
