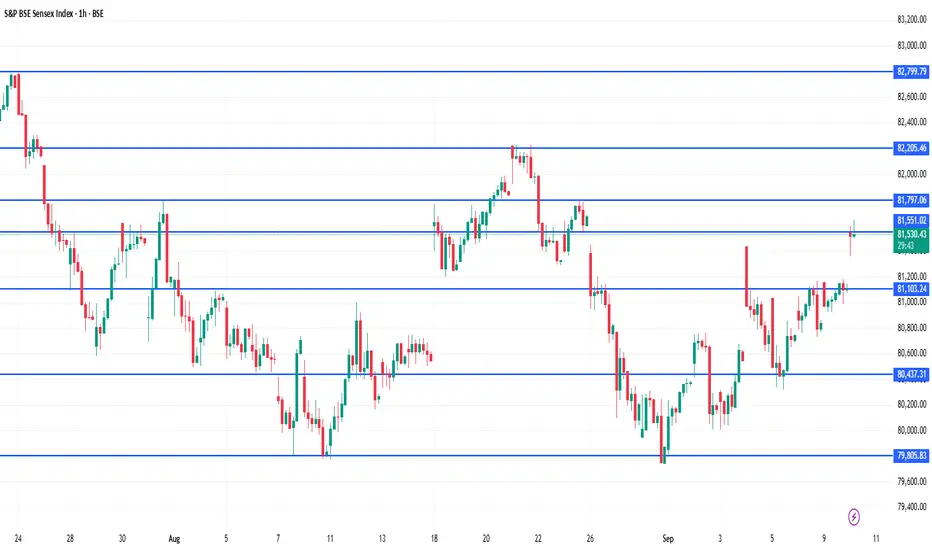
SENSEX 1hour Time frame📍 Sensex – 1H Important Levels (Current)
🔹 Support Zones
74,200 – 74,300 → Immediate intraday support
73,800 – 73,900 → Stronger support zone
73,400 – 73,500 → Major support, breakdown may trigger further downside
🔹 Resistance Zones
74,800 – 74,900 → Immediate 1H resistance
75,200 – 75,300 → Strong resistance; breakout can fuel upside momentum
75,600 – 75,800 → Major resistance; sellers likely to appear here
⚖️ Quick Summary
Bias: Mildly bullish as long as Sensex trades above 74,200.
A breakout above 74,900 may target 75,200 – 75,800.
A breakdown below 73,800 may drag it towards 73,400.
Current range to monitor: 74,200 – 74,900.
Swingtrading
USDJPY 1H📍 USDJPY – 1H
🔹 Support Zones
147.80 – 148.00 → Immediate intraday support
147.30 – 147.50 → Strong support; buyers likely active
146.80 – 147.00 → Major support; breakdown here may extend bearish momentum
🔹 Resistance Zones
148.50 – 148.70 → Immediate intraday resistance
149.00 – 149.20 → Strong resistance; breakout can trigger further rally
149.70 – 150.00 → Major psychological resistance
⚖️ Quick Summary
Bias: Currently range-bound with a bullish tilt as long as price stays above 147.80.
Breakout above 148.70 may open the way towards 149.20 – 150.00.
Breakdown below 147.80 may drag price back to 147.30 – 147.00.
Current watch zone: 147.80 – 148.70.

NIFTY 1H Important Levels 📍 NIFTY – 1H Important Levels
🔹 Support Zones
22,350 – 22,400 → Immediate intraday support
22,200 – 22,250 → Strong support zone
22,000 – 22,050 → Major support; breakdown here may trigger deeper selling
🔹 Resistance Zones
22,600 – 22,650 → Immediate resistance on 1H chart
22,800 – 22,850 → Strong resistance; breakout can push momentum higher
23,000 → Major psychological resistance
⚖️ Quick Summary
Bias: Mildly bullish as long as Nifty trades above 22,350.
Breakout above 22,650 may extend the rally towards 22,850 – 23,000.
Breakdown below 22,350 may drag it towards 22,200 – 22,000.
Current watch zone: 22,350 – 22,650.

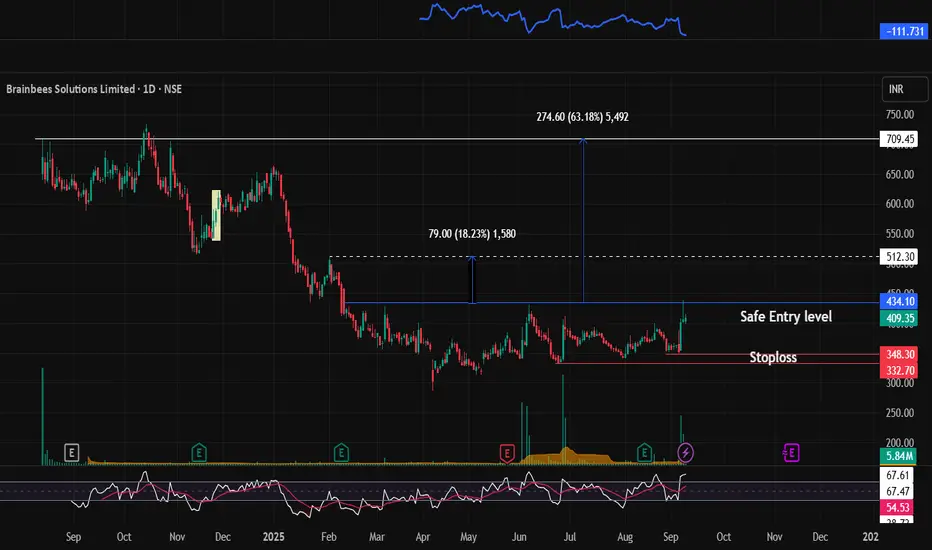
FIRSTCRY (Breakout Candidate) - Swing Pick#FIRSTCRY #stage1stock #breakoutstock #Trendingstock
FIRSTCRY : Swing / Short term (1-3 months)
>> Ready for Stage 1 breakout
>> Momentum stock
>> Volumes Spike Visible
>> Good strength in stock
>> Swing Traders can target 18% move, short term traders can look for Higher Targets
Swing Traders can lock profit at 10% and keep Trailing
Please Boost, comment and follow us for more Learnings
Disc : Charts shared are for learning purpose only, not a Trade recommendation. Do your own research and consult your financial advisor before taking any position.
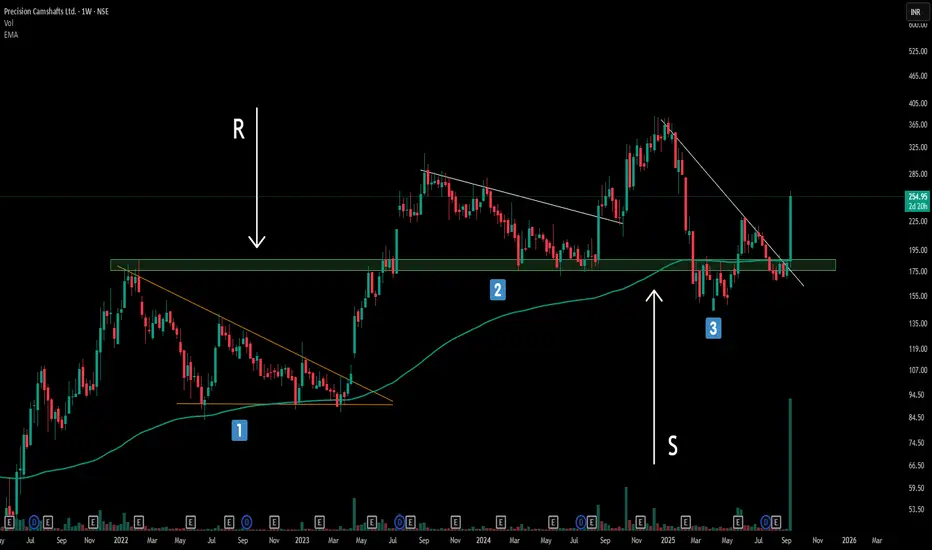
The Power of Trendline Angles : My Full time trading ExperienceBreaking Down Three Critical Trendline Structures - A Complete Analysis
Structure 1: The Power of Steep Angles (Primary Focus)
The first structure showcases what I consider the gold standard of trendline breakouts. Notice how the trendline is significantly tilted/slanted rather than following a gradual 45-degree angle.
Compressed Energy Release: Steep trendlines act like coiled springs, storing tremendous buying/selling pressure that explodes upon breakout
Key Observation: The resistance level (marked as 'R') held price down multiple times before the decisive breakout. Once broken, this level immediately flipped to become strong support (marked as 'S')—a textbook example of polarity flip dynamics.
Structure 2 & 3: Valid but Secondary Setups
While structures 2 and 3 represent legitimate continuation-based trendline breakouts, they pale in comparison to the explosive potential of Structure 1. However, they still qualify as CT (Continuation Trend) based breakout structures and shouldn't be ignored entirely
Remember: Not every trendline break deserves your attention. Focus on steep angles, exceptional volume, and clear flip confirmations for the highest probability setups. The market rewards patience and precision over frequency.
Disclaimer: Trading involves significant risk and is not suitable for all investors. Past performance does not guarantee future results. Always conduct your own research, consider seeking advice from a qualified financial advisor, and trade only with capital you can afford to lose.
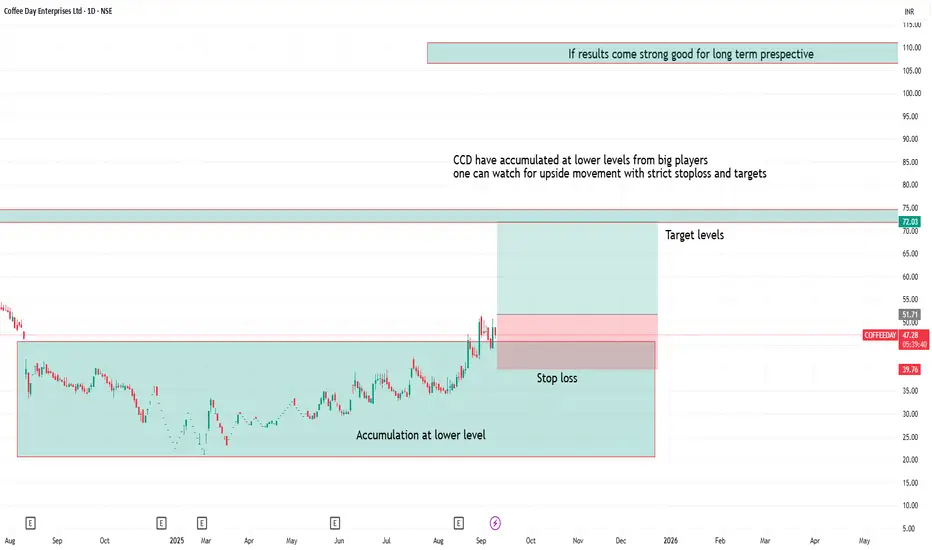
CCD showing accumulation 1. CCD is showing accumulation at lower levels with big players
2. If result comes strong then stock can give good returns in long term
3. one can observe for upside movement with strict stoploss and targets
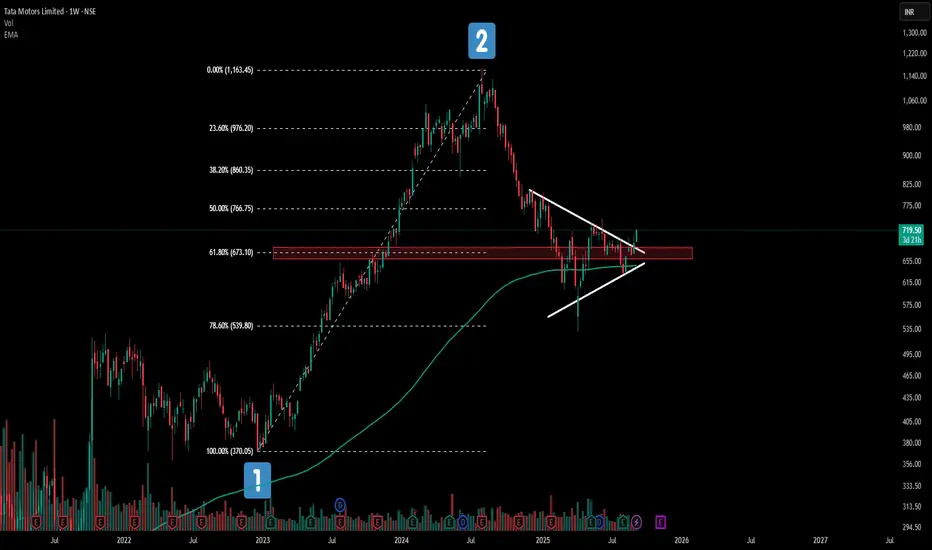
This Tata Motors Pattern Could Change Everything!Tata Motors weekly chart is painting a fascinating picture right now!
📊 Price action is dancing around the 61.8% Fibonacci retracement - a golden ratio traders love to watch.
🎯What makes this even more intriguing? The 200 EMA is playing perfect host to this consolidation party
✨While a symmetrical triangle pattern quietly takes shape. It's like watching three technical forces align in one.
Keeping it simple .
⚠️ This analysis is for educational purposes only and should not be considered as financial advice. Trading and investing in stocks involves substantial risk of loss. Please conduct your own research and consult with a qualified financial advisor before making any investment decisions
D-Link India: Riding the 5G & Digital India Wave NSE:DLINKINDIA
📊 D-Link (India) Ltd – Technical & Fundamental Analysis
🔹 Technical Analysis
Trend Structure
Stock rallied from ~₹360 to ~₹590 and is currently in a corrective phase.
Presently trading around ₹476.55.
Fibonacci Retracement
Price is hovering near the 0.5 Fibonacci retracement (₹473.85).
Next key retracement support: 0.618 level (₹446.55).
Indicates the stock is at a critical support zone after a healthy pullback.
Volume Action
The correction is happening on low volumes (dry pullback).
Suggests lack of strong selling conviction.
Support & Resistance Levels
Support: ₹470 (Fib 0.5) and ₹446 (Fib 0.618).
Resistance: ₹520 (recent swing high) and ₹590 (previous top).
Technical View
Current price action reflects consolidation after a rally.
Sustainability above 470–446 zone will be important for future direction.
====================================
====================================
🔹 Fundamental Analysis
Business Overview
Subsidiary of D-Link Corporation, Taiwan.
Operates in networking solutions: routers, switches, Wi-Fi systems, surveillance equipment.
Serves consumer, SME, and enterprise markets.
Financial Position
Revenue: Stable growth supported by IT demand.
Margins: Moderate (~6–8%) but consistent.
Balance Sheet: Debt-free and cash-rich.
Returns: ROE/ROCE in the range of ~15–20%.
Industry Drivers
5G rollout in India → boosts demand for networking gear.
Digital India & Smart Cities projects → infrastructure demand.
Work-from-home & hybrid culture → sustained Wi-Fi/router demand.
Enterprise IT upgrades → strong B2B demand.
Strengths
Global brand recognition.
Expanding market presence in India.
Strong cash reserves, no debt.
Risks
Intense competition (TP-Link, Cisco, Netgear).
Import dependency → currency fluctuations affect costs.
Technology cycles → rapid product obsolescence.
🔹 Future Growth Prospects
5G & Fiberization: Rising network infrastructure requirements.
IoT & Smart Homes: Increasing adoption of connected devices and Wi-Fi mesh solutions.
Government Push: Smart City & Digital India initiatives driving demand for surveillance and enterprise networks.
Enterprise Growth: SMEs and corporates upgrading IT networks post-pandemic.
🔹 Investor-Friendly Summary
Technically: Stock is undergoing a healthy pullback at a critical Fibonacci zone (0.5–0.618). Low volume suggests limited aggressive selling.
Fundamentally: Strong brand, debt-free, positioned to benefit from digital infrastructure growth. Risks include competition and currency fluctuations.
Future Outlook: Demand from 5G, IoT, and government projects offers long-term industry tailwinds.
============================
============================
⚠️ Disclaimer:
This analysis is for educational and informational purposes only.
We are not SEBI-registered analysts or advisors.
This is our personal view based on available data and market trends.
Please consult your SEBI-registered investment advisor before making any investment or trading decisions.
You are solely responsible for any financial decisions you make based on this content.
========================
Trade Secrets By Pratik
========================

How to Talk to Charts & Paint Price Action | TradingView IndiaStop treating charts like raw data. In this TradingView India tutorial, learn how to talk to charts by drawing levels, zones, and patterns on a blank canvas—transforming price into actionable art. Perfect for beginners and pros looking to visualize market structure and make smarter trades

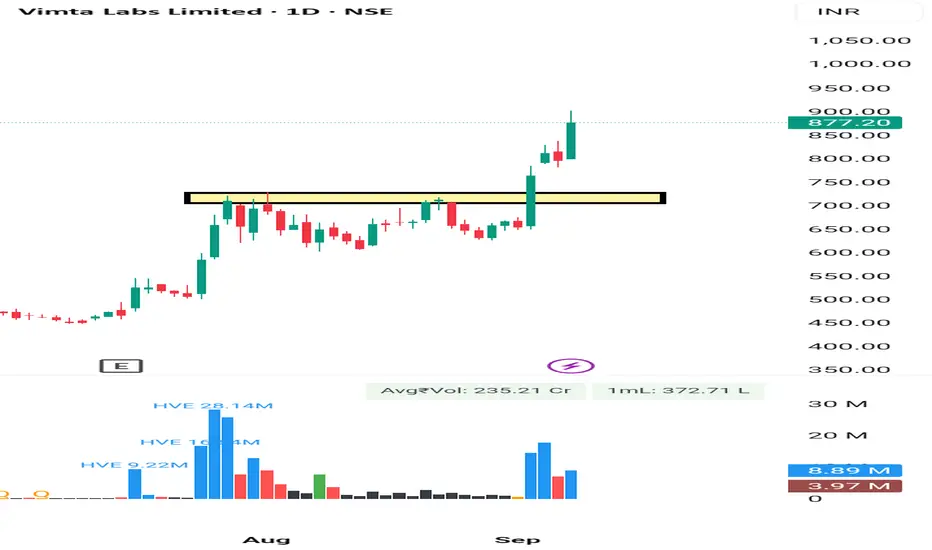
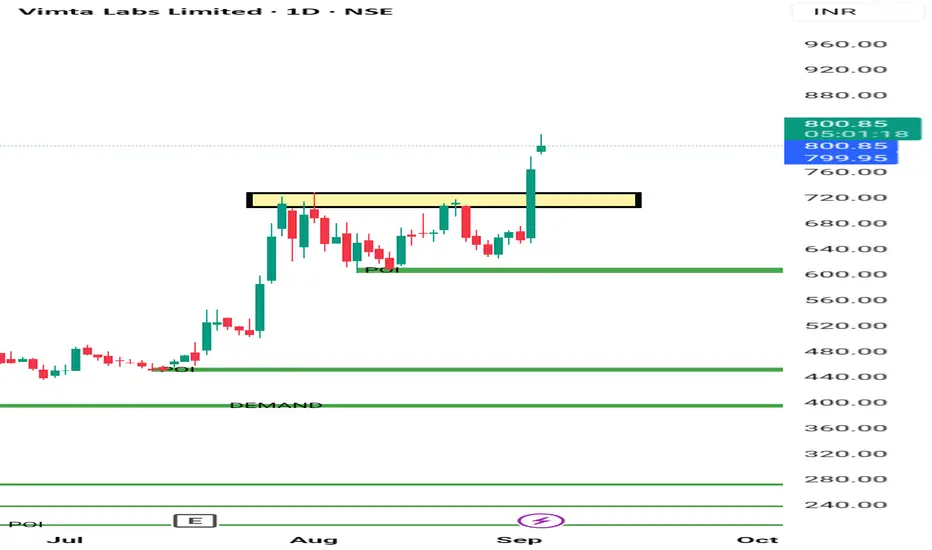
Vimta Lab Rounding Pattern Breakout Vimta Lab given Rounding Pattern Breakout on 1 Day as well as on 1 Week . It's a good movement after a good consolidation phase of 1 Month Approx . It may move 10 -15% Easily .
Entry Was Near 730
SL 5%
Tgt - Trial Basis . No body knows . Kitna Up jayega. So. Trail SL.
Consult your financial advisor before making any position in stock market.
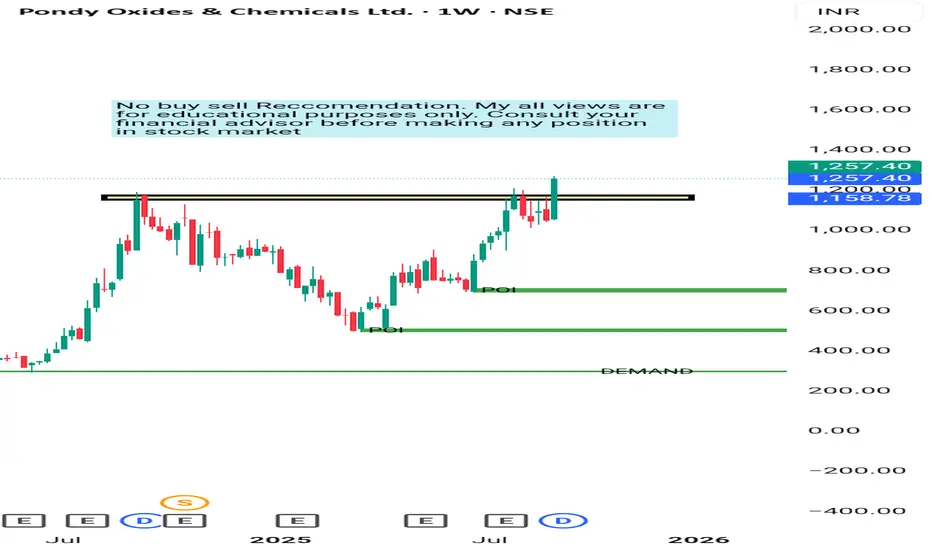
POCL Weekly BREAKOUT For More information Visit my Tradingview Profile .
POCL Given a Rounding Bottom Pattern Breakout on weekly as well as on 1 day chart with good volumes . Company belongs to metal sector and metal sector in uptrend. So we can see 5 -10% good movement from here also in swing trading/holding for some days . 10 - 30 days . Keep Stoploss 5 -6% .
Incorporated in 1995, Pondy Oxides and Chemicals Ltd manufactures Lead Metal and Alloys and other Non-ferrous metals
Key Points
Business Overview:
POCL is in the metallic and non-metallic recycling industry as India’s largest secondary Lead manufacturer in Lead Alloys. Its core product, lead and lead alloys, is mainly used in making lead-acid batteries. Company converts scraps of various forms of Lead, Aluminium, and Copper into Lead Metal, Aluminium Metal, Copper, and its Alloys. It carries out smelting of Lead Battery scrap to produce secondary lead metal, which is further transformed into Pure lead and Specific Lead Alloys. Further, company also manufactures Zinc metal and Zinc Oxide.
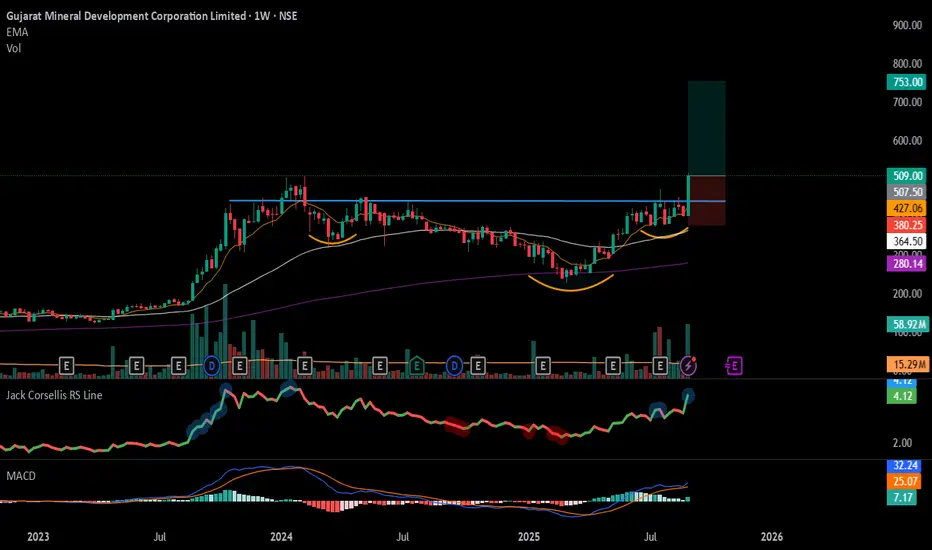
#GMDCLTD - Inverse H&S Breakout in Weekly Time Frame Script: GMDCLTD
Key highlights: 💡⚡
📈 Inverse Head & Shoulders Breakout in Weekly Time Frame
📈 Volume spike during Breakout
📈 MACD Bounce
📈 Can go for a swing trade
BUY ONLY ABOVE 507 DCB
⏱️ C.M.P 📑💰- 509
🟢 Target 🎯🏆 – 50%
⚠️ Stoploss ☠️🚫 – 25%
⚠️ Important: Market conditions are Okish, Position size 50% per Trade. Protect Capital Always
⚠️ Important: Always Exit the trade before any Event.
⚠️ Important: Always maintain your Risk:Reward Ratio as 1:2, with this RR, you only need a 33% win rate to Breakeven.
✅Like and follow to never miss a new idea!✅
Disclaimer: I am not SEBI Registered Advisor. My posts are purely for training and educational purposes.
Eat🍜 Sleep😴 TradingView📈 Repeat 🔁
Happy learning with MMT. Cheers!🥂
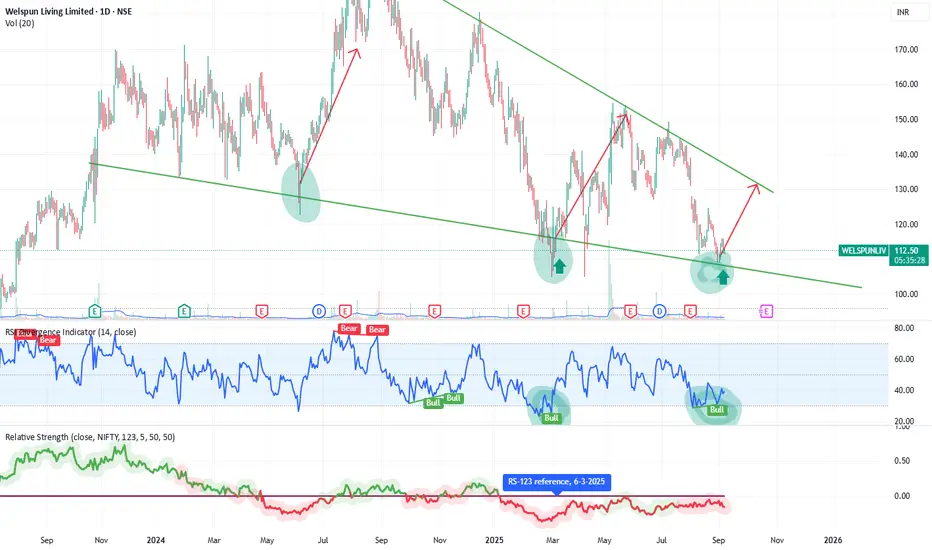
Welspun Living – Bullish Reversal | Swing Trade SetupWelspun Living (NSE: WELSPUNLIV) is showing a potential bullish reversal after bouncing off a long-term descending trendline support. This level has previously triggered strong upward swings.
The chart also shows a bullish RSI divergence, indicating waning selling momentum. A breakout above immediate resistance (~₹115–₹117) could lead to a swing move towards ₹125–₹130.
Key support lies at ₹105. Watch for volume confirmation and RSI strength for entry validation. 📈
Please note : This chart reflects my analysis only—not a trading recommendation. Always conduct your own research before acting and consider your risk tolerance. You’re responsible for your own investment decisions.
SAGAR CEMENT BULLISH CHART DON'T HAVE TIME TO MANAGE YOUR TRADES?
Sagar Cement given good breakout. Its given breakout after good consolidation. It's given breakout after rounding pattern . We can see 5 -6% Upmove easily.
Take BTST trades at 3:25 pm every day
Try to exit by taking 4-7% profit of each trade
SL can also be maintained as closing below the low of the breakout candle
Now, why do I prefer BTST over swing trades? The primary reason is that I have observed that 90% of the stocks give most of the movement in just 1-2 days and the rest of the time they either consolidate or fall
Trendline Breakout in SAGCEM
BUY TODAY SELL TOMORROW for 5%

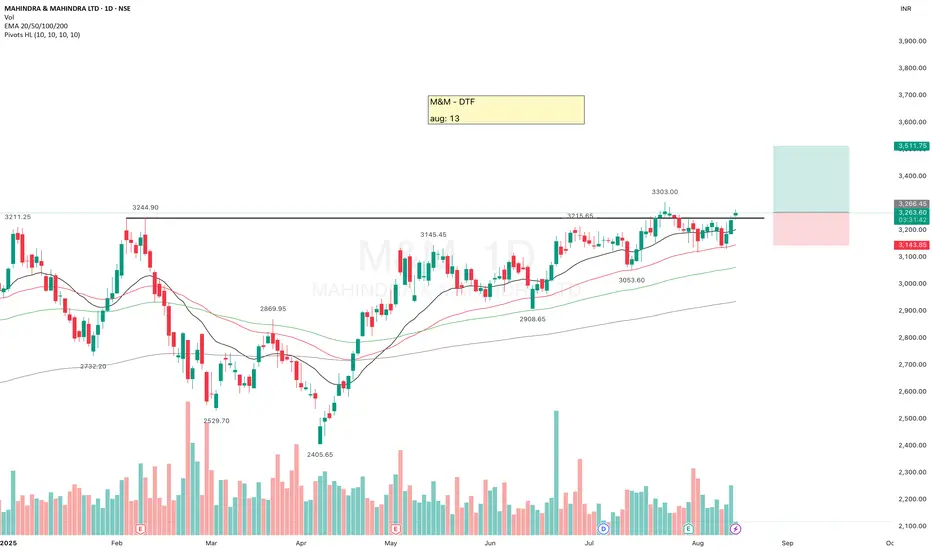
M&M (Mahindra & Mahindra)It's been a while since M&M is testing this resistance.
Looking strong, moving above key EMAs, good volume, continuously contracting near the resistance. If it sustains this level then it may give a good upside move.
Keep eyes on it.
Must use SL, it always safeguard your Capital.
✅ If you like my analysis, please follow me as a token of appreciation :)
in.tradingview.com/u/SatpalS/
📌 For learning and educational purposes only, not a recommendation. Please consult your financial advisor before investing.
Tata Steel Price Action Secrets |Backtesting Breakouts & SupportIn this video, I break down Tata Steel’s historical price action to understand its trading behavior. By backtesting past levels, we identify whether the stock respects support zones or follows breakout structures more reliably. This step-by-step analysis shows how to build your own tested data, spot recurring patterns, and improve decision-making in real trades.

Vimta High Momentum & Breakout Stock As we can see in chart Vimta Lab is Bullish In Last some weeks . Its given clear breakout. It's moving in a parttern . It can move 5 -10% very fast In upcoming days. Keep SL near breakout levels near 710.
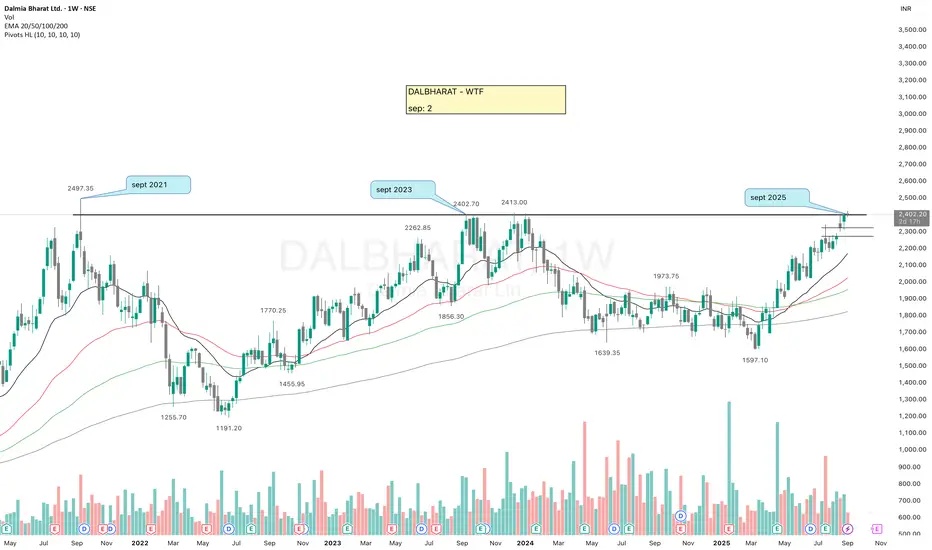
DALBHARAT - At 4yrs old Resistance LevelTechnical Analysis
DALBHARAT is currently at a strong 4-year-old resistance level, which it has interestingly tested three times in the month of September.
After forming a swing low near 1597 in early March, the stock turned bullish and established a HH-HL structure. Ideally, for a clean breakout, some consolidation near this level would strengthen the move. The overall structure remains bullish, and a decisive breakout here could trigger a strong upside rally.
Fundamental Analysis
PE Ratio: 48 – on the higher side, but broadly in line with the industry.
ROCE: 5.58% and ROE: 4.15% – both relatively weak.
Promoter Holding: Strong at 55.8%.
Pledged Shares: 0% – a positive sign.
✅ If you like my analysis, please follow me as a token of appreciation :)
in.tradingview.com/u/SatpalS/
📌 For learning and educational purposes only, not a recommendation. Please consult your financial advisor before investing.
Garuda Construction – Cup & Handle Breakout | Swing Trade PlanGaruda Construction has given a textbook Cup & Handle breakout backed by strong volume and solid fundamentals.
Technical Analysis
A Cup & Handle pattern has formed with a neckline breakout above ₹200.
Stock closed strongly at ₹216.33 (+9.66%) with massive volume (7.5M vs 3.1M avg) - confirms institutional buying.
Price is trading above 20 EMA (₹200) and 50 EMA (₹188) → strong uptrend.
Weekly timeframe also shows a fresh breakout, adding higher timeframe confluence.
Structure remains bullish as long as it holds above ₹200 demand zone.
Fundamental key area
Construction & Engineering segment seeing strong order inflows, aiding medium-term growth. Strong QoQ Growth: Latest quarter (Jun-25) revenue jumped 55% to ₹125 Cr.
ROE ~29%, OPM ~29% → excellent efficiency.
Balance Sheet: Debt levels appear very low, improving stability.
Valuation: Mid-cap with growth momentum, attractive vs large-cap peers.
Swing Trade Plan
Entry Zone: ₹212–216
Stop Loss: ₹198 (below neckline + demand zone)
Targets:
T1: ₹225 (early booking)
T2: ₹240 (swing continuation)
T3: ₹260 (Cup & Handle measured move)
Risk–Reward: Up to 1:2.4
Note: This is an educational swing trade analysis based on price action + fundamentals. Not financial advice — do your own due diligence before trading.

DALBHARAT (DALMIA BHARAT)DALBHARAT has been making HH-HL formation.
There is probability of an upside move to touch the previous resistance near 2390.
Everyone: There is news about 25% tariff from Trump therefore strictly follow risk management to safeguard your capital.
✅ If you like my analysis, please follow me as a token of appreciation :)
in.tradingview.com/u/SatpalS/
📌 For learning and educational purposes only, not a recommendation. Please consult your financial advisor before investing.

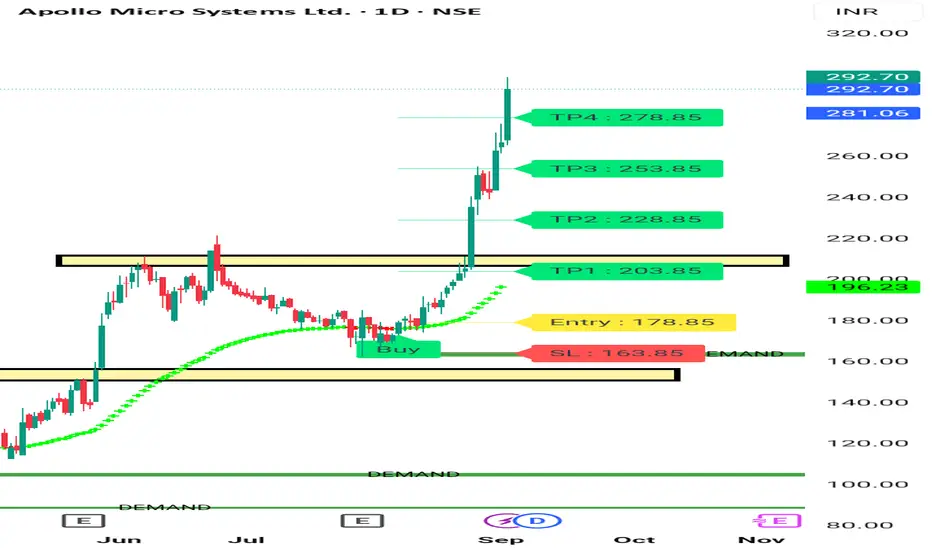
Apollo Micro Systems Movement APOLLO micro system given breakout near 210 .and I Shared The chart some days back also .now it's time to be cautious in this stock . No new entry . It's already given good returns. So no fucus on Some Other stock . Those Bought on lower levels they can trial SL.
Stock still can move upward but risk reward not good to enter now. Wait for retracement for 250 price .
No buy sell Reccomendation. Consult your financial advisor before making any position in stock. My views are for educational purposes only.
Swing Trading in IndiaIntroduction
Trading in financial markets can take several forms – from ultra-fast intraday scalping to long-term investing. Somewhere in the middle lies swing trading, a popular strategy used by thousands of Indian traders. Swing trading involves holding positions for a few days to a few weeks, aiming to capture “swings” or price movements within a trend.
In India, swing trading has gained momentum because of:
Rapid growth in retail participation.
Increased availability of market data and technical tools.
Expanding knowledge of trading strategies via online platforms.
For traders who cannot monitor markets minute-by-minute but still want more active involvement than long-term investing, swing trading offers the perfect balance.
This guide will explore the concept, strategies, tools, psychology, regulations, and practical approach to swing trading in India, so you can decide whether it’s the right path for you.
Chapter 1: What is Swing Trading?
Swing trading is a medium-term trading style where traders aim to capture price “swings” within an ongoing trend. Unlike day traders, swing traders don’t close positions within a single session. Unlike long-term investors, they don’t hold for months or years.
Key traits of swing trading:
Holding period: 2 days to 3 weeks (sometimes longer).
Tools: Technical analysis + fundamental triggers.
Objective: Capture 5–20% moves within trends.
Market segments: Stocks, indices, commodities, and even forex (via INR pairs).
Example:
Suppose Reliance Industries is trading at ₹2,500. A swing trader identifies a bullish breakout pattern with potential upside to ₹2,750 over the next two weeks. They buy at ₹2,500 and exit around ₹2,720–2,750, capturing a swing of ₹220–250 per share.
Chapter 2: Swing Trading in the Indian Context
The Indian stock market is unique compared to Western counterparts. Swing traders here face:
Volatility: Indian markets, especially midcaps and smallcaps, are prone to sharp moves – great for swing traders.
Liquidity: Nifty 50 and large-cap stocks offer ample liquidity, reducing slippage.
Sectoral rotation: Money frequently shifts between IT, banking, FMCG, auto, and PSU sectors – providing swing opportunities.
Regulations: SEBI monitors derivatives trading, margin requirements, and insider trading laws. Swing traders need to stay compliant.
In India, swing trading is particularly popular in:
Cash market (equity delivery): Traders hold stocks for days/weeks.
F&O segment: Traders use futures for leverage or options for directional bets.
Commodity markets (MCX): Gold, silver, crude oil are swing-trading favorites.
Chapter 3: Why Swing Trading Appeals to Indians
Less stress than intraday: No need to stare at screens all day.
Higher returns than investing: Captures shorter-term volatility.
Works for part-time traders: Office-goers and students can swing trade with end-of-day analysis.
Multiple strategies possible: From trend-following to reversal trading.
Leverage with control: Futures and options allow amplified gains (though also higher risks).
Chapter 4: Tools & Indicators for Swing Trading in India
1. Chart Types:
Candlestick charts (most popular).
Line or bar charts for trend clarity.
2. Timeframes:
Swing traders often analyze:
Daily charts → primary decision-making.
Weekly charts → trend confirmation.
Hourly charts → fine-tune entries/exits.
3. Popular Indicators:
Moving Averages (20, 50, 200 DMA): Identify trend direction.
Relative Strength Index (RSI): Overbought/oversold levels.
MACD: Trend momentum and crossover signals.
Bollinger Bands: Volatility breakouts.
Volume Profile: Strength of price levels.
4. Support & Resistance:
Key price levels form the backbone of swing trading strategies.
Chapter 5: Swing Trading Strategies for Indian Markets
1. Trend Following Strategy
Buy in uptrend pullbacks; sell in downtrend rallies.
Example: Nifty uptrend → enter on retracement to 20-DMA.
2. Breakout Trading
Identify stocks consolidating in a range.
Buy when price breaks resistance with volume.
Example: HDFC Bank breaking ₹1,700 after long consolidation.
3. Reversal Trading
Catch turning points using RSI divergence or candlestick patterns.
Example: Bullish hammer at support in Infosys after a downtrend.
4. Sector Rotation Strategy
Track money flow between sectors (e.g., IT rally ending, auto sector heating up).
Buy leading stocks in the next favored sector.
5. Swing Trading with Options
Use call options for bullish swings.
Use put options for bearish swings.
Advantage: Limited risk, high reward potential.
Chapter 6: Risk Management in Swing Trading
Risk management separates professionals from gamblers.
Position Sizing: Never risk more than 1–2% of capital per trade.
Stop Losses: Always define exit levels. Example: Buy at ₹1,000 → SL ₹950.
Risk-to-Reward Ratio: Target minimum 1:2 or better.
Diversification: Avoid overexposure to a single stock or sector.
Avoid Overnight Leverage in F&O: Gap-ups or gap-downs can destroy capital.
Chapter 7: Psychology of Swing Trading
Trading is 70% psychology, 30% strategy.
Patience: Wait for setups; don’t force trades.
Discipline: Stick to stop-losses and profit targets.
Detachment: Don’t fall in love with stocks.
Consistency: Small, steady profits beat big, inconsistent wins.
Chapter 8: Regulatory & Tax Considerations in India
SEBI Regulations: Ensure you’re compliant with margin rules and leverage restrictions.
Brokerage Charges: Delivery, intraday, and F&O charges vary. Choose wisely.
Taxation:
Profits from swing trading are considered short-term capital gains (STCG) → taxed at 15%.
If classified as business income (frequent trading), normal slab rates may apply.
Keep detailed records for filing.
Chapter 9: Swing Trading Example in India
Imagine you spot Tata Motors consolidating between ₹850–₹880 for two weeks. A breakout above ₹880 with heavy volume suggests bullish momentum.
Entry: Buy at ₹885.
Stop Loss: ₹850 (support).
Target: ₹950 (next resistance).
Holding Period: 7–12 trading days.
Outcome: If target achieved, you gain ₹65/share. With 200 shares, profit = ₹13,000.
Chapter 10: Common Mistakes Indian Swing Traders Make
Chasing stocks after news-driven rallies.
Ignoring broader market trends (Nifty/Sensex direction).
Overusing leverage in F&O.
Constantly shifting strategies.
Emotional decision-making during volatility.
Conclusion
Swing trading in India offers an exciting middle ground between long-term investing and high-stress intraday trading. With the right blend of technical knowledge, discipline, risk management, and patience, swing traders can consistently extract profits from the market.
But remember: swing trading is not gambling. It’s about planning trades, managing risks, and letting the market do its job. Success doesn’t come overnight – but with dedication, Indian traders can thrive in this style.
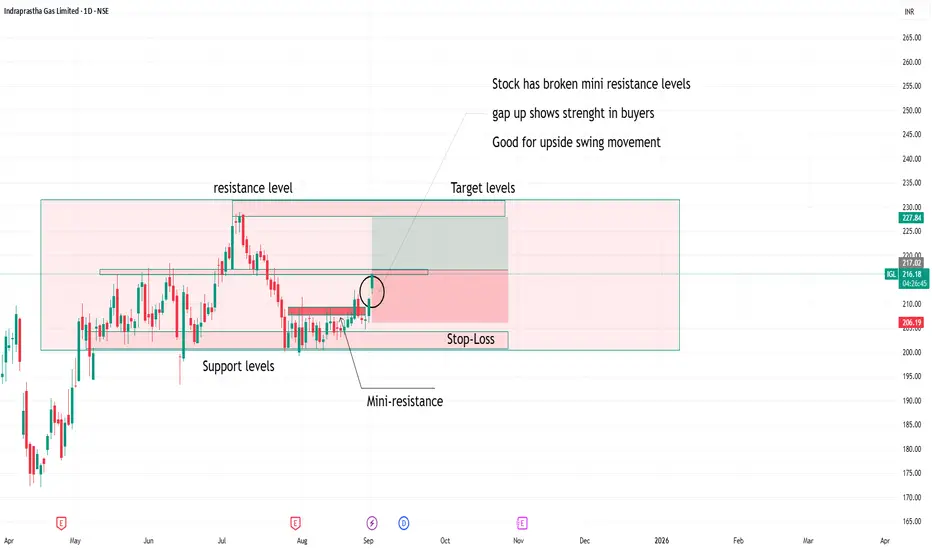
Igl good for upside swing movementstock has broken mini resistance levels
gapup shows strength
with strict stoploss and targets one can watch or observe this stock for upside