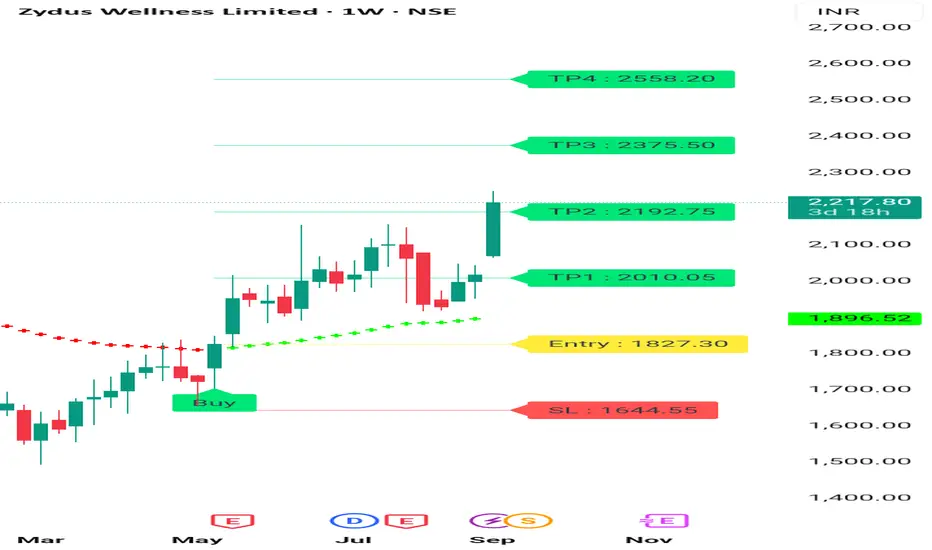
ZYDUS Wellness Weekly Chart Zydus wellness Given Good movement on Acquisition. Zydus wellness Given Weekly breakout, it's forming Rounding Pattern . Next tgt may be 2450 + 2500 in next 3 -6 months. Consult your financial advisor before making any position in this stock .
Swingtrading
DRREDDYDRREDDY - The stock is showing strength as it trades above all the key EMAs, indicating bullish momentum. A clear volume pickup is visible, adding confirmation to the move.
After a healthy retracement, price has broken above the immediate resistance zone. If it sustains this breakout, there’s a strong probability of an extended upside move.
The last hammer candle took solid support at the 200 EMA, which often acts as a major trend indicator, this bounce further validates the underlying strength.
Defining stop-loss and position sizing is crucial to manage downside risk, even in strong setups.
✅ If you like my analysis, please follow me as a token of appreciation :)
in.tradingview.com/u/SatpalS/
📌 For learning and educational purposes only, not a recommendation. Please consult your financial advisor before investing.

Dixon Inverted HnSDixon Technologies is making a inverted Head n shoulder in the daily timeframe.
One can look for taking an entry at the retest of 17300-17320. Support can be considered at todays low. Keep a Check on the Chart and you will get to see how a head n shoulder is made.
Usually the Support for a HnS is right shoulder low so mid term traders can consider that level.
Follow for such more Analysis.
Jai Shree Ram.

Uptrend in OLA. broken resitance1.) Resistance has broken with huge buying volume
Good for swing upward move
2.)Follow strict stop loss with targets
3.) technically good if fundamentals get strong then good for long term with 130 to 140 levels.

Paradeep HIGH MOMENTUM STOCKParadeep is in consolidation phase with low volume . its a high momentum stock . it may give breakout in coming days . so keep tracking it. ADD it in ur watchlist

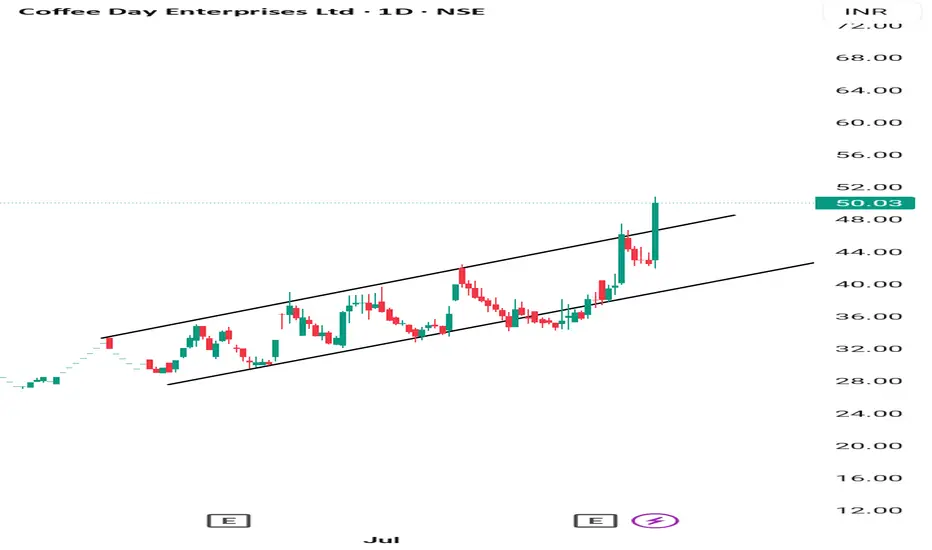
COFFEE DAY 1 DAY CHANNEL BREAKOUT Coffee Day Given Channel Breakout on 1 Day Chart . Coffee prices also increasing World wide bcoz of moonson. It's a good bet for next 10% 15%
MASTEKMASTEK has successfully re-tested its breakout zone and posted a strong bullish candle, closing firmly above the 2566 resistance level.
Price action shows tight consolidation near the swing-high supply zone with a series of higher-lows, reflecting strong accumulation.
Volume had been drying up till now; today’s green candle came with noticeable volume, strengthening the breakout conviction.
The stock is sustaining above all key EMAs, further reinforcing bullish momentum.
A decisive follow-through above 2600 could open room for the next leg higher.
Keep it on your watchlist and prepare your paper trade plans.
✅ If you like my analysis, please follow me as a token of appreciation :)
in.tradingview.com/u/SatpalS/
📌 For learning and educational purposes only, not a recommendation. Please consult your financial advisor before investing.

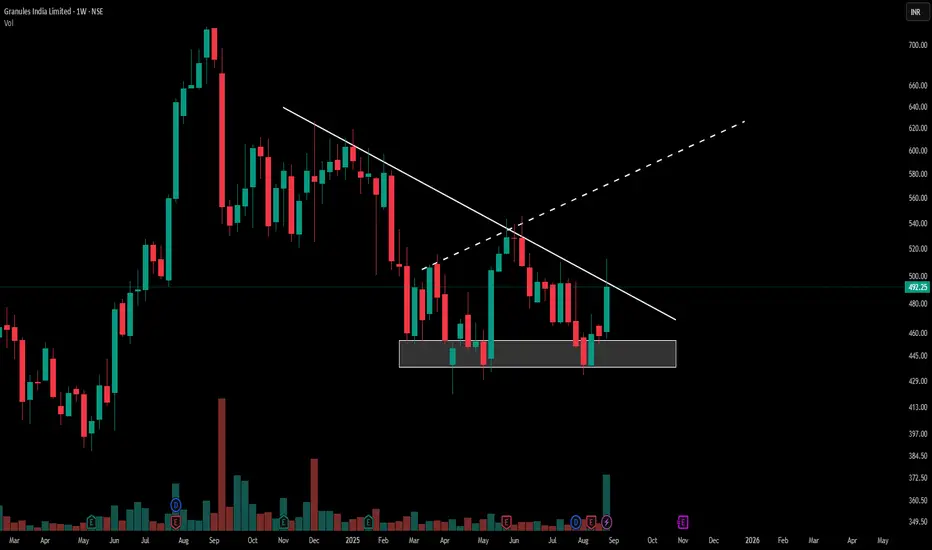
Granules India: Critical Descending TriangleGranules India Limited presents a descending triangle pattern on the weekly chart. The price has moved from the established support zone near ₹440-450 and is currently challenging the resistance trendline around ₹492.25. This movement appears with a marked increase in trading volume, highlighting the level where buyers and sellers are most active.
Pattern Character
A descending triangle pattern is identified by a series of lower highs against a stable support base. Granules India’s recent action displays persistence at support and upward momentum toward resistance. The volume expansion indicates notable participation during the current move.
Chart Observation
Price action above the triangle’s resistance can indicate a change in the prevailing sentiment if confirmed by continued volume. The current structure and market activity are being closely watched by participants for further development. No forecast or recommendation is made within this post.
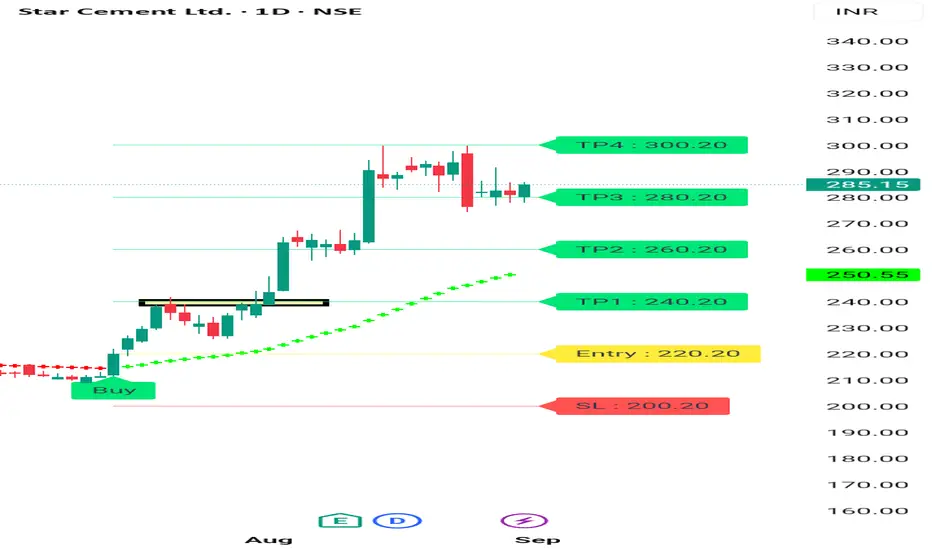
STAR CEMENT BULLISH Structure Start Cement Showing Good Strength on 1 Day Chart. Be Can See Star Cement given breakout and moving up in a higher high Pattern. It's a good sign that stock Still in Upper Range in this Falling market.
Consult your financial advisor before making any position in stock market. It's not my buy sell Reccomendation. My views are for educational purposes only.
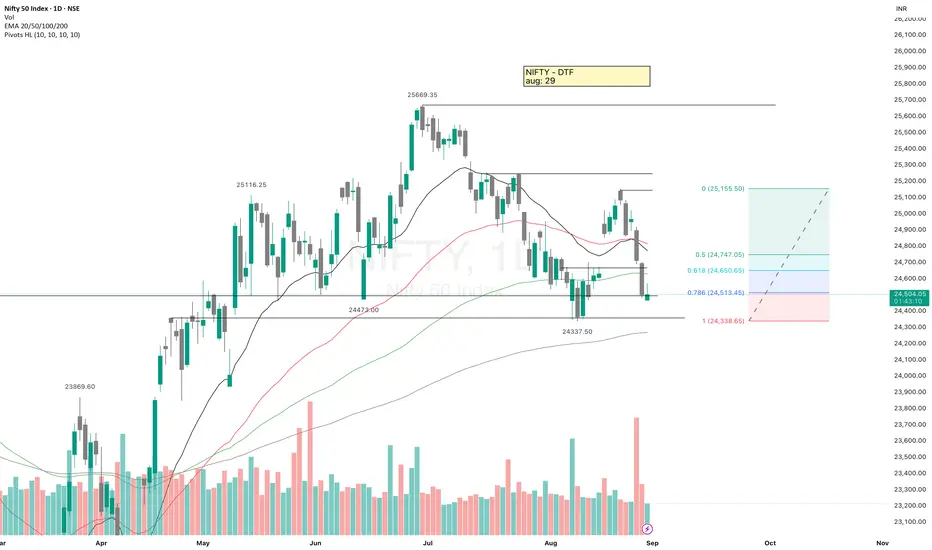
NIFTY50 - Technical AnalysisNIFTY - Technical analysis
Price is currently around 24,500, which is right near the 0.786 retracement level, a Strong confluence zone, Nifty has reversed from here multiple time.
If Nifty sustains above 24,500 and reclaims 24,650–24,750 (0.618–0.5 retracement), there is room for upside move toward 25,150.
If it fails to hold 24,500 and especially 24,334 - recent swing low, then downside continuation may come.
✅ If you like my analysis, please follow me as a token of appreciation :)
in.tradingview.com/u/SatpalS/
📌 For learning and educational purposes only, not a recommendation. Please consult your financial advisor before investing.
ETH HnSA Head N Shoulder is being made in ETH in 4hr tf. It is also break a rising trendline support.
Entry- 4395-4400
SL- 4550
Target- One can look to book after one is to one or can also target the recent low it made that is 4200.
Disclaimer- This is just for educational purpose. Please take advice before making any decision.
Jai Shree Ram.

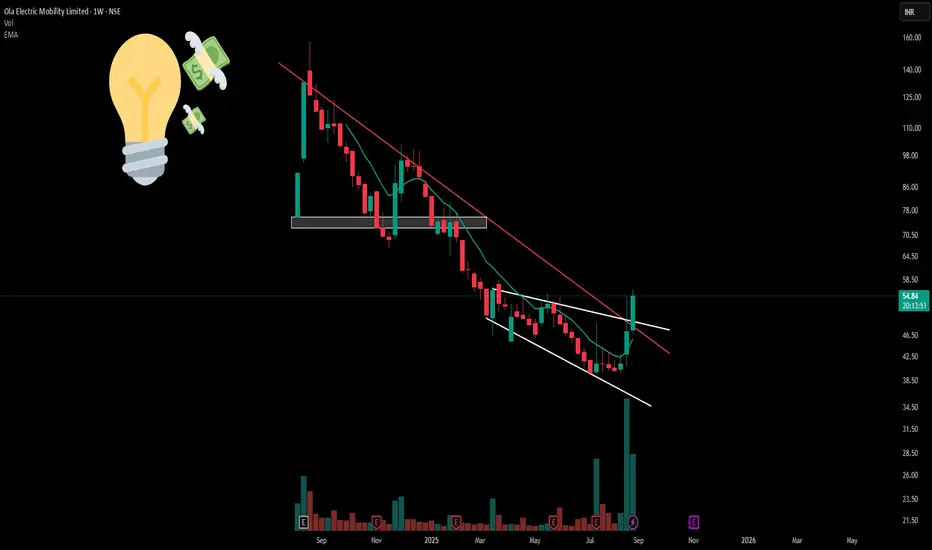
OLA : Simple Channels and Exceptional Volume PatternsOla Electric (NSE: OLAELEC) displays a descending channel pattern with the red resistance trendline providing consistent overhead resistance. The stock has operated within this falling channel structure since peak levels, creating defined technical boundaries.
A broadening formation is evident through white trendlines showing expanding volatility ranges.
Exceptional volume expansion compared to historical averages. Combined NSE+BSE volumes substantially exceed normal ranges, indicating institutional participation rather than retail activity.
Disclaimer: Educational content only. Not investment advice. Trading involves substantial risk. Technical patterns don't guarantee outcomes. Consult qualified advisors before investing.
Gold Plan (28/08) – Ahead of 3,400: Breakout or Correction to ??XAU/USD – Gold hits Storm Breaker 3400: Accumulation before breaking ATH?
1. Market Wave 🌍
Throughout last week, Gold continuously formed BOS (Break of Structure) , confirming that buyers remain in control.
Currently, price is consolidating around 3,394 – 3,400, right at the Storm Breaker 🌊 , the crucial barrier before heading towards the old ATH at 3,424.
The key question: Will Gold accumulate here and smash through ATH, or will it need a pullback to safe harbors before a strong rally in September?
2. Technical Analysis ⚙️
Storm Breaker 🌊 (Strong Resistance): 3400 – 3424 (old ATH). The gateway Gold must conquer to open a new bullish leg.
Golden Harbor 🏝️ (Key Support): 3375 – 3355 – 3330. Confluence with FVG + Fibonacci 0.5/0.618 , likely to attract liquidity if price corrects.
Short-term scenario: Price may pull back to Golden Harbor before breaking higher.
3. Captain Vincent’s Map – Trade Scenarios 🪙
🔺 Quick Boarding 🚤 (BUY Scalp – Rebound Priority)
Entry: 3353 – 3355
SL: 3349
TP: 3356 → 3359 → 3361 → 33xx
🔻 Storm Breaker 🌊 (SELL Reaction – Old ATH)
Entry: 3422 – 3424 (if tested)
SL: 3430
TP: 3419 → 3415 → 3410 → 3405 → 33xx
4. Captain’s Note ⚓
"The Gold ship is now pressing against Storm Breaker 🌊 3400 – 3424 . If it breaks through, the vast ocean opens a new trend. But if the waves push back, patiently wait at Golden Harbor 🏝️ to anchor and catch the September tide."

SBINSBIN is looking good.
It gave a clean breakout above an old resistance zone. After the breakout, it pulled back to retest the level, and during this retest it respected the previous swing low at ₹781.70. Not breaching this level shows strong demand holding.
It is moving above all key EMAs, more importantly it is moving above 200ema for the last 3 months - which confirms the strength of the broader uptrend.
Volume is good and this reduces the there is probability of a false breakout.
In between it may halt around 858, 880 and 894, previous resistance levels.
✅ If you like my analysis, please follow me as a token of appreciation :)
in.tradingview.com/u/SatpalS/
📌 For learning and educational purposes only, not a recommendation. Please consult your financial advisor before investing.

Hammer In RelianceEntry- 1380-1378
Support- 1360
Targets- 1395, 1400
Reason- In 1hr timeframe a perfect hammer candle has been made in Reliance Industries which is an indication of a reversal in the stock. One can look for an entry here with 1360 as a SL.
Disclaimer- This is just for educational purpose.
Jai Shree Ram.

Gold Plan 27/08 – Captain Vincent (IN)XAU/USD – Trump strengthens control over the FED, Gold consolidates near Storm Breaker
1. News Wave 🌍
Trump: “We will soon have majority control at the FED. Miran may be moved to another position with a longer term.”
Trump: “I already have a candidate in mind to replace FED Governor L. Cook.”
US Senate: Preparing hearings next week for Trump’s nominee – S. Miran .
👉 Message: Trump is consolidating power within the FED. Market fears FED losing independence → USD volatility rises, Gold benefits from safe-haven flows .
2. Technical Outlook ⚙️
Gold is approaching Storm Breaker 🌊 (3400 – 3402) , overlapping with resistance 3392 – 3406 → profit-taking likely .
On H1, multiple FVGs remain unfilled around 3355 & 3330 → Price may correct to retest these supports before choosing direction.
Intraday bias: Range-bound → Sell at resistance, short Buy at supports.
3. Captain Vincent’s Map – Key Levels 🪙
Resistance (Kháng cự):
3406 – 3400 – 3392 (Storm Breaker 🌊)
Support (Hỗ trợ):
3372 (Minor Shield 🛡️)
3355 (Quick Boarding 🚤 – Buy Scalp Zone)
3344 (Intermediate Shield 🛡️)
3330 (Golden Harbor 🏝️ – Main Buy Zone)
4. Trade Scenarios 📌
🔻 SELL at Storm Breaker 🌊 (Priority)
Entry: 3400 – 3402
SL: 3408
TP: 3395 → 3393 → 3389 → 3386 → 33xx
🚤 BUY Scalp – Quick Boarding
Entry: 3353 – 3355
SL: 3345
TP: 3358 → 3361 → 3363 → 33xx
🏝️ BUY at Golden Harbor (Strong Support)
Entry: 3330 – 3332
SL: 3325
TP: 3335 → 3338 → 3341 → 33xx
5. Captain’s Note ⚓
"Gold today faces Storm Breaker 🌊 above, but multiple shields of support remain below. Smart traders will scalp quickly at Quick Boarding 🚤, or patiently wait for Golden Harbor 🏝️ to anchor safely."

Gold Plan 26/08 – Captain VincentXAU/USD – Trump’s surprise move sparks a Gold rally. What’s the next scenario?
1. News Wave 🌍
Trump unexpectedly dismissed FED Governor L. Cook , citing “irresponsible recent financial decisions.”
👉 A political–monetary shock that pushed Gold up by more than 30 points from the 3,350 – 3,352 zone, as investors feared internal instability at the FED could weaken the USD.
Safe-haven demand has been activated, but Gold is unlikely to “fly in a straight line.” The market often requires a pullback to fill liquidity gaps before a clear trend develops.
2. Technical Outlook ⚙️
Price bounced sharply from Golden Harbor 🏝️ (Buy Zone 3350 – 3342) – a key support area.
Currently, Gold is testing Storm Breaker 🌊 (Resistance 3384 – 3400) , a liquidity cluster → potential for profit-taking sell orders.
On H1, multiple FVGs formed around 3363 and 3355 → price may retrace to “fill the gap” before continuing.
👉 Intraday bias: Prioritise Sell at resistance, but watch for short Buy Scalp setups at Quick Boarding 🚤 (3342 – 3340) .
3. Captain Vincent’s Map – Key Levels 🪙
Storm Breaker 🌊 (Main Resistance): 3384 – 3400
Quick Boarding 🚤 (Buy Scalp): 3342 – 3340 | SL 3333 | TP: 3345 → 3347 → 3350 → 33xx
Golden Harbor 🏝️ (Buy Zone): 3350 – 3342
FVG Zones: Around 3363 & 3355 (short-term price magnets)
4. Trade Scenarios 📌
🔻 SELL at Storm Breaker 🌊 (Priority)
Entry: 3400 – 3402
SL: 3408
TP: 3395 → 3390 → 33xx
🔺 BUY Scalp – Quick Boarding 🚤
Entry: 3342 – 3340
SL: 3333
TP: 3345 → 3347 → 3350 → 33xx
5. Captain’s Note ⚓
"Trump’s news wave pushed Gold like an unexpected headwind. But Storm Breaker 🌊 ahead may unleash rough seas. The wise will anchor at Golden Harbor 🏝️ , while the bold may ride Quick Boarding 🚤 for fast scalps. And remember: today’s golden sea depends on the sharks at the helm."

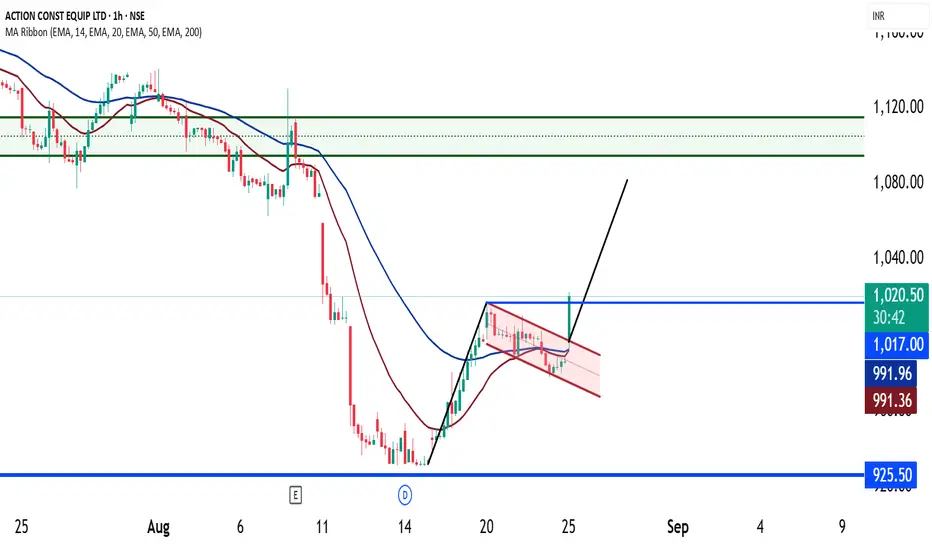
ACE - Breakout of Bullish FlagACE Construction has confirmed an upside breakout from a bullish flag pattern, indicating potential trend continuation. The RSI is rising towards 70, reflecting increasing bullish momentum. Additionally, EMAs are nearing a bullish crossover, reinforcing a short- to mid-term bullish outlook. Sustained volume and price action above key resistances will further validate the move.
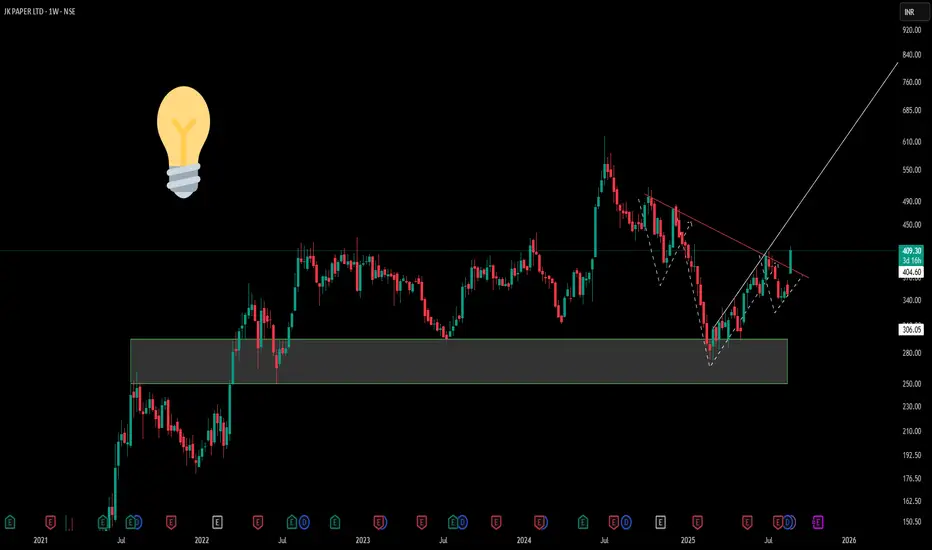
The Anatomy of Market Structure : JK PAPER1) Supply-Demand Conversion Zone Observation
The highlighted grey rectangular zone on the chart represents a critical supply-demand conversion area. This zone, spanning approximately the ₹280-₹320 range, has historically acted as a significant inflection point where institutional money flow patterns have shifted.
2) The Inverted Head and Shoulders Formation
Above this conversion zone sits a textbook inverted head and shoulders pattern, meticulously marked with dotted lines. This formation showcases three distinct troughs:
-Left Shoulder: Formed during the initial decline phase
-Head: The deepest trough representing maximum bearish sentiment
-Right Shoulder: A higher low indicating weakening selling pressure
3) The pattern's neckline resistance (depicted by the red counter-trend line) : Its true nature is to provide resistance as a downward sloping trend continues up until trend shifts, also know as Market structure shift .
Disclaimer: This analysis is purely educational and structural in nature. It does not constitute investment advice, trading recommendations, or buy/sell signals. Always conduct your own research and consult with qualified financial advisors before making investment decisions.
ETH BigBOEntry- 4555-4545
Targets- All time High
SL- 4465 (FIb Levels)
Reason- After a big volume candle near all time high ETH made a retracement and from here it can continue its upside journey towards all time high and 5050 Levels. Entry is being made in Fib Golden zone level which has been made in bigger tf that is daily tf and entry in taken in the shorter tf that is 1 hr tf.
Disclaimer- This is just for educational purpose.
Jai Shree Ram

Gold preparing for correction under FED & geopolitic - Vincent🟡 Gold Plan 25/08 – Captain Vincent ⚓
1. Market Context 🌍
Russia – Ukraine: Trump puts pressure on Putin to negotiate within 2 weeks. This looks positive for peace, but also carries escalation risks → Gold keeps its safe-haven role .
FED – Powell at Jackson Hole: Hawkish tone reduced expectations of a September rate cut from 3 to 2. USD strengthened → short-term downside pressure on Gold .
👉 Mix of political support vs FED pressure → Sideways market, Gold may need a pullback to absorb liquidity before showing clear direction.
2. Technical Outlook ⚙️
H4 candle closed bearish → Buying momentum weakens , sellers may return.
Recent FVG created after sharp bounce → Likely pullback for liquidity grab .
Bias of the day: Prioritise Sell, but short Buy Scalp setups possible at support.
3. Key Levels – Captain Vincent’s Map 🪙
Resistance:
Storm Breaker 🌊 (Sell Zone 3398 – 3400)
3376 (intermediate resistance – watch reaction)
Support:
Quick Boarding 🚤 (Buy Scalp 3340 – 3342)
SL: 3333
TP: 3345 → 3349 → 3353 → 3357 → 33xx
Golden Harbor 🏝️ (Buy Zone 3328 – 3326)
SL: 3318
TP: 3332 → 3336 → 3339 → 33xx
Higher Low – 3323
Anchor point of the trend → If broken, need to reassess all Buy setups.
4. Trade Scenarios 📌
🔻 Sell at Storm Breaker 🌊
Entry: 3398 – 3400
SL: 3408
TP: 3395 → 3390 → 3387 → 3384 → 33xx
🚤 Buy Scalp at Quick Boarding
Entry: 3340 – 3342
SL: 3333
TP: 3345 → 3349 → 3353 → 3357 → 33xx
🏝️ Buy at Golden Harbor (3328 – 3326)
SL: 3318
TP: 3332 → 3336 → 3339 → 33xx
5. Captain’s Note ⚓
"Today, the golden sea is full of undercurrents: FED winds blow against, politics push along. Those who pick Storm Breaker 🌊 may ride the wave safely; those who patiently wait at Golden Harbor 🏝️ will find peace. Quick Boarding 🚤 is for sailors seeking fast scalps in narrow waters."

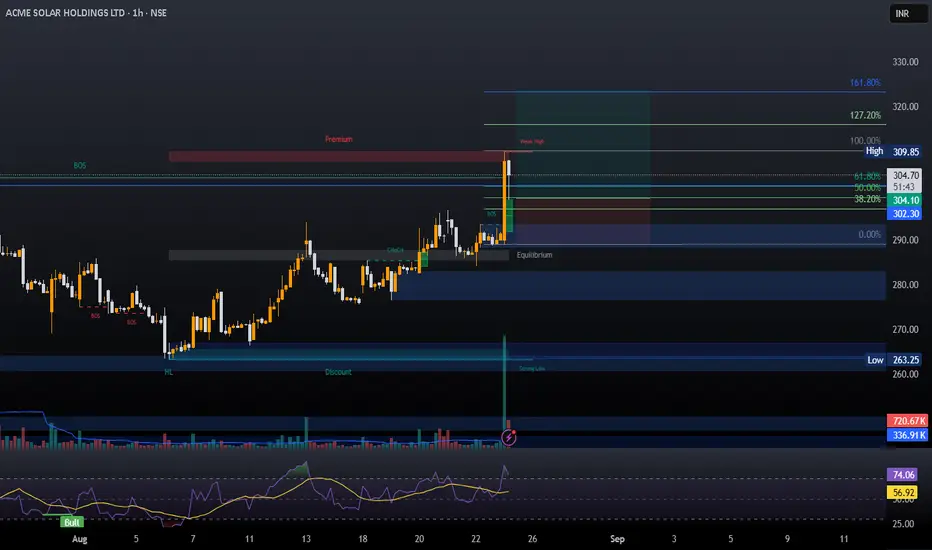
ACME SOLAR IPO BASEEntry- 300-302
Target- 315, 325, 340
Support- 285
Reason- Acme Solar has given a IPO base breakout. One can take a long here with todays low as a SL. It has given a strong closing above its IPO base high. IPO base breakout trade usually has great win ratio. One can also hold it for 25 to 30 percent returns. Keep Check.
Disclaimer- This is just for educational purpose.
Jai Shree Ram.
Observing Charts Smarter: Learning Price Action Made EasyIn this video, I share how simple trading observations and “talking to the charts” can improve your understanding of price action and trade movements. By reviewing Apollo’s chart, we explore how breakout patterns, retracements, and higher highs unfold in real time. The goal is not prediction, but sharpening your ability to read market structure, avoid wrong entries, and reduce big drawdowns—ultimately helping you become a more disciplined trader.
