INNOVANA THINKLABS LTDINNOVANA - The stock is currently moving within an ascending channel. There is strong horizontal resistance around the 405-410 range, which has been tested multiple times. If strong closes above 410 would confirm the trend continuation toward targets of 440 and 485.
Swingtrading

RAJRATAN (Rajratan global wire ltd.)RAJRATAN is consolidating, making higher lows and equal highs, above 20-50ema.
Breakout may give a good upside move.
✅ If you like my analysis, please follow me as a token of appreciation :)
in.tradingview.com/u/SatpalS/
📌 For learning and educational purposes only, not a recommendation. Please consult your financial advisor before investing.

NAVA LTD – Breakout Retest Done, Ready for Next Leg!🚀 NSE:NAVA – Breakout Retest Done, Ready for Next Leg!
📍 CMP: ₹580.15
📊 Breakout Zone: ₹550–565 (retested successfully)
🎯 Target: ₹735.95 (🔼 +30%)
🛡️ Stoploss: ₹545 (below recent retest support)
📈 Strong breakout followed by clean retest and bullish candle
🔥 Volume trend remains elevated – signs of accumulation
🔋 Multiyear high breakout + Energy sector exposure = strong momentum setup

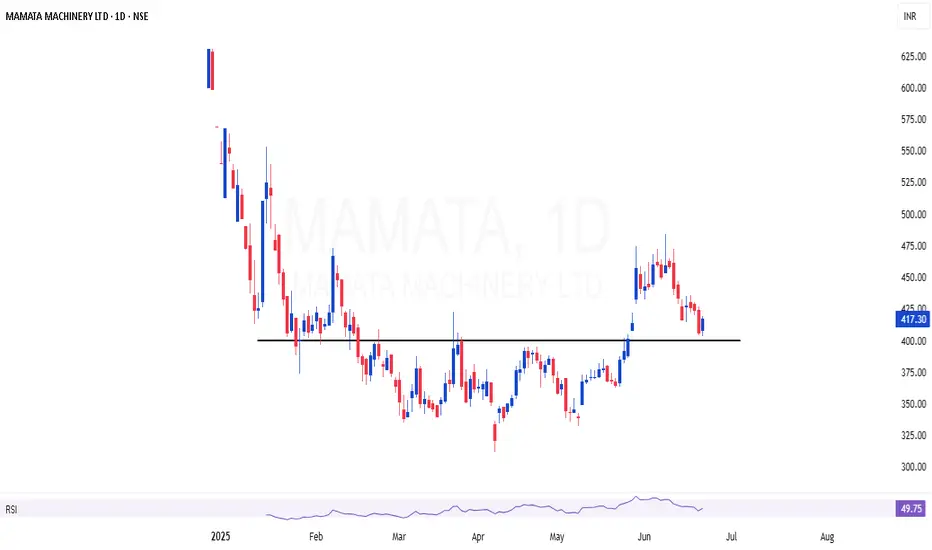
MAMATA | Breakout and retesting the area of valueMAMATA | Breakout and retesting the area of value
Valuation also looking good
BIRLA CABLEBIRLA CABLE has tapped at the OB after making an impulsive move.
It's been consistently making HH-HL formation.
Reversal from here may give a good upside move.
✅ If you like my analysis, please follow me as a token of appreciation :)
in.tradingview.com/u/SatpalS/
📌 For learning and educational purposes only, not a recommendation. Please consult your financial advisor before investing.

MAXHEALTH - DTFMAXHEALTH is looking good.
It was facing resistance near 1180-1190 from last couple of months, and now gave Breakout of previous ATH too. Moving above 20-50ema.
From here there is probability of an upside move.
✅ If you like my analysis, please follow me as a token of appreciation :)
in.tradingview.com/u/SatpalS/
📌 For learning and educational purposes only, not a recommendation. Please consult your financial advisor before investing.

Bulish Breakout in HUBTOWNIn upcomming Few Days we ll see a bulish breakout in HUBTOWN
as price is going to retrace the level then it will break the level 136.6 and there is a possible upcomming move in HUBTOWN

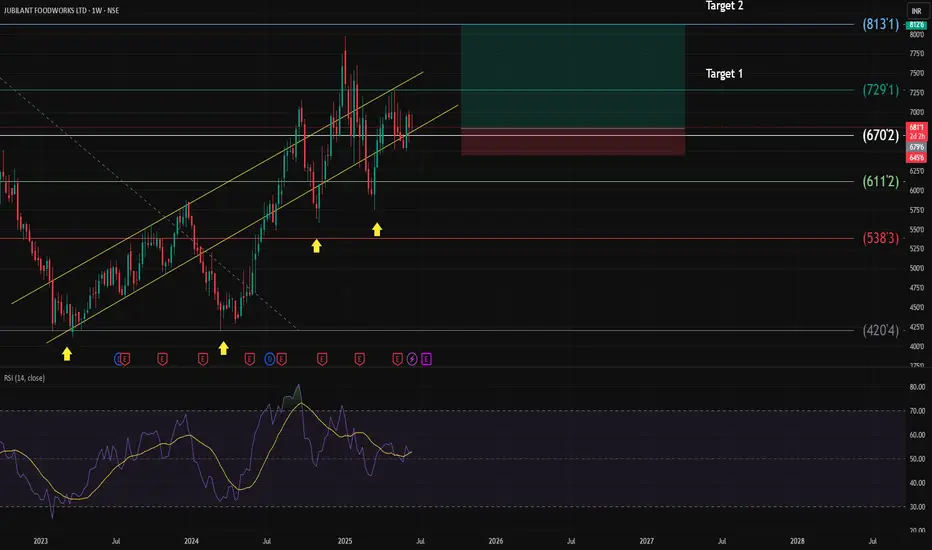
Jubilant FoodWorks Ltd (NSE: JUBLFOOD) a comprehensive technicalHere's a comprehensive technical analysis of Jubilant FoodWorks Ltd (NSE: JUBLFOOD) based on weekly chart setup
Long-term uptrend still intact despite deep corrections.
RSI Analysis (14)
Current RSI: ~52.4 (neutral zone)
RSI crossed above signal line recently → bullish divergence
No overbought or oversold signals, momentum is improving
Entry: CMP
Stop-loss: ₹645 (below structural support)
Targets:
T1: ₹729 (~7.1%)
T2: ₹813 (~19.5%)
T3: ₹920 (~35%)
Risk/Reward Ratio: 3.91 — Excellent for a positional trade
Bullish Triggers
Price trading above 0.5 fib
RSI recovery from 40–50 range
Sideways structure looks like a base formation
Multi-month consolidation around demand zone
Bearish Risks
If ₹645 zone breaks, price can test ₹611 or even ₹538
RSI falling below 50 again could invalidate the breakout
Bias: Moderately Bullish
Holding View: 3–12 months
Upside Potential: 19–35%
Downside Risk: ~5% (managed with stop-loss).
Let me know your thoughts.
this idea is paper trade only. Not a recommendation.
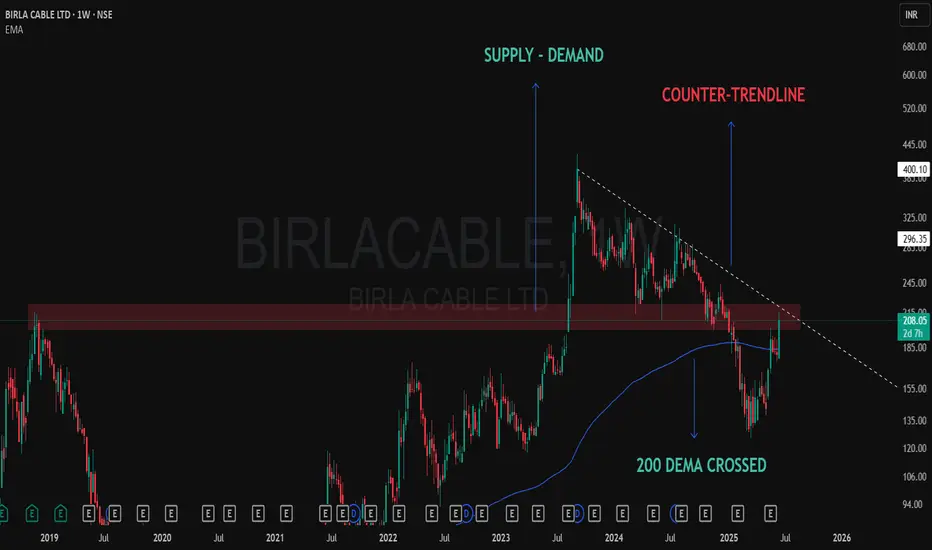
Technical Development on Weekly Chart – Birla Cable📈 BIRLA CABLE – Chart Talking Loud Now!
✅ 200 DEMA crossed
200 Dema was providing solid resistance and now taken out marked with blue line.
❌ At Counter-Trendline
Solid CT thrown from the top of the pattern, dotted white line shows that.
✅ Demand Zone Holding Strong
Clearly shown a solid supply zone which got converted into a Demand only after the Breakout some months back.
After months of consolidation and rejection from the same supply zone… price is now attacking with volume 🔥
🧠 “When structure aligns with emotionless patience, conviction follows.”
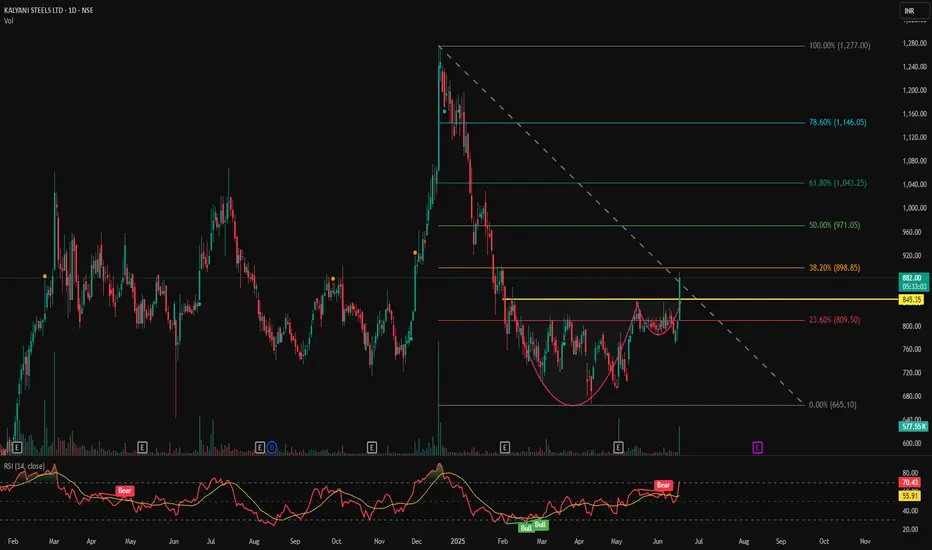
KSL - Strong Cup & Handle Breakout | Volume & RSI Confirmation📊 KALYANI STEELS LTD (KSL) – Strong Cup & Handle Breakout | Volume & RSI Confirmation | Daily Chart
📅 Chart Date: June 17, 2025
📈 CMP: ₹891.00 (+10.33%)
📍 Ticker: NSE:KSL
🔍 Technical Chart Breakdown
☕ Cup & Handle Pattern Breakout
KSL has decisively broken above the neckline resistance around ₹845 after forming a classic Cup & Handle pattern — a strong bullish continuation setup. This breakout has been accompanied by a solid volume spike (458.32K), which adds further confirmation.
💹 RSI Analysis
RSI is currently at 71.61, indicating strong bullish momentum.
RSI crossover confirms entry into the overbought zone, signaling strength but also requiring caution for late entries.
🕯️ Volume Action
Noticeable volume surge on the breakout candle suggests institutional participation.
Previous volume build-up near the handle zone indicates accumulation.
📍 Key Price Levels
✅ Breakout Zone: ₹845.35
🚀 Potential Upside Targets:
₹920 – Minor resistance
₹990–₹1,040 – Short to medium-term swing targets
₹1,150+ – Based on measured pattern height
🛡️ Support Zones:
₹845 – breakout retest level
₹800 – psychological support
₹765 – handle base and invalidation zone
🛠️ Trading Strategy Idea
Entry: Either breakout close above ₹845 or on retest of breakout zone
Stop Loss: Below ₹800
Targets: ₹920 → ₹1,000 → ₹1,150
Risk-Reward: >1:2 on first target with strong technical validation
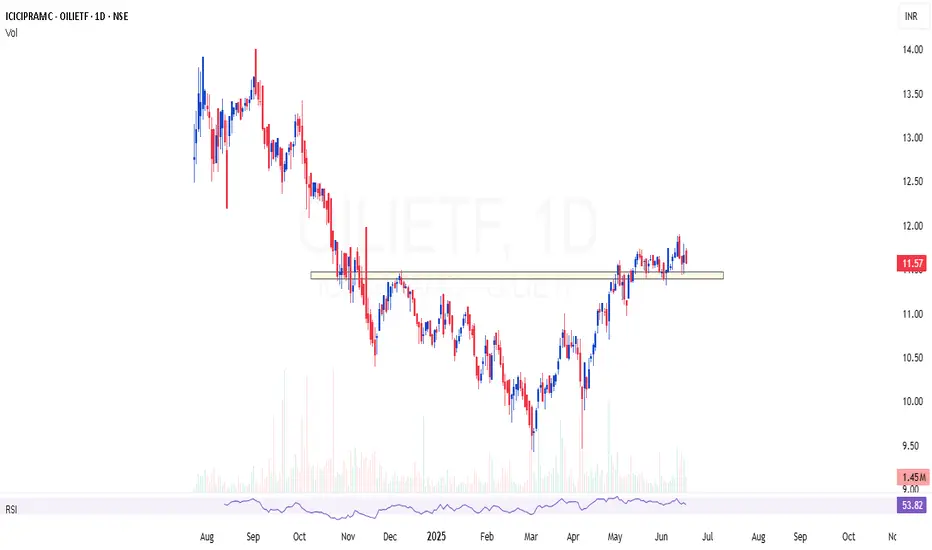
OILIETF | Good theme for current global sentimentOILIETF | Good theme for current global sentiment
The ETF has good volume to trade,
Portfolio consist of stable stocks that are fallen already
Trying to capture a 30% move in this ETF
Has good risk reward and momentum aswell
Relatively a stable bet
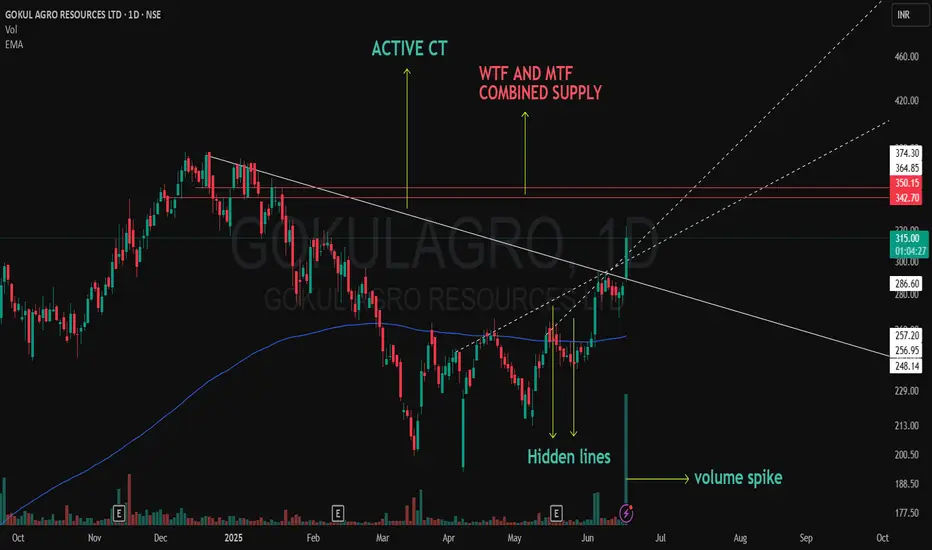
CT Breakout Live on GOKULAGRO! Supply Zone Just Ahead 📌 CT Breakout In Play | GOKULAGRO
A strong breakout just happened on the Daily chart of GOKULAGRO.
🟢 The Active CT (green) has been cleanly broken today with a strong bullish candle.
🟢 Multiple hidden resistances were also taken out during the breakout – marked in green as they’ve now turned into potential support.
🟢 A healthy volume spike confirms strong participation – not massive, but convincing enough to validate the move.
🔴 The next major supply lies just ahead – a combined Weekly + Monthly resistance zone (marked in red). This could act as a temporary pause or reversal zone if not cleared with momentum.
This is not a forecast or a buy/sell recommendation — just a structured observation of price action and context.
Watching how it behaves near the higher timeframe supply. Will it reject or absorb?
Bullish Breakout in HCL TechStock breaks above key resistance zone of ₹1770
Strong bullish candle formation on the daily chart
Breakout supported by above-average volume, confirming strength
Price broke out from ascending triangle pattern — a classic bullish continuation signal
📢 Fundamental Trigger:
HCL Tech remains strong in cloud, AI, and digital transformation services
Recent deal wins and strong Q4 results supporting bullish sentiment
Attractive valuation compared to peers like TCS & Infosys

Bullish Breakout in VIP Industries 🔍 Chart Overview:
Breakout above resistance zone at ₹420
Strong volume spike confirming buying interest
Price action broke out of a consolidation channel
Formed a bullish flag/pennant pattern before breakout
🔧 Technical Indicators:
RSI moving above 60 → bullish momentum building
MACD crossover near zero line → fresh upward signal
50 EMA support intact, stock trading above all major EMAs

TVSSCS - Triangle into a flag!The following points are of note:
------------------------
1. A symmetrical triangle formed as a near-term bottom for the stock
2. After breaking out of the triangle, price is consolidating in a rectangular range
3. A pole and flag formation, when broken out can give targets of 143, 147, with SL of 123
Disclaimer:
This is NOT a trading recommendation, only my observation. Please do your own analysis before entering any trade.

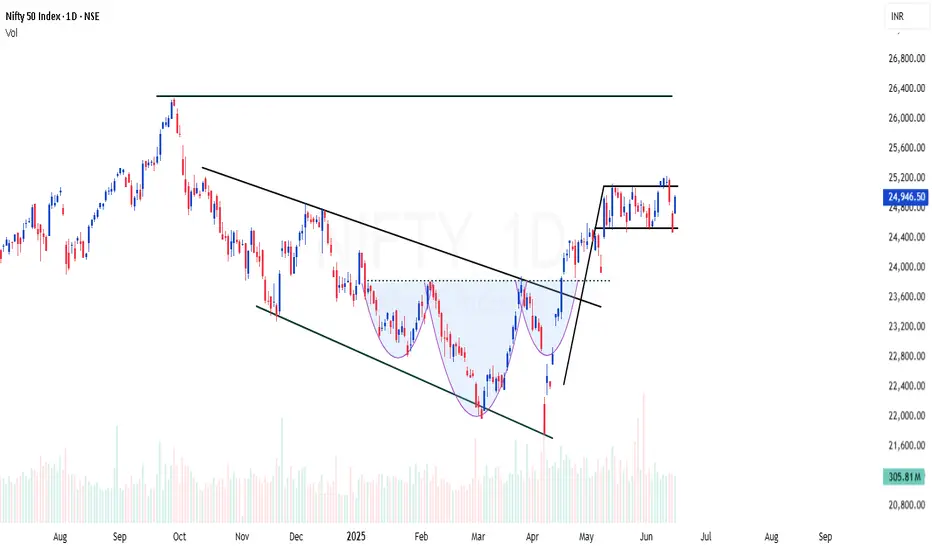
NIFTY | Back to back bullish patternsNIFTY showing back to back bullish signs
Channel breakout - Done
Inverted Head & Shoulder breakout (INHS) - Done
Now forming flag setup
NIFTY shows strength to move another 15% this year
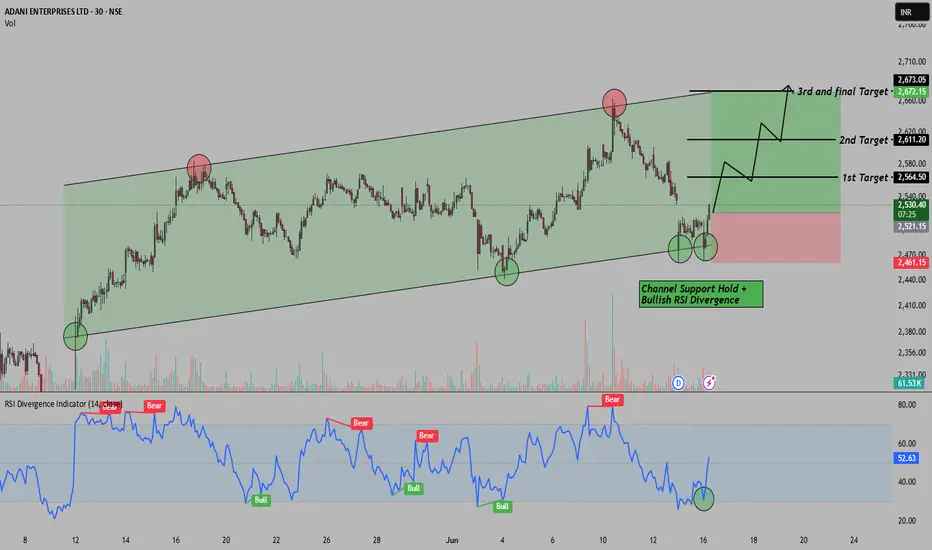
Rising Channel+RSI Divergence=Reversal Setup in Adani EnterpriseHello Everyone, i hope you all will be doing good in your life and your trading as well. Today i have brought a setup in Adani Enterprises , where we’re spotting a short-term reversal opportunity inside a clean rising channel . Price recently tested the channel support for the 3rd time and gave a solid bounce, which is also confirmed by a bullish RSI divergence . This combo often works as a reliable early reversal signal for positional or intraday swing traders. Here we are expecting at least 4%+ move behalf of this setup.
This trade is completely logic based so i placed Stop loss around 2461 for controlled risk. for the targets please check the chart above i have mention there.
Reward-to-Risk Ratio looks favorable here , especially with clear trend structure and momentum support from RSI. Let’s see how this setup plays out!
If you liked this breakdown, don’t forget to LIKE & FOLLOW for more real chart setups, data-backed ideas, and smart money zones.
Disclaimer: This post is for educational purposes only. Do your own research or consult a financial advisor before investing.
MaxHealth good to keep on radar NSE:MAXHEALTH
Good to keep on the radar
Always respect SL & position sizing
===================
Trade Secret By Pratik
===================
Disclaimer
SEBI UNREGISTERED
This is our personal view and this analysis
is only for educational purposes
Please consult your advisor before
investing or trading
You are solely responsible for any
decisions
you take on basis of our research

JUBILANT INGREVIA (LONG)Price has given a long tern consolidated range breakout with multiple cofluences
Point to look at -
- All Ema Lined Up (Bullish)
- High Volume Spurt
-14-15 % Move Possiblity
- Big Bar Candle Breakout
Retest Level - 756-760 Area
Upside Level - 870
Invalid Below -690 CB
Till Then, Stay Focused, Keep Following Markets

360 ONE – Bullish breakout360 ONE (NSE: 360ONE), a leading wealth and asset management firm in India, is showing strong bullish momentum backed by:
✅ Consistent Growth in AUM: The company continues to scale its assets under management with high-net-worth and ultra-HNI client acquisition.
✅ Strong Quarterly Results: Robust revenue growth and improving profit margins signal efficient operations and increased demand for wealth management services.
✅ Technically Sound Setup:
The stock has broken out from a key resistance zone with rising volumes.
Trading above all major EMAs (20/50/200), confirming a strong uptrend.
RSI is in bullish territory (>60), indicating momentum is intact.
✅ Sectoral Tailwind: The shift from traditional investments to managed wealth products is boosting firms like 360 ONE.
🟢 Price Action Suggests Further Upside
With growing investor confidence and institutional interest, the stock is poised for a potential 10–15% move in the near term, if it sustains above the breakout level.

Happiest minds - a technical Grab?Happiest minds sits right above the retracement levels of 0.786 and has consolidated there for 4 to 5 months now.
this idea is to keep a long term horizon with favorable risk of 8 to 10% of capital.
CMP 608
targets as shown in the charts, as levels go up previous levels trails as the SL.
SL conservative @8% or below 585, 560.
Aggressive SL at 520.
previous results and a technical chart turnaround makes this an good swing idea.
I am not a SEBI registered RA, treat this as an paper trade Idea.
I don't recommend investing real money relying upon my basic idea sharing.
Boost it if you liked it.
Comment your thoughts.
Check my profile for important links to follow.

NAVA LTDNAVA - Nava Limited exhibits strong technical indicators with a bullish bias,
If the stock price manages to break through the 500 level, it could potentially reach targets of around 533 and then 565.

PTCIL – Breakout From Long-Term Consolidation ZonePTCIL is showing strong signs of a bullish breakout, with price holding steadily above key moving averages and positive trend indicators. Institutional accumulation appears to be behind this move, and a close above resistance could see significant upside.
There is a high chances for upcoming move in bullish side
