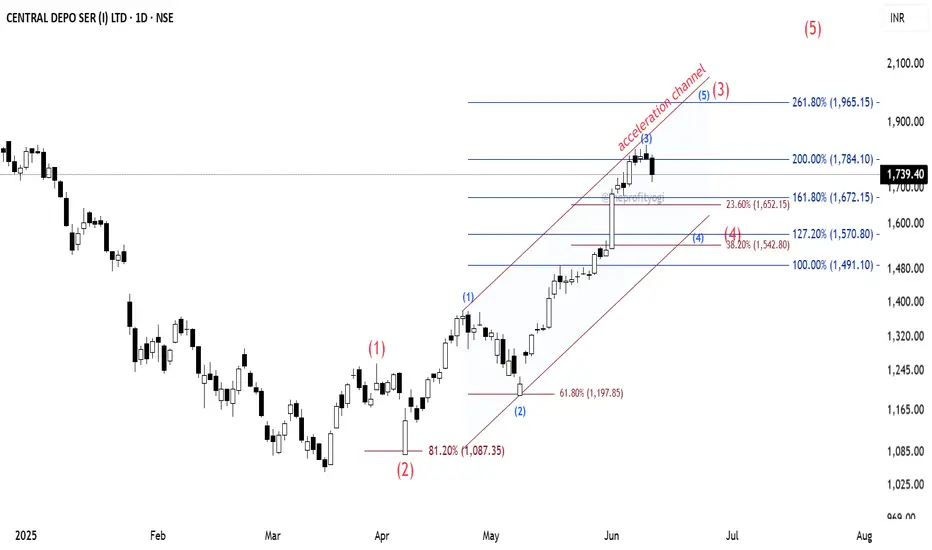
CDSL: Elliott Wave AnalysisThe CDSL daily chart indicates that the stock is in an impulse.
See the counting using Elliott Wave theory where the major wave (2) (shown in red) bounced from the 81.2% level to enter into wave (3).
The subordinate of wave (3) are shown in blue colour, where we can see the subordinate wave (2) of major wave (3) bounced from 61.8%.
To get the possible projection of the subordinate wave (3), I have applied Fibonacci extension to it, and we can see the price is at 200% extension currently. If the recent high is not broken up, we can presume that this is the top of wave (3).
Now, wave (4) will form. And for predicting wave (4) target that I have plotted the Acceleration Channel. This channel can be plotted by joining the line from the top of wave (1) to the top of wave (3) and then its parallel line from the bottom of wave (2).
This channel gives us a hint about where wave (4) may terminate.
Also, I have applied Fibonacci retracement from the bottom of wave (1) to the top of wave (3), and as we know that wave (4) may terminate between 23.6% and 38.2% levels.
So we can get some idea about where wave (4) may complete.
We can see there are clusters of Fib extension and retracement levels near these zones. So we may have a safe buying zone between those.
Important: Here, I have assumed that the subordinate wave (3) is completed.
If the price crosses above the recent top, then we have to replot and recount this study.
This analysis is based on Elliott Wave theory and Fibonacci.
This analysis is for educational purposes only.
This is not any buying recommendations.
Swingtrading
BPCL | Ferocious Flag - Looks good for 30%BPCL | Ferocious Flag 🏁
Looks good for 30% based on the flag setup
Keep SL below 300 for short term trading position
CMP : 334

Buy Venus Remedies Short Term Trading Advice by Goodluck Capital
Buy Venus Remedies
Buy Range- 423 - 438
Target- 470 - 480
StopLoss- below 406
Upside Potential- 9% -11%
Approx trade duration 12 - 14 days

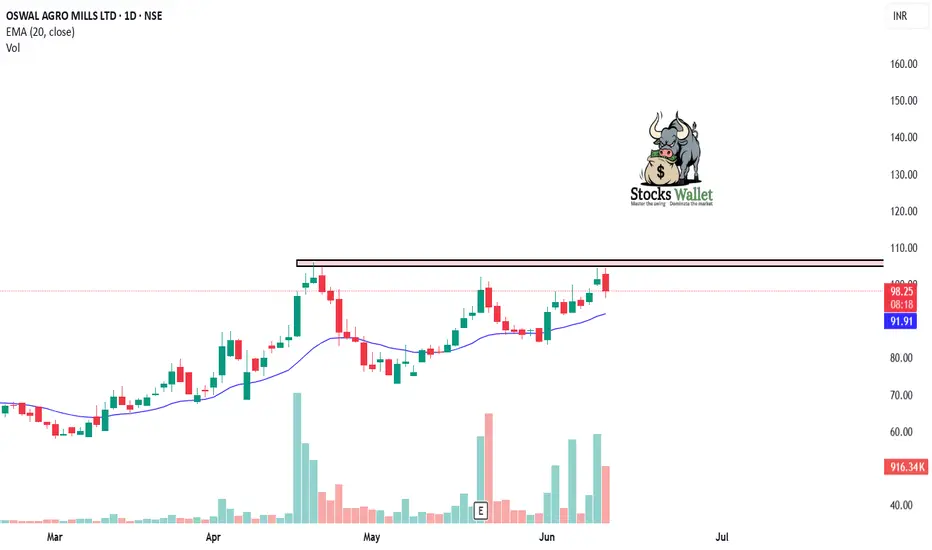
Oswal Agro – Breakout From Long-Term Consolidation Zone🌱 Oswal Agro – Breakout From Long-Term Consolidation Zone.
Chart: Oswal Agro Mills (OSWALAGRO) – Daily Timeframe
Oswal Agro has given a breakout from a long consolidation range, indicating a potential start of a new uptrend. The price action has broken above key resistance near ₹101 with strong bullish candles and increasing volume, suggesting accumulation by smart money.
🔹 Technical Highlights:
Breakout above ₹106 after nearly 3-month sideways movement
Volume spike on breakout candle – confirms strength
Price trading above 20 EMA and 50 EMA
MACD crossover shows bullish momentum
RSI above 60 and trending upward – healthy strength
📌 Trade Setup:
Entry Range: ₹106-107
Target 1: ₹125
Target 2: ₹140
Stop Loss: ₹82. (closing basis)
The breakout could lead to multi-day bullish momentum if sustained above ₹30. Watch for retests or consolidation near breakout levels for low-risk entry opportunities.
⚠️ Educational post only – trade with proper risk management and research.
KRISHANA PHOSCHEM LTD | Major Breakout Ahead? Hey Family, here’s another stock showing a strong technical setup! 🚀
Key Observations:
Pattern : Formation of a Rectangle Box Pattern on the Daily Timeframe (1D).
Range Period:
Stock moved within a horizontal range between June 2024 to April 2025.
Multiple tests near the upper resistance band during this period.
Resistance Behavior:
Price repeatedly tested the resistance zone around ₹278–₹285.
Now showing signs of a breakout attempt and trying to sustain above the range.
Volume Insight:
Noticeable volume accumulation over the past few sessions.
Volume spikes during breakout candles suggest strong buyer interest.
Candlestick Structure:
Strong bullish candles with minimal rejection indicate a genuine attempt to break out.
🚨 Disclaimer: What is your view please comment it down and also boost the idea this help to motivate us. We are Certified. All views shared on this channel are my personal opinion and is shared for educational purpose and should not be considered advise of any nature.
🚨 Note: Always manage risk and do your own research.

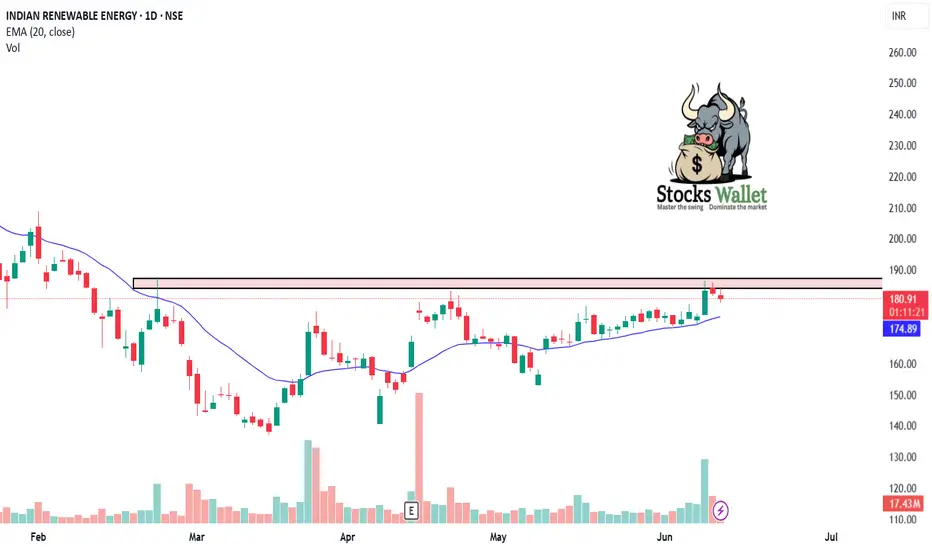
IREDA – Strong Bullish Continuation Setup After Healthy Consolid⚡ IREDA – Strong Bullish Continuation Setup After Healthy Consolidation
Chart: IREDA – Daily Timeframe
IREDA is showing a bullish continuation pattern after consolidating in a tight range near ₹140. The stock has formed a higher low structure, and recent breakout candles with rising volume suggest a renewed upside momentum.
🔹 Technical Highlights:
Ascending triangle breakout around ₹190
Strong support near ₹130–135 range
RSI rising above 60 – bullish strength confirmation
Price holding above 20 EMA and 50 EMA, signaling trend support
Volume breakout confirms buying interest from lower levels
📌 Trade Setup:
Entry Zone: ₹189–190
Target 1: ₹220
Target 2: ₹256
Stop Loss: ₹150 (closing basis)
The stock is part of the renewable energy theme and could see strong interest from positional traders and investors if broader market sentiment supports.
⚠️ This analysis is for educational purposes only. Always manage your risk and do your own research before taking any position.
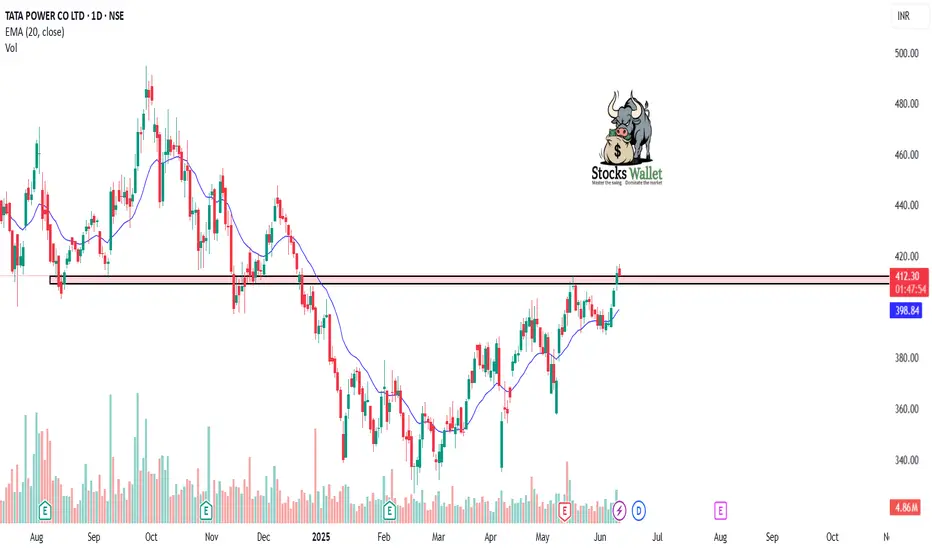
Bulish Breakout in Tata Power ⚡ Tata Power – Bullish Reversal Pattern on Daily Chart
Chart: Tata Power – Daily Timeframe
Tata Power has formed a strong bullish reversal setup after retesting a key support zone near ₹420. The stock has shown strong buying interest with rising volume and a bullish engulfing candle, indicating a potential start of a new upward leg.
🔹 Technical Highlights:
Price bounced from previous swing support (₹420–₹425)
Bullish engulfing candle + volume surge = strong buyer presence
RSI reversing from 50 zone and trending upward
20 EMA acting as dynamic support
📌 Trade Plan:
Entry Zone: ₹430–435
Target 1: ₹450
Target 2: ₹470
Stop Loss: Below ₹420 (closing basis)
The broader trend remains positive, and this could be the beginning of a new up-move. A breakout above ₹440 on strong volume would further confirm the bullish trend continuation.
⚠️ This analysis is for educational purposes only. Please do your own research before trading.
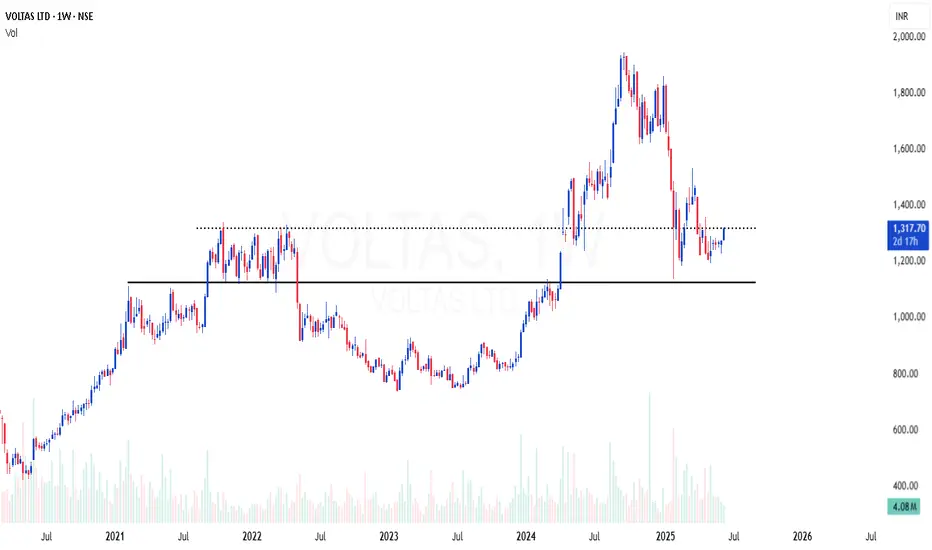
VOLTAS | Excellent area of value in weekly time frameVOLTAS | Excellent area of value in weekly time frame
Weekly 200 EMA support
RSI bullish divergence
Good risk reward
Quality stock at decent correction , looking good for reversal from here
Multi time frame charting explained in GEPILI make educational content videos for swing / positional trading

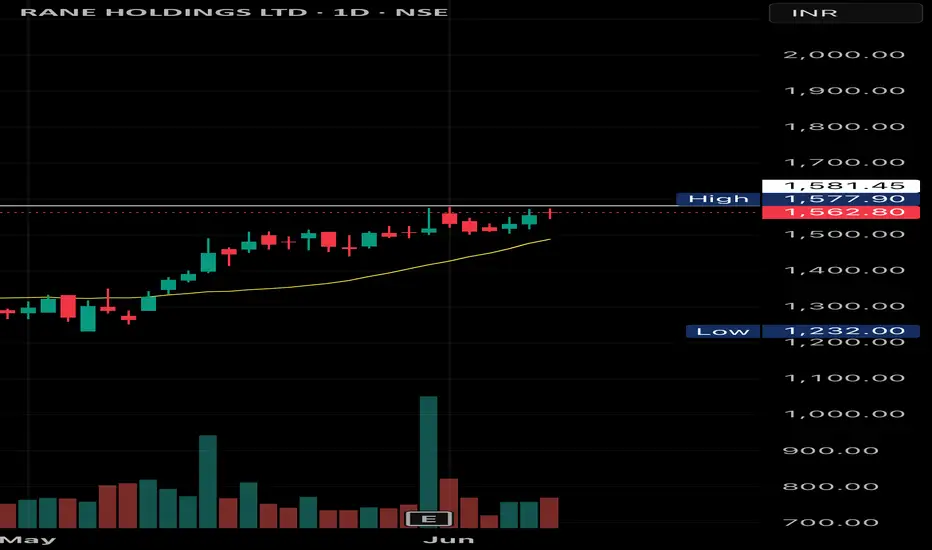
RANE HOLDING SWING TRADE SETUPRane holding swing trade setup. Breakout soon possible, can be a good breakout above 1581 and stop loss Below 1544. Analyse yourself before entry
Share your view on this
ADANIENT (Adani Enterprises)ADANIENT has been consolidating from a long time. After tapping at demand zone it started making higher high-higher lows formation and now at resistance level.
Breakout from here may give a really good move, keep eyes on it.
✅ If you like my analysis, please follow me as a token of appreciation :)
in.tradingview.com/u/SatpalS/
📌 For learning and educational purposes only, not a recommendation. Please consult your financial advisor before investing.

PURVAPURVA has given breakout of resistance after a consolidation.
Moving above 20ema. Now there is probability of an upside move.
✅ If you like my analysis, please follow me as a token of appreciation :)
in.tradingview.com/u/SatpalS/
📌 For learning and educational purposes only, not a recommendation. Please consult your financial advisor before investing.

HYUNDAI | Channel breakout ahead - Looks good for 30%HYUNDAI | Channel breakout ahead - Looks good for 30%
CMP : 1861
SL : 1700
Expecting breakout in this channel,
Has good support to take measured risk - small stoploss
The previous swing high is also works as Fib support

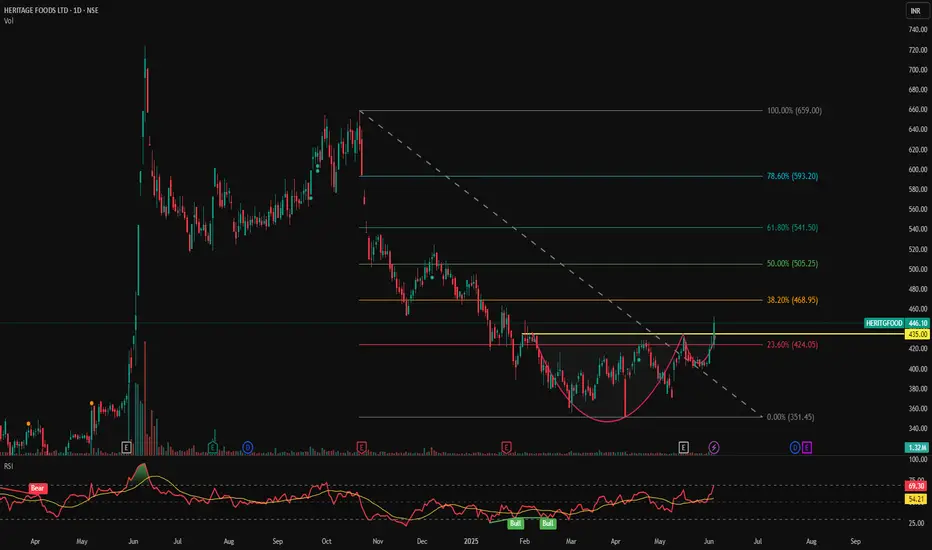
HERITGFOOD - Cup & Handle Breakout with RSI Confirmation | Daily📊 HERITAGE FOODS LTD (HERITGFOOD) – Cup & Handle Breakout with RSI Confirmation | Daily Chart
📅 Chart Date: June 5, 2025
📈 CMP: ₹446.10 (+5.94%)
📍 Ticker: NSE:HERITGFOOD
🔍 Technical Analysis Overview
☕ Cup & Handle Pattern Breakout
HERITGFOOD has successfully broken out of a Cup & Handle pattern, signaling the end of a long downtrend and a potential start of a new bullish wave. The breakout zone lies around ₹435–₹440.
💥 Breakout Volume: Supported by a strong surge in volume (~1.32M), adding conviction to the breakout.
📉 RSI Indicator:
RSI is at 69.30, just below overbought territory, indicating strong momentum.
RSI crossover above signal line confirms bullish strength.
📍 Key Price Levels
✅ Breakout Zone: ₹435–₹440
🚀 Upside Targets (based on pattern projection and past resistance):
₹470 – minor resistance
₹510 – medium-term swing target
₹550+ – extended target if momentum sustains
🛡️ Support Levels:
₹435 – breakout retest zone
₹415 – minor base
₹390 – handle bottom (critical invalidation)
🔻 Stop Loss Zone: Below ₹415–₹420 for risk-managed swing positions
🛠️ Trading Strategy
Entry: After confirmation candle above ₹440 or on pullback to retest breakout zone
Stop Loss: Below ₹415
Targets: ₹470 → ₹510 → ₹550+
Risk/Reward: Attractive R:R setup with confirmation indicators
⚠️ Disclaimer
This chart is for educational and analysis purposes only. Please consult a SEBI-registered financial advisor before taking any trading decision.
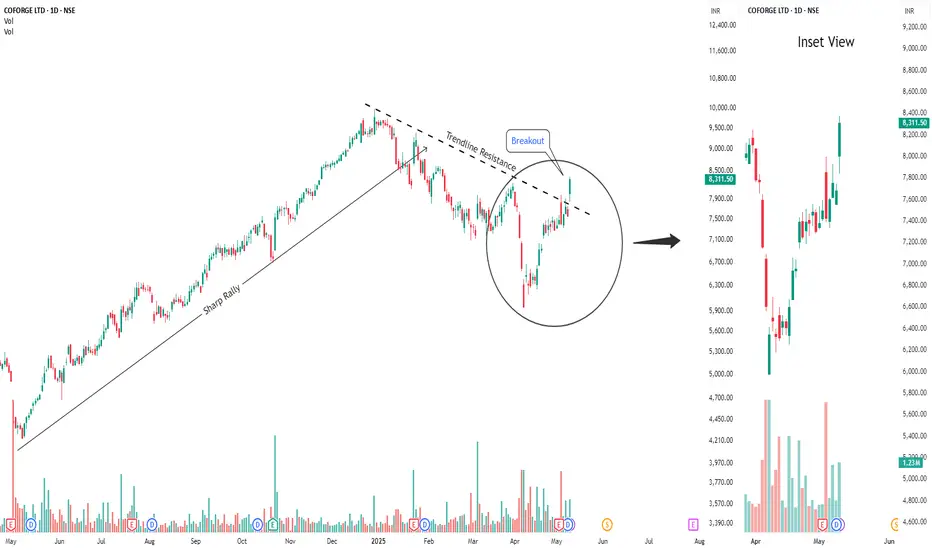
Buy Coforge Short Term Trading Advice by Goodluck Capital
Buy Coforge
Buy Range- 8000 - 8200
Target- 8750 - 8850
StopLoss- below 7700
Upside Potential- 8% -9%
Approx trade duration 14 - 15 days
Inside Bars After High Volume – CERA Setting Up Near Key CT📌 Timeframe: Weekly (WTF)
📌 Type: Technical Observation / Swing Structure
📌 Concept: Counter Trendline Breakout Setup
CERA is currently navigating a highly constructive zone from a swing trading lens. Here's what's developing technically:
🔹 Higher Low Formation:
The stock has established a higher low structure, with the white internal trendline offering visible support across recent weeks. Interestingly, this aligns perfectly with the 200-period EMA on the weekly timeframe, enhancing its significance as a dynamic support layer.
🔹 Volume Clues:
Two of the highest volume candles on the weekly chart have now been followed by inside bars, a potential sign of absorption or base building. This tightening within volume zones signals institutional interest and a possible buildup phase.
🔹 Supply Zone Identified:
An overhead supply (marked in orange)
🔹 EMA Context: The blue 200 EMA further reinforces the idea of Supportive price behavior around this line validates its role.
🔍 This post is for educational discussion only. No recommendation or forecast is implied. Please conduct your own due diligence.

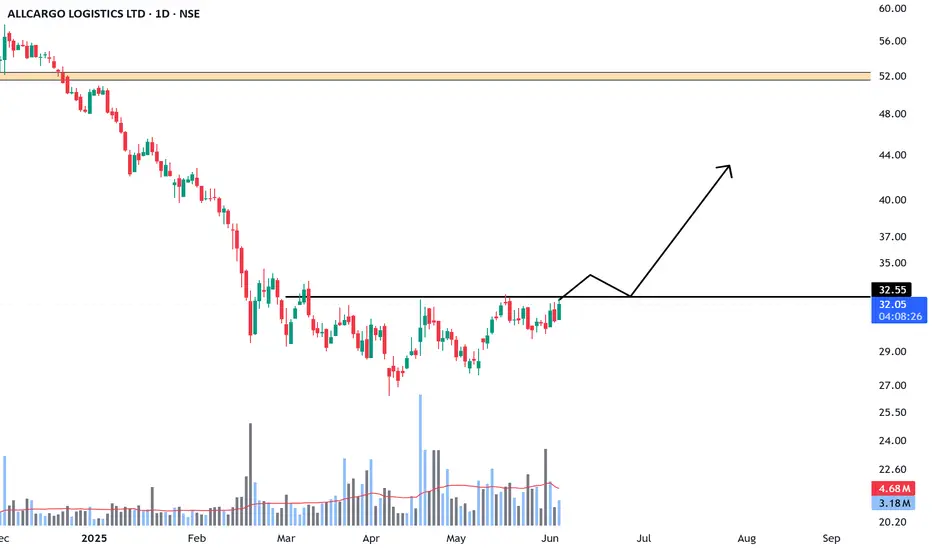
ALLCARGONSE:ALLCARGO
Good to keep on the radar
It's on the verge of BO...
Almost 70% down from ATH
Always respect SL & position sizing
========================
Trade Secrets By Pratik
========================
Disclaimer
NOT SEBI REGISTERED
This is our personal view and this analysis
is only for educational purposes
Please consult your advisor before
investing or trading
You are solely responsible for any decisions you take on the basis of our research.
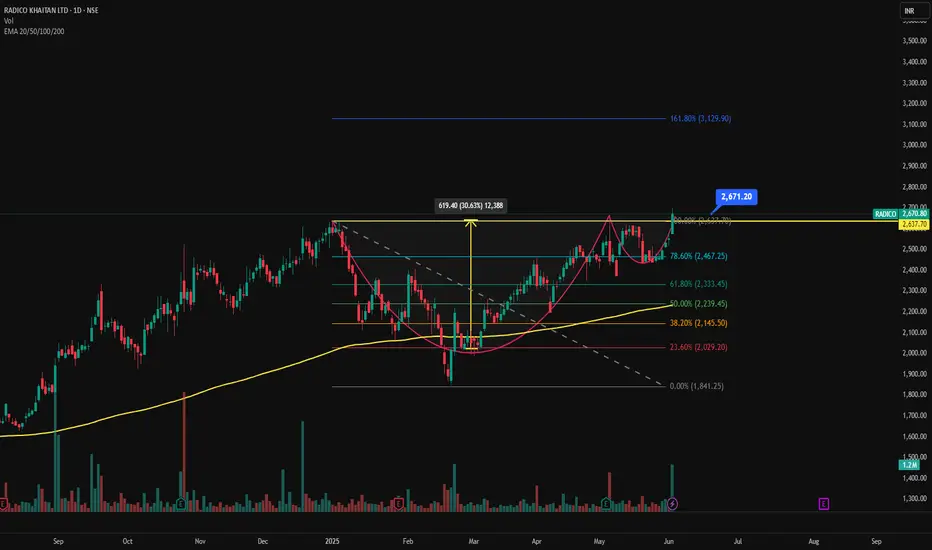
RADICO - Cup & Handle Breakout | Daily Chart📊 RADICO KHAITAN LTD (RADICO) – Cup & Handle Breakout | Daily Chart
📅 Chart Date: June 4, 2025
📈 CMP: ₹2,670.80 (+4.78%)
📍 Ticker: NSE:RADICO
🔍 Technical Breakdown
☕ Cup & Handle Breakout Confirmed
A classic Cup & Handle formation has played out with a bullish breakout above the neckline near ₹2,640–₹2,670. The pattern is well-structured, showing clear accumulation followed by a rounded bottom and brief consolidation.
📏 Measured Target:
The height of the cup (~₹620) projects an initial target near ₹3,129, aligning closely with the 161.80% Fibonacci Extension level.
⚙️ Indicators Used
🔹 Chart Pattern: Cup & Handle
📐 Fibonacci Retracement & Extension
📊 Volume Spike: Strong breakout volume
📈 EMA Cluster: 20/50/100/200-day — bullish alignment
🟢 EMA Support: Price sustaining well above EMAs; 200 EMA ~₹2,000
📍 Key Price Levels
✅ Breakout Zone: ₹2,640–₹2,670
🚀 Upside Targets:
📈 127.20% – ₹2,853
📈 161.80% – ₹3,129
📈 200% – ₹3,352 (extended swing target)
🛡️ Support Levels:
₹2,467 – 78.6% Fibo
₹2,333 – 61.8%
₹2,145 – 38.2%
₹2,029 – 23.6%
🔻 Invalidation/Stop: Closing below ₹2,467 (strong Fibo + EMA support zone)
💼 Trading Strategy
Entry: On breakout retest or strong close above ₹2,670
Stop Loss: ₹2,467
Target Range: ₹2,853 – ₹3,129 – ₹3,350+
Timeframe: Short to medium term swing
⚠️ Disclaimer
This analysis is for educational purposes only. Please do your own research or consult a financial advisor before making trading/investment decisions.
INDIAN BANKINDIANB - The stock has broken out of the ascending channel and is now above the horizontal resistance around 625. This breakout is supported by strong volume, confirming bullish momentum and a clear higher highs and higher lows pattern, indicating a bullish trend. Price action is respecting the trendline well before the breakout—immediate resistance 655 and 670, and short-term target 695.

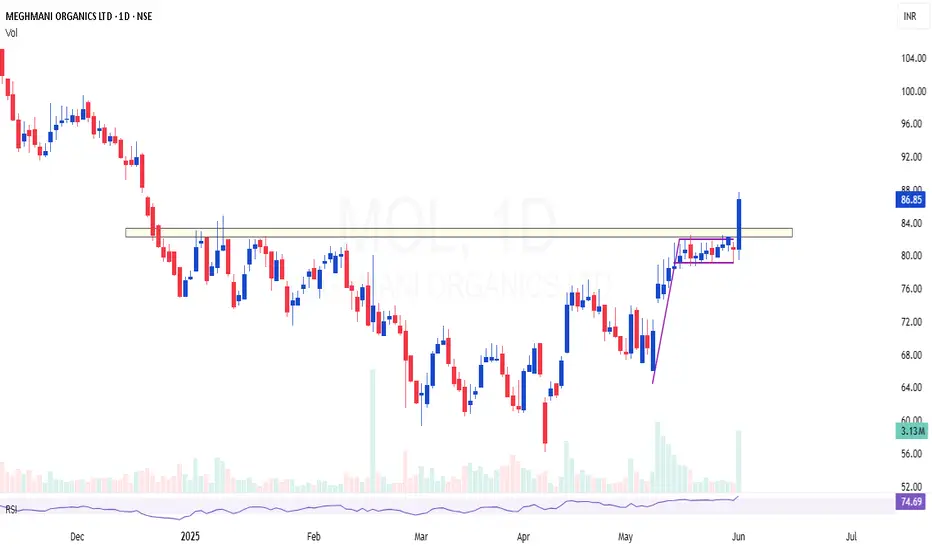
MOL | Breakout Above Supply Zone | Flag + 200 EMA ConfluenceMOL | Strong Breakout Above Supply Zone | Flag + 200 EMA Confluence
Previously shared around the ₹70 level — now showing clear strength with a decisive breakout above the supply zone, backed by strong volume.
✅ Breakout Confirmation: Price has convincingly breached previous resistance, which now acts as support. The volume accompanying this move adds weight to the breakout.
📈 Flag Formation (Daily Timeframe): A clean bull flag is visible on the daily chart — a classic continuation pattern indicating further upside potential.
📉 200 EMA Support: The 200 EMA is holding well and aligns perfectly as a dynamic support, reinforcing the current bullish structure.
🧾 Fundamentals Supporting the Technicals: Recent quarterly results suggest the bottom may already be in place, adding a fundamental tailwind to the technical setup.
🟢 Conclusion: This zone offers an excellent area of value for swing traders and position holders. Watch for sustained momentum and retests as potential entries.
BEPL | Yet another good monthly candle at excellent areaBEPL | Yet another good monthly candle
Excellent area of value at this location
Breakout after 7 years consolidation and retesting
High probable setup for doubling
CMP : 119

PEL : Swing Pick#PEL #trendingstock #breakoutstock #Momentumstock
PEL : Swing Trade
>> Trending setup
>> Breakout candidate
>> Stock in Momentum
>> Rounding bottom in formation
>> Low Risk High Reward Trade
Swing Traders can lock profit at 10% and keep trailing
Disc : Charts shared are for Learning purpose and not a Trade recommendation
Consult a SEBI Registered Advisor before taking position in it.
The Above Stock analysis is done purely on the technical basis only & Technical analysis is also 100% full proof. so i reserve the right to be wrong, if thats d case it will be learning experience.

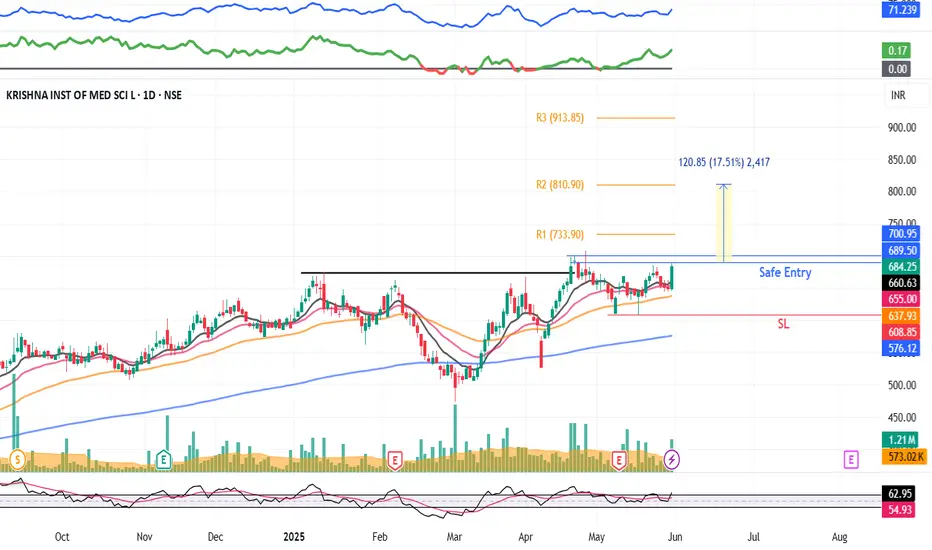
KIMS : Swing pick#KIMS #Swingtrade #trendingstock #breakoutstock
KIMS : Swing Pick
>> Breakout Stock
>> Trending setup
>> Good Strength in Stock
>> Good Volumes Buildup
>> Good Upside Potential
Swing Traders can lock profit at 10% and keep trailing
Disc : Stock charts shared are for Learning purpose not a Trade recommendation.
Consult a SEBI Registered Advisor before taking position in it.