Buy Premier Explosives Short Term Trading Advice by Goodluck Capital
Buy Premier Explosives
Buy Range- 444 - 466
Target- 520 - 540
StopLoss- below 400
Upside Potential- 15% -20%
Approx trade duration 20 - 25 days
Swingtrading

Vascon Engineers – Weekly CT BreakoutA clean Weekly CT breakout supported by strong volume (19M+), signaling strength. Key levels and structure:
🔍 Technical Breakdown:
📏 CT Line (White): Clean breakout from weekly closing-based counter-trendline
🕵️ Hidden Line (Dotted White): Secondary hidden resistance cleared
🟧 ₹45.49 Zone: Major gap-up area on DTF – key retracement demand zone
🔵 200 DEMA (Blue Line): Historical resistance now flipped – strength confirmed
🟥 Supply Zone (₹78–₹83): Overhead resistance – long-term target zone
📈 Volume: 🔥 Spiked to 19M+ – highest since Jan ‘24 – confirms breakout strength

ONWARD TECHNOLOGIES LTD📊 ONWARD TECHNOLOGIES LTD (1D) – CMP ₹313.00
📅 Published on: May 17, 2025
📈 Exchange: NSE
📌 Ticker: ONWARDTEC
🔍 Technical Chart Analysis
✅ Trendline Breakout:
A clean downtrend line breakout is visible on the daily chart, marking the end of a prolonged bearish phase. Price has decisively broken above the falling resistance trendline with a sharp bullish candle and strong volume confirmation.
✅ Volume Surge:
Breakout occurred with a 17.76% gain and significantly higher volume (1.23M), hinting at strong buying interest and possible institutional accumulation.
✅ Fibonacci Retracement Zones (from swing high ₹731.00 to low ₹207.30):
38.2% – ₹407.40
50.0% – ₹469.20
61.8% – ₹531.00
78.6% – ₹618.95
100% – ₹731.00
✅ Support Confirmation:
The price held the multi-year support zone around ₹207.97, which aligns with the 0.00% Fibo level, forming a strong base for reversal.
🧱 Key Support & Resistance Levels
🟩 Support Zones:
₹207.97 (Major long-term support)
₹265–270 (Breakout retest zone if pullback happens)
🟥 Resistance Zones (Fibonacci-based):
₹407.40 (38.2% FIB)
₹469.20 (50.0% FIB)
₹531.00 (61.8% FIB - Golden Ratio)
₹618.95
₹731.00 (Previous ATH)
📉 Timeframe: Daily (1D)
📈 Sentiment: Turning Bullish
💡 Conclusion:
After a long correction, ONWARDTEC has shown a breakout with strong volume from a downtrend line. Holding above ₹300 levels can open room for targets near ₹407–₹469 and beyond. A good setup for swing traders looking for reversal entries.
📌 Disclaimer:
This analysis is for educational and informational purposes only. Not financial advice. Please consult your advisor before making investment decisions.

SARLAPOLY - Cup & Handle Breakout With Fibonacci Confluence📊 SARLAPOLY – Cup & Handle Breakout with Fibonacci Confluence
🕰️ Timeframe: 1D | 📐 Pattern: Cup Formation + Trendline Breakout
🔍 Technical Overview:
SARLAPOLY has completed a Cup pattern and given a strong breakout above the descending trendline resistance, accompanied by a massive volume spike.
The breakout aligns well with the 61.8% Fibonacci retracement level (~₹100.94), increasing confidence in the breakout's validity.
🔑 Key Technical Levels:
🔵 Resistance / Upside Targets:
₹117.88 (Fib 78.6%)
₹120.00
₹123.68
₹125.00
₹127.90
₹132.25 (100% Fib retracement)
🔴 Support Zones:
₹101.13 (recent breakout level / Fib 61.8%)
₹94.66 (previous resistance zone – now support)
₹91.27 (Fib 50%)
₹69.07 (23.6% Fib + structure support)
📊 Volume & Indicators:
📈 Breakout Volume Surge – Volume confirmation indicates institutional interest and breakout strength.
🧮 Fibonacci Retracement – Plotted from swing low (₹50.30) to swing high (₹132.25), gives clear confluence zones.
🔺 Trendline Breakout – Downward sloping trendline broken cleanly, confirming bullish intent.
☕ Cup Formation – Classic rounding bottom visible, suggesting accumulation phase is complete.
🧠 Bias: Bullish
📉 Watch for a retest around ₹100–₹101 zone as a potential re-entry point with SL below ₹94.66 for positional swing.
⚠️ Disclaimer: This is an educational analysis and not financial advice. Always do your own research before making investment decisions.
📈 Follow @PriceAction_Pulse for more price action setups, breakout alerts, and swing trade ideas!
💬 Comment below if you’re watching SARLAPOLY for the next leg up 📊

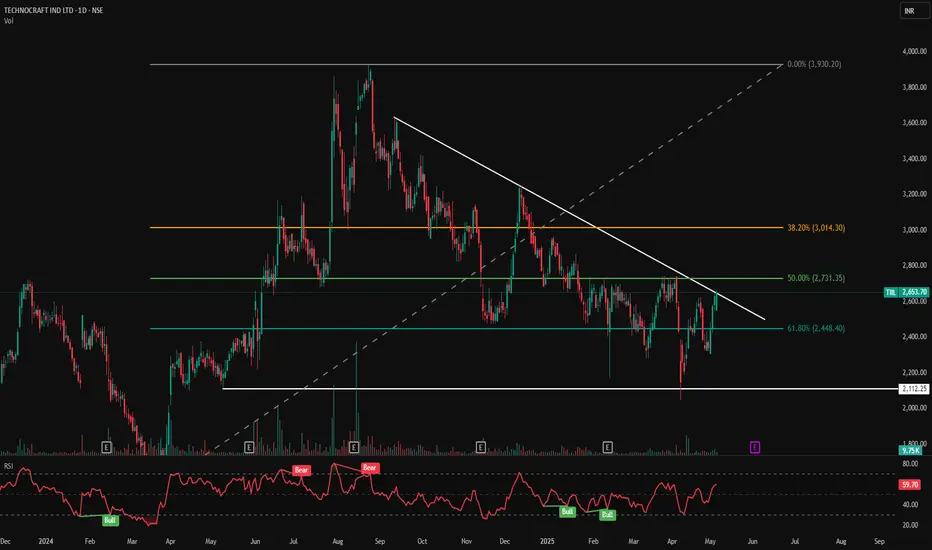
TILL - Descending Trendline Breakout Watch📊 TIIL – Descending Trendline Breakout Watch | Key Fib Retest in Play
🕰️ Timeframe: 1D | 🧭 Pattern: Descending Triangle | 🎯 Fibonacci Reversal Setup
📈 Technical Analysis Summary:
TIIL is currently approaching a major trendline resistance, drawn from its all-time high. After a long downtrend, the stock is now testing the 50% Fibonacci retracement level at ₹2,731.35 with rising momentum.
The price is hovering near a breakout zone and consolidating just below resistance, hinting at potential bullish continuation. A successful breakout can open gates to much higher levels, especially toward the 38.2% Fib zone and beyond.
🔍 Chart Highlights:
⚪ Descending Trendline: Key multi-month resistance line
🟢 Current Price Action: Holding above 61.8% Fib (₹2,448.40) and pushing toward 50% zone (₹2,731.35)
🔵 Base Support: ₹2,112.25 (previous structure low)
📈 Volume: Gradual build-up near resistance zone
🔴 RSI (14): Currently at 59.70 – neutral-to-bullish, showing higher lows
📍 Bullish RSI Icons: Highlighted near recent bottoms, indicating accumulation zones
📌 Support & Resistance Levels:
Type Level (₹)
🔼 Resistance 1 2,731.35 (Fib 50%)
🔼 Resistance 2 3,014.30 (Fib 38.2%)
🔻 Support 1 2,448.40 (Fib 61.8%)
🔻 Support 2 2,112.25 (Major horizontal support)
🧭 Trading Setup Overview:
✅ Bias: Bullish if price breaks and closes above trendline and ₹2,731
💡 Entry Watch: Break and hold above ₹2,731.35 with volume
🛑 Invalidation: Close below ₹2,448.40 (61.8% Fib)
🎯 Upside Targets: ₹3,014 → ₹3,500+ (based on structure)
💬 Conclusion:
TIIL is at a critical juncture with a high-probability trendline breakout setup in play. The Fibonacci confluence, improving RSI, and rising volume indicate a bullish bias. Watch for a strong breakout candle above ₹2,731 for potential positional opportunities.
⚠️ Disclaimer: This chart is shared for educational purposes. Kindly consult your financial advisor before making any trading decisions.
🔔 Follow @PriceAction_Pulse for more high-probability swing setups and technical chart breakdowns!
📌 Save & share if TIIL is on your breakout watchlist!
PREMEXPLN - Cup & Handle Breakout | Volume Surge📊 PREMEXPLN – Cup & Handle Breakout | Volume Surge + Key Fibonacci Confluence!
🕰️ Timeframe: 1D | 📐 Pattern: Cup & Handle | 📊 Momentum: Bullish
📈 Technical Chart Overview:
Premier Explosives has executed a clean breakout above a long-term descending trendline and a cup & handle base with a massive spike in volume, hinting at a powerful trend reversal.
Price surged nearly +19% intraday, confirming strength near the 61.8% Fibonacci retracement from the previous swing high at ₹910.30 to the swing low at ₹253.40.
🔍 Chart Highlights:
☕ Cup & Handle Pattern: Formed over several months, signaling accumulation and breakout
📐 Descending Trendline: Broken with strength and volume confirmation
📊 Volume Spike: Volume highest since April 2024 – strong buyer interest
🟢 Breakout Zone: ₹472.65–₹480.00 (key previous resistance)
🔴 RSI (14): At 67.72 – approaching overbought zone, suggesting strong momentum
🧱 Support & Resistance Levels:
Level Type Price (₹)
🔼 Resistance 1 504.10 (Fib 61.8%)
🔼 Resistance 2 581.10 (Fib 50%)
🔼 Resistance 3 659.90 (Fib 38.2%)
🔻 Support 1 440.00 (Breakout Retest Zone)
🔻 Support 2 308.75 (Horizontal demand zone)
🔻 Support 3 253.40 (100% Fib low)
🔧 Indicators Used:
Fibonacci Retracement – Plotted from ₹910.30 to ₹253.40
RSI (14) – Showing bullish divergence and breaking out of consolidation
Volume Bars – Confirming breakout with institutional strength
Bull/Bear Icons – Track momentum shifts visually over RSI
🧭 Trade Outlook:
✅ Bias: Bullish
🛒 Entry Zone: Retest near ₹472.65–₹480 (ideal pullback entry)
🎯 Targets: ₹504 → ₹581 → ₹660+
❌ Invalidation: Close below ₹440 with volume
💬 Summary:
PREMEXPLN looks strong on the daily chart after breaking a classic cup & handle pattern with volume confirmation. The breakout aligns perfectly with Fibonacci retracement zones, suggesting room for continued upside. Monitor for a potential retest entry.
⚠️ Disclaimer: This is a technical analysis chart for educational purposes only. Do your own research and consult a financial advisor before trading.
🔔 Follow @PriceAction_Pulse for more breakout charts, swing trades & price action insights!
💾 Save and share if PREMEXPLN is on your watchlist this week.

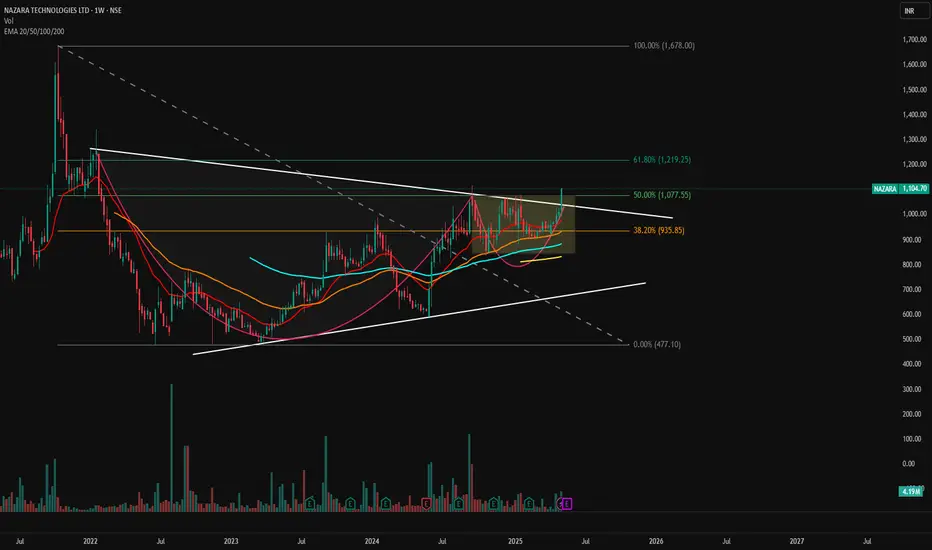
NAZARA - Breakout from Long-Term Falling Wedge📊 NAZARA – Breakout from Long-Term Falling Wedge | Strong Weekly Momentum
🕰️ Timeframe: Weekly | 💥 Pattern: Falling Wedge Breakout | 🔥 Sentiment: Bullish
📈 Chart Overview:
Nazara Technologies has broken out of a multi-year falling wedge on the weekly chart, with a strong green candle above key EMAs and Fibonacci confluence zones. Price closed the week above ₹1,100, indicating a shift in long-term momentum and a potential start of a fresh uptrend.
🔍 Technical Highlights:
📉 Falling Wedge Pattern: Multi-year consolidation now broken on strong volume
💥 Breakout Candle: Price closed above trendline resistance and key Fibonacci 50% level
🧠 Volume Surge: Volume confirmation signals institutional interest
📊 EMA Confluence: Price trading above 20/50/100/200 EMAs – bullish alignment
🧱 Support & Resistance Levels:
Level Type Price (₹)
🔼 Resistance 1 1,219.25 (Fib 61.8%)
🔼 Resistance 2 1,678.00 (Previous ATH / Fib 100%)
🔻 Support 1 1,077.55 (Fib 50% – breakout zone)
🔻 Support 2 935.85 (Fib 38.2% + EMA cluster)
🔻 Support 3 820–860 (multi-touch horizontal support & EMA 200)
🔧 Indicators Used:
Fibonacci Retracement – Plotted from swing low ₹477.10 to high ₹1,678.00
EMA 20/50/100/200 – Price is now above all EMAs, showing trend shift
Volume Bars – Confirming strong breakout
Chart Pattern – Falling wedge (typically bullish)
📌 Chart Sentiment & Setup:
✅ Bias: Strongly Bullish
📍 Breakout Level: ₹1,077
🎯 Upside Targets: ₹1,219 → ₹1,320 → ₹1,678
❌ Invalidation: Sustained close below ₹935 with volume
📢 Summary:
Nazara is showing signs of a structural breakout after prolonged downtrend and consolidation. The falling wedge breakout, confirmed by volume and EMA crossover, sets up a long-term bullish outlook. A retest of the ₹1,075–₹1,100 zone could offer a high-probability entry.
🧠 Pro Tip: Wait for a weekly candle close and minor pullback to the breakout level before entry.
⚠️ Disclaimer: This is a technical analysis post meant for educational purposes only. Please do your own research or consult a financial advisor before investing.
🔔 Follow @PriceAction_Pulse for more actionable swing setups, breakout alerts, and chart breakdowns!
MACD + RSI Divergence Combo – The Deadly Entry Trick!Hello Traders!
In today’s educational post, we’ll break down one of the most powerful technical setups used by pro traders – the MACD + RSI Divergence Combo . When used together, these indicators don’t just show momentum — they reveal high-probability reversal zones. This setup can help you time perfect entries and avoid false breakouts or breakdowns.
Why Combine MACD and RSI Divergence?
MACD Divergence shows when the price is moving in one direction, but momentum is fading — a clear warning of potential reversal.
RSI Divergence helps confirm overbought/oversold conditions and adds strength to the reversal signal.
Combining Both gives double confirmation, increasing accuracy of entries with minimal lag.
How to Trade This Combo Setup
Step 1: Identify Divergence on MACD
Look for a higher high in price but a lower high on MACD (bearish divergence) or lower low in price with higher low on MACD (bullish divergence).
Step 2: Confirm with RSI Divergence
Now check if RSI also shows a similar divergence pattern. If yes — the setup is strong.
Step 3: Enter with Candle Confirmation
Wait for a strong reversal candle (like engulfing, hammer, or shooting star) before entering the trade.
Step 4: Place Stop-Loss
Place SL below recent swing low (for long) or above swing high (for short).
Step 5: Ride the Move with Trailing Stop
Use support/resistance or moving averages to trail your stop-loss and let profits run.
Rahul’s Tip
One divergence = a warning. Two divergences = a sniper entry!
This combo setup reduces noise and gives you clarity — especially during range-bound markets or weak trends.
Conclusion
The MACD + RSI Divergence Strategy is a reliable tool for spotting trend exhaustion and entering before the crowd. Combine this with proper candle confirmation and risk management, and you’ll have a deadly weapon in your trading toolkit!
Have you tried using this combo before? Drop your experience in the comments and let’s learn together!
If you found this post valuable, don't forget to LIKE and FOLLOW!
I regularly share real-world trading setups, actionable strategies, and learning-focused content — all from real trading experience, not theory. Stay connected if you're serious about growing as a trader!

Explosive Price Action in Premier Explosives – The Name Says It 🧠 Key Technical Insights:
✅ Main Counter-Trendline (CT) Breakout:
A clean breakout above the white CT line with a strong, high-volume bullish candle. This confirms a reversal of the prior corrective structure.
✅ Hidden Resistance Cleared:
The breakout also pierced a WTF hidden line (dotted white), further validating momentum.
✅ SD Conversion Zone Flip:
The green zone highlights a supply-to-demand flip. Price has respected this zone multiple times and now turned it into strong demand support — a textbook S→D conversion.
✅ Candle Structure:
The breakout candle not only has volume and size, but also follows a healthy higher low structure — signifying smart accumulation.

ECLERX | Ideal Retracement Zone Identified📉 White Lines — Multiple DTF trendlines, including the key falling counter-trendline (CT), were decisively broken. The breakout marks the end of a strong downward structure with excellent follow-through.
🟧 Orange Line — Major Monthly Time Frame (MTF) resistance lies just overhead.
🔍 Breakout Candle:
Exceptionally strong with a close near high.
Backed by 1.83M volume, showing strong institutional interest.
Pattern size is large — adding weight to the structural reversal.
⚠️ Caution: A large portion of the move seems to have already played out within one candle. Chasing here risks poor R:R due to limited space before overhead resistance.
📐 Strategy Setup:
Fibonacci Retracement plotted on the breakout candle.
Ideal entry zone highlighted in green between the 0.382 to 0.5 levels
This zone represents a healthy and probable pullback area, offering better risk-reward alignment for potential continuation.
🧭 Trade Idea: Avoid chasing. Instead, watch for a retracement to the green zone. If price reacts positively there, it could offer a technically strong R:R opportunity while staying aligned with the broader breakout narrative.

HEROMOTOCO | Weekly Breakout Analysis📉 Yellow Line — Weekly Counter-Trendline (WTF CT) resistance finally broken with conviction. This line guided the entire downtrend and its breach signals a strong structural shift.
📈 Red Parallel Channel — A hidden resistance channel formed during the recent consolidation phase. Price climbed within this tight range and has now broken out, confirming internal strength and directional intent.
🟧 Orange Horizontal Line — Major Monthly Time Frame (MTF) resistance, which now acts as the next crucial target. The breakout candle has enough space to breathe before testing this overhead level.
⚪ White Dotted Line — Daily Time Frame (DTF) counter-trendline that had already been broken earlier, providing early signs of reversal. Serves as a great precursor to the higher timeframe breakout.
📊 Volume: Weekly breakout accompanied by ~5.57M volume — exceeding the 50K benchmark required for WTF breakout validation. Strong institutional interest is evident.
🟩 Structure: Price has formed a higher low base and broke out cleanly above all marked resistances — a sign of strength across all timeframes.

Big Bank BREAKOUT! Canara Bank Ready📉 Breakdown of the Setup:
✅ WTF CT (White Lines): 3+ confirmed touches → clean descending counter-trendline.
✅ Hidden Resistance (Dotted White Line): Clear breakout above key hidden level. Historic reaction zone.
✅ MTF Resistance (Yellow Line): Long-term resistance just above; nearing test zone (confluence resistance area ahead).
✅ Green Zone (Support/Resistance Flip):
Acted as strong support in 2024.
Fake breakdown trap ✔️
Price back above = bullish bias reinstated.
✅ Volume Surge: 124M+ on breakout candle ➕ major bullish close.

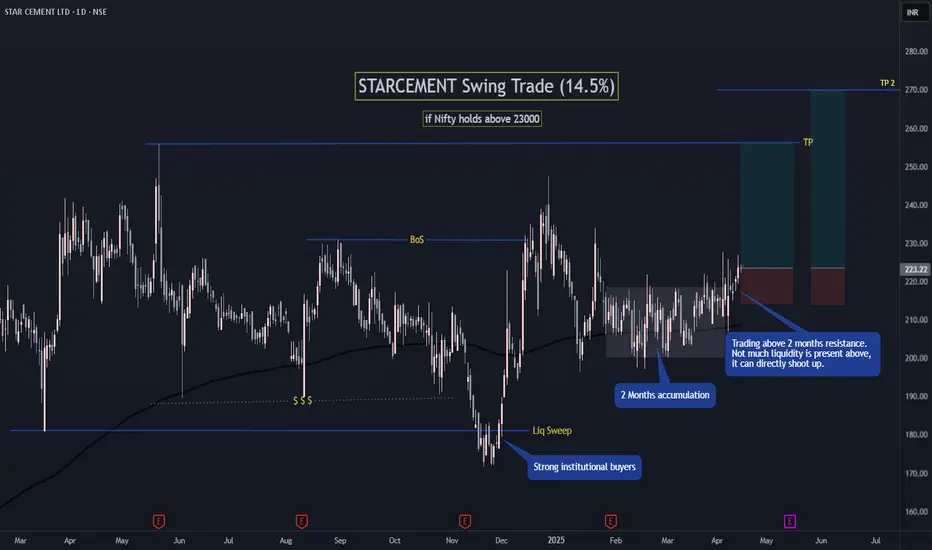
STARCEMENT Swing Trade (14.5%)If Nifty holds above 23000 then Star Cement can go 14.5% to 20% up.
It sweeped major liquidity at a demand zone and gave a BoS, which shows a bullish trend.
From last 2 months the price was consolidating in a zone, but now price has started trading above the resistance of this zone.
Not much liquidity is present above. Price can directly shoot up to ATH.
with1:3 minimum RR.
Follow for more such setups.
TAJGVK – Bullish Reversal in Play | Swing Targets Ahead
Stock: TAJ GVK HOTELS & RESORTS (NSE: TAJGVK)
Date: May 13, 2025
CMP: ₹407.90 (+12.66%)
🔍 Technical Overview
TAJGVK has shown a strong bullish reversal from a major weekly support zone, indicating a potential end to the corrective structure (A)-(B)-(C) and opening room for a strong upside swing.
📊 Key Levels & Structure
🟧 Weekly Support Zone (₹330.60 – ₹340.00)
Major historical demand zone.
Price reversed sharply from this level, confirming bottom (C).
🔴 Stop Loss (₹369 – Daily Close Basis)
Any daily close below ₹369 invalidates the bullish outlook.
Crucial for risk management.
🎯 First Target: ₹500
Previous resistance zone and psychological level.
Likely to see initial profit booking or consolidation here.
🔄 Interim Pullback Zone: ₹460–₹470
Minor retracement zone before continuation toward second target.
Healthy correction expected before breakout.
✅ Second Swing Target: ₹549 – ₹576
Extension level based on Fibonacci projections.
Strong upside potential if ₹500 is breached with volume.
💡 Trade Plan
Entry Zone: ₹385 – ₹395 (on dips)
Stop Loss: ₹369 (daily close basis)
Targets:
📌 Target 1: ₹500
📌 Target 2: ₹549 – ₹576
Risk-Reward: ✔️ Attractive R:R setup with defined structure.
📌 Conclusion
TAJGVK is presenting a well-structured bullish reversal pattern with clear levels and a favorable entry zone. Strong bounce from weekly support suggests bulls are back in control. This setup is ideal for swing traders looking for a high probability move.
💬 Share your thoughts or similar setups you're watching!
👍 Like & Follow for more technical breakdowns and swing trade ideas!
#TAJGVK #SwingTrading #NSE #TechnicalAnalysis #PriceAction #TrendReversal #StocksToWatch

MAN INDUSTRIES – Explosive CT Breakout with Volume Cluster Surge🔴 CT Breakout: The red trendline marks a major weekly CT, now decisively breached by a strong bullish candle.
📈 Volume Cluster Breakout: This is not a one-week spike — it's a cluster of multiple high-volume weeks, indicating consistent accumulation before the breakout. Current volume stands tall at 2.23M+, validating this move.
🟢 Demand Zones Respected: Price respected key demand zones (green boxes) on multiple occasions, forming a strong base with higher lows.
⚪ Hidden Resistances Cleared: Two dotted white hidden resistance lines have been cleanly taken out, suggesting deeper supply has been absorbed.
🟥 Supply Zone Ahead: The next visible hurdle, giving the current move significant open air to run.

TATA MOTORS – Textbook CT Breakout on Weekly Chart🔍 Key Technical Highlights:
✅ CT Breakout: Clean break above a long-standing counter-trendline drawn from the November 2024 highs. The breakout is decisive, with the latest weekly candle closing convincingly above the CT.
✅ Volume Confirmation: Weekly volume surged to ~9M, confirming strong participation behind the breakout — a critical condition for higher timeframe setups.
✅ Simple Base at 200 EMA: Price formed a simple base right at the 200-week EMA, absorbing selling pressure and building strength before the breakout. This acts as a reliable launchpad, often seen in high-quality setups.
✅ EMA Recovery: The breakout candle reclaims the 200 EMA, a strong sign of trend reversal and institutional interest.

SYNGENE – Structure speaks before the move.
✅ Long-term demand zone held
✅ Capitulation + sharp V-reversal
✅ Clean leg forming, higher highs possible
📈 720–740 looks probable if this rhythm holds
No indicators. No noise. Just price and levels.
Because in trading, simplicity is underrated.
#LessIsMore #SYNGENE #ChartReading #SwingTrade #PriceAction #TradingViewIndia #SmartMoneyMoves #TechnicalAnalysis

NIIT LTD - Bullish Reversal Setup📊 NIIT LTD – Bullish Reversal Setup
🕰️ Timeframe: 1D | 🧩 Pattern: Double Bottom
🔍 Technical Chart Overview:
NIIT is showing a strong Double Bottom reversal pattern on the daily chart — a classic signal of potential trend reversal from bearish to bullish.
After bouncing from the major support zone near ₹105, the price has broken out above the neckline (around ₹133.5) on strong volume, indicating bullish conviction.
🔑 Key Technical Levels:
🔵 Resistance Levels:
₹159.70
₹171.50
🔴 Support Levels:
₹133.50 (neckline retest zone)
₹127.90 (minor support)
₹105.00 (base support)
📈 Breakout Confirmation:
Price has broken above the neckline with a high volume spike, confirming the double bottom breakout.
Next targets lie in the ₹159–₹171 range, aligning with previous supply zones.
📊 Volume & Price Action Notes:
Recent bullish candles with above-average volume
Potential retest of neckline could offer a favorable risk-reward entry
🧠 Bias: Bullish (as long as price holds above ₹133.5)
📌 Chart Indicators Used:
📉 Volume Spike confirmation
🔃 Double Bottom Pattern
🔍 Key S/R Levels marked
📍 Entry/Target Path projection with arrow
⚠️ Disclaimer: This analysis is for educational purposes only and not financial advice. Please DYOR before making trading decisions.
📈 Follow for more actionable chart patterns | PriceAction_Pulse
💬 Drop a comment if you're tracking NIIT!

Fear-Greed Loop–How Your Mind is Programmed to Fail in Trading!Hello Traders!
Today, let’s break down one of the most powerful traps in trading psychology – the Fear-Greed Loop . This loop is why so many traders lose money, even with good setups and solid strategies. Understanding this can be the difference between being stuck in emotional trades and becoming a consistent trader.
What is the Fear-Greed Loop?
The Fear-Greed Loop is a cycle that most retail traders fall into:
Greed takes over when the market moves in your favor, making you ignore your targets and hold for “just a bit more.”
Fear kicks in when the market reverses, and instead of exiting with small gains or small losses, you freeze, hoping it will bounce back.
This leads to poor decisions, such as revenge trading, early exits, and holding onto losing trades.
How to Break the Loop
Set predefined rules for entries, exits, and stop-loss. Don’t rely on emotions.
Use position sizing that keeps your mind calm, even when trades don’t go your way.
Journal your emotions after each trade – this reveals recurring patterns and helps fix behavior.
Don’t chase profits . Consistency and discipline bring long-term gains, not excitement.
Rahul’s Tip
When in doubt – pause . The best traders don’t trade all the time, but they’re always watching, learning, and acting only when the odds are in their favor.
Conclusion
If you keep losing despite having good setups, the problem may not be the strategy – it’s the loop. The Fear-Greed cycle is built into us , but the pros learn to master it. Now it’s your turn to take control.
Have you experienced this loop before? How did you overcome it? Drop your thoughts in the comments!

Reliance - Price action channel + Candlestick + RSIKey Observations from the Chart
Channel Structure -
Both resistance and support lines have been tested multiple times with precise reactions
The most recent price action shows a strong rejection at the lower channel boundary
Candlestick Formation-
This month printed a textbook strong lower wick rejection candle:
Long lower wick indicates buyers aggressively stepping in at support
RSI Confluence-
The RSI tells a compelling complementary story:
Recently retested COVID-era levels (historic oversold territory)
Has since established higher highs and higher lows (bullish structure)
Shows positive divergence with price (RSI making HHs while price tests support)

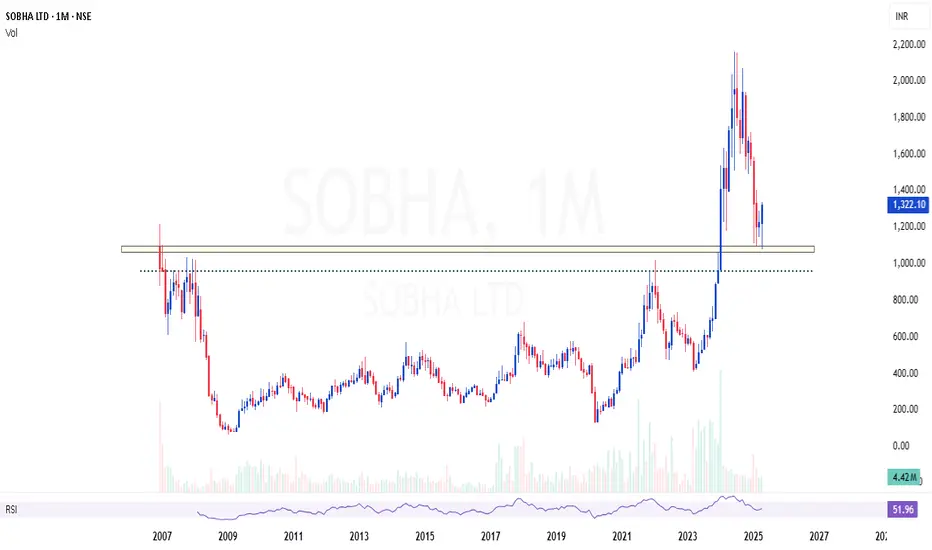
SOBHA | Excellent area of value - Looks strong buySOBHA | Excellent area of value in monthly time frame - Looks strong buy
Showing strong reversal candles at support
CMP : 1322 (Dip : 1000)
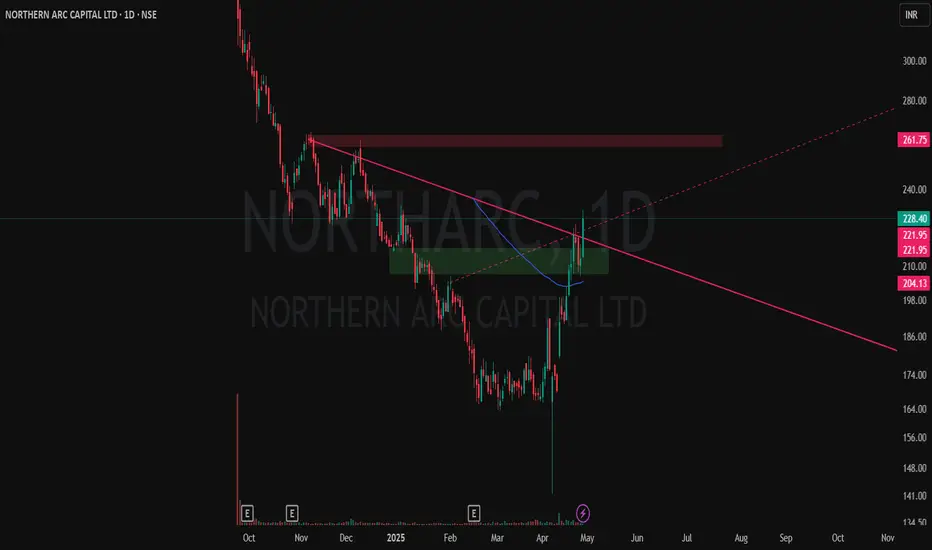
NORTHERNARC | Simple Price action Textbook CT breakout confirmed on the Daily chart:
✅ Strong demand zone formation with clear upward push
✅ Multiple volume spikes signaling institutional activity
✅ Clean Counter-Trendline (CT) breakout
✅ Hidden resistance line (dotted) also broken — extra confluence
✅ Immediate supply zone above marked for next watch
Breakout candle closed strong with momentum. Setup aligns with high-conviction strategy criteria — watching price action near supply for continuation or base formation.
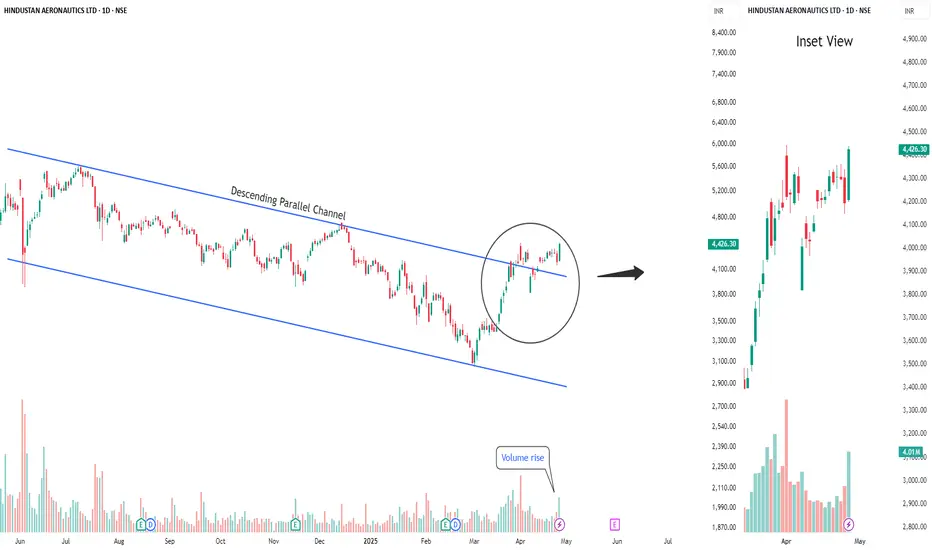
Buy Hindustan Aeronautics Limited Short Term Trading Advice by Goodluck Capital
Buy Hindustan Aeronautics Limited
Buy Range- 4250 - 4400
Target- 4600 - 4700
StopLoss- below 4100
Upside Potential- 6% -9%
Approx trade duration 14 - 15 days