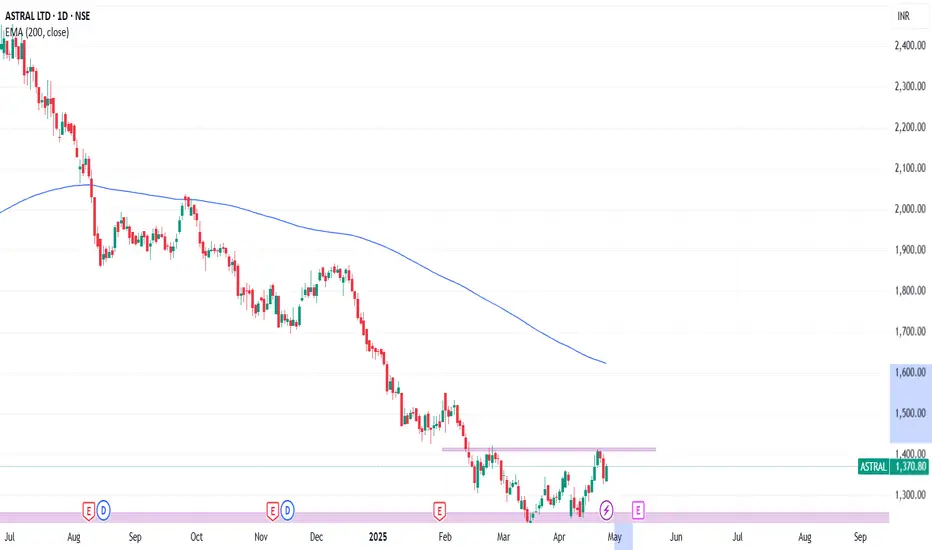
SWING IDEA for ASTRAL LTD for upto 10% to 50% in coming days. As the weekly and daily TF were in down trend but it seems like bottom has been formed with the confirmation of double bottom on weekly TF and can be traded either after breakout or another confirmation of the triple bottom confirmation at the trend lines.
#HAPPYTRADING # SWINGTRADING #SWINGIDEAS
this is pure technical analysis.
Swingtrading
MOL | One more time - trying to take position with stoplossMOL | One more time - trying to take position with stoploss
As this is my favorite stock, but its under performing for a long time. This setup looks good for 50-60% for short term.
Trendline + Small channel breakout
CMP : 70
SL : 65
Target : 110
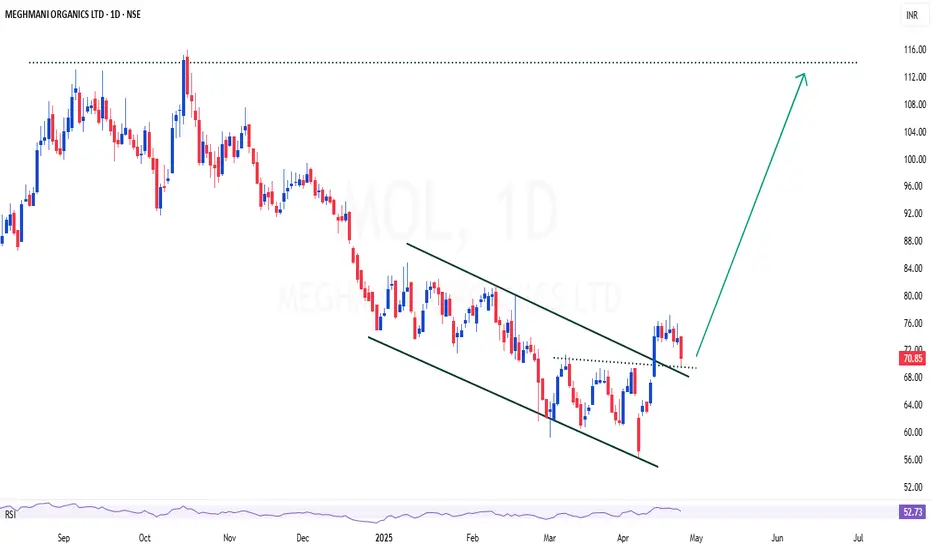
Mangalore chemical:(Ready to shoot up); Take a look; Min 50% RoiHuge potential is there.
For short term investment ;
Leave a " Like If you agree ". 👍
.
.
Wait for Breakout & then Daily candle to close above - "135"
.
If you want to enter now "Go for it with stoploss".
.
.
Enter after Price Breaks
"Yellow box" mentioned.
.
Don't make complicated trade set-up.📈📉
Keep it " simple, focus on consistency " 💹
Refer our old ideas for accuracy rate🧑💻
Valuable comments are welcomed-✌️
.
Follow for regular updates.👍

POWER GRID - INVERSE HEAD & SHOULDERS BREAKOUTSymbol - POWERGRID
Power Grid Corporation of India Ltd. is a Maha-ratna Public Sector Enterprise and a key player in the Indian power transmission sector. It operates as a central transmission utility and is involved in the planning, implementation, and maintenance of transmission systems across the country.
Recently, the stock has exhibited a notable bullish breakout after forming an Inverse Head and Shoulders pattern. A classic reversal formation signaling a shift from a downtrend to an uptrend. Following the breakout, the stock may witness a retest of the neckline zone, which now acts as a support area - around 300 to 303 range. This zone offers a favorable risk-reward entry for positional investors anticipating further upside.
The projected target from this breakout lies near the 350-355 zone, offering a potential 17-20% upside from current levels, based on the height of the pattern added to the breakout point.
For prudent risk management, a stop loss below 280 is advisable, just below the right shoulder, to protect against unexpected downside.
Overall, the breakout of a well-formed Inverse Head and Shoulders on a higher time frame charts presents a bullish outlook for Power Grid, making it a strong candidate for medium-term investment consideration.
Disclaimer: The information provided here should not be construed as a buy or sell recommendation. It reflects my personal analysis and my trading position. Please consider this trading idea for educational purposes only. Thank you!

MEDANTA Swing Trade ( 20% )If Nifty holds above 24000, then Medanta can reach ATH because all the below liquidity got sweeped.
Also Medanta is in up-trend in daily and weekly time-frame.
It sweeped recent weekly low.
Upside potential - 20%, RR of more than 1:5
Follow for more such setups. Thanks.

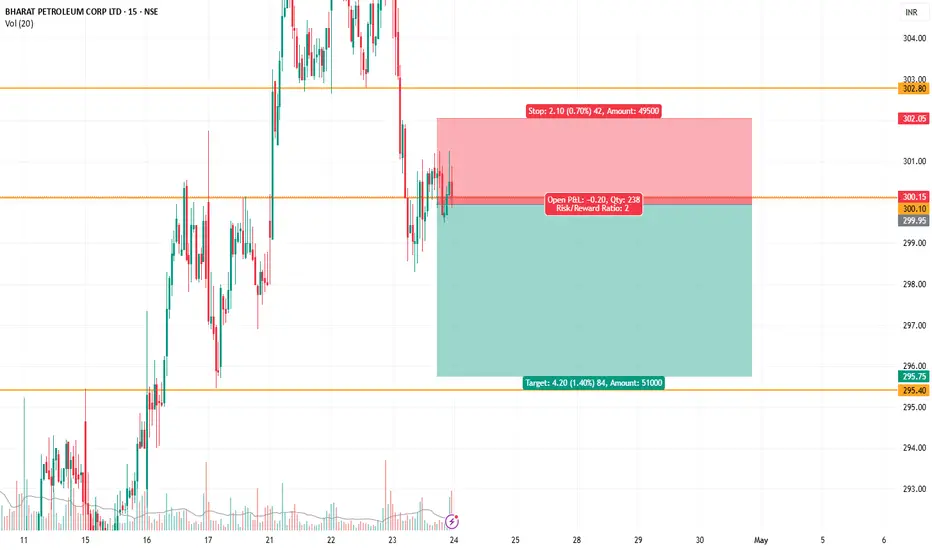
BPCL shorting oppurtunity - Intraday/SwingBPCL has fomed an HNS pattern on 15 mins time frame and is now forming a bearish flag patten. The entry tgt and SL are mentioned in the chart.
TCI Swing Trade ( 20% upside)Transport Corporation of India (TCI) has started new up-trend on Weekly and Daily time-frame from strong Institutional buying levels.
It is good time to build positions in this stock. Don't go for hard stop loss. Manage position as it can take 1-2 months for the targets to reach and will shake out week buyers in between.
If nifty holds above 23900, TCI has 20% upside potential with 1:7 Risk Reward.
Follow and connect with me for more such setups.

WAAREE ENERGIES LTD - Cup Breakout with Rising RSI⚡ WAAREE ENERGIES LTD – Cup Breakout with Rising RSI
🕒 Timeframe: 1D | NSE: WAAREENER
📅 Date: April 22, 2025
💰 CMP: ₹2,444.20
📈 Volume: 2.15M
🔍 Chart Observations
☕ Cup Formation visible on the daily chart – smooth rounding bottom structure, signifying accumulation.
📐 Breakout from Downtrend Line confirms bullish intent with strong momentum and volume.
🧱 Key Levels
🔵 Resistance Zones (Targets):
₹2,674.55 – recent swing high
₹2,869.00 – key psychological resistance
🔴 Support Level:
₹2,229.60 – neckline of cup & breakout retest zone
📉 Trendline:
Long descending trendline (white) has been broken on the upside
📊 Technical Indicators
📈 RSI (Relative Strength Index)
Currently at 63.93, comfortably in bullish territory
Recent “Bull” label marks bullish RSI divergence & breakout
Still has room to rise before overbought zone
✅ Conclusion
Cup pattern breakout with strong volume & positive RSI = bullish structure
Sustained move above ₹2,444 could invite targets of ₹2,670+ in coming sessions
Ideal setup for swing traders with a clear SL below ₹2,229
📉 Chart by: PriceAction_Pulse
📘 For educational use only. Always DYOR before making any trading decisions.

SBICARD | Monthly Timeframe Analysis🔥 Technical Breakout with a Strong Rejection Wick!
🔸 Parallel Channel Breakout
Price has convincingly broken out of a long-standing parallel descending channel (orange) — a bullish signal indicating a potential trend reversal.
🔸 Counter Trendline Broken
The white counter-trendline was broken earlier, leading to bullish momentum building up gradually. This breakout aligns with classic reversal theory.
🔸 Supply-Demand Flip Zone (Grey Box)
The price action respected the SUPPLY → DEMAND zone beautifully before launching upward, confirming it as a key area of interest.
🔸 Long Wick Rejection Candle
Notice the most recent monthly candle: a long lower wick with a strong body, closing near the highs.
🟠 Parallel Channel
⚪ Counter Trendline
⚫ Grey Supply-Demand Zone
🟥 Top Supply Zone
🟢 Bullish Rejection Candle

Muthoot Microfin LTD – Major Breakout in Play!🟦 Blue Line: 200 DEMA
Still overhead, but the recent price action indicates a potential shift in trend. Price reclaiming above this zone will be another bullish confirmation.
📌 Breakout Highlights:
Counter Trendline Breakout: Price shattered the CT-based trendline with high volume.
W-Bottom Formation: A textbook double bottom structure is visible with neckline breakout.
Green Path: Illustrates the bullish trajectory already played out post breakout.
Red Zone: Key resistance turned support — now a potential demand zone on retest.
Yellow Path: A healthy retest scenario could play out, offering better R:R entries. A pullback to the neckline before continuation would be ideal.
🔔 Keep it on your radar — structure, volume, and trend all align for a bullish bias.

HBL Engineering Ltd 🔍 1D (Daily Timeframe) Analysis: Context and Macro Structure
Structure and Key Zones:
Price is trading at ₹523.40, showing bullish intent after a recent swing low and a clean market structure shift (MSS) around April 1st.
Fair Value Gaps (FVGs) around ₹445–₹475 have been respected with a strong bullish reaction from the OB (Order Block).
There is an old bearish FVG between ₹545–₹565 that is yet to be fully mitigated.
Current price is consolidating under a small internal liquidity zone (marked blue box).
Bias:
Bullish short-term bias as price broke market structure to the upside and is now in a re-accumulation range.
Likely targets include:
Target 1: ₹545 (old supply/FVG zone)
Target 2: ₹565 (full FVG mitigation & potential liquidity sweep above recent highs)
Daily Stop-Loss Ideas:
Below ₹475 (last bullish OB/FVG zone) makes sense if taking swing longs.
⏰ 1H (Hourly Timeframe): Mid-Level Refinement
Observations:
Price made a clean Break of Structure (BOS) and CHOCH indicating a reversal around April 15th.
Strong OB formed near ₹510–₹514, has been tapped into and respected.
Volume Imbalance (VI) around ₹517–₹521 now acting as dynamic support.
Price is now in a tight range under previous high liquidity (PWH zone).
Liquidity Pools:
Above: Weak High & recent equal highs around ₹529–₹532 (magnet)
Below: PDH & OB zones near ₹510 could attract a quick liquidity grab before reversal.
Trade Idea (Intraday to Swing):
Entry Zone: ₹517–₹521 (discount OB + VI)
Stop Loss: ₹510.5 (below 1H OB + liquidity)
Target 1: ₹530 (internal high)
Target 2: ₹545 (daily FVG)
RR: Around 1:2.5 to 1:3
This trade would be based on a liquidity sweep + continuation model — a smart money setup.
⏱ 15M (Execution Timeframe): Entry Precision
Observations:
Multiple CHOCH and BOS signals around the ₹521–₹523 region.
A micro-FVG and a CMSL (consolidated mitigation zone) formed after sharp rally on April 21.
Price is now revisiting this zone, offering an ideal scalp-to-swing entry setup.
Ideal Execution Plan:
Entry Zone: ₹520.5–₹523 (FVG + CMSL)
Confirmation: Look for a bullish engulfing / break of lower timeframe CHOCH in this zone
Stop Loss: ₹518.5 (below VI zone)
Scalp Target: ₹529–₹530 (PWH)
Swing Target: ₹545+ (1D FVG zone)
🧠 ICT + SMC Narrative: What’s the Market Maker Doing?
Liquidity Engineering: The market has engineered equal highs on both 15M and 1H — textbook setup for a liquidity raid.
Displacement + Retracement: Bullish displacement occurred. Now the retrace into an OB/VI zone creates a high-probability re-entry.
Order Flow: Strong bullish OB on 1D and 1H has held. Order flow is bullish.
📌 Summary of Trade Setup
Element Value
Bias Bullish
Entry ₹520.5–₹523
Stop Loss ₹518.5 (tight) / ₹510.5 (swing)
Target 1 (Scalp) ₹530
Target 2 (Swing) ₹545–₹565
Risk:Reward (approx) 1:2.5 to 1:3
Invalidated Below ₹510 (swing bias changes)

SANDUMA-Positional Long trade-Swing tradeStock has rejected trendline multiple times. In next 1-2 session if it holds above 450 and breakout the trendline with bullish candle. Good opportunity to go long.
If it falls below 450, avoid.
Please don't forget click on follow button so you won't miss any upcoming ideas.
Any confusion, feel free to drop msg. Happy to help :)
This is only for educational purpose, please manage your risk accordingly.

Sunday Swings 20 April 2025 | Stocks and NiftyI make educational content videos for swing / positional trading
No Tips, calls or any future Predictions are done in the video, just sharing what the charts are talking .

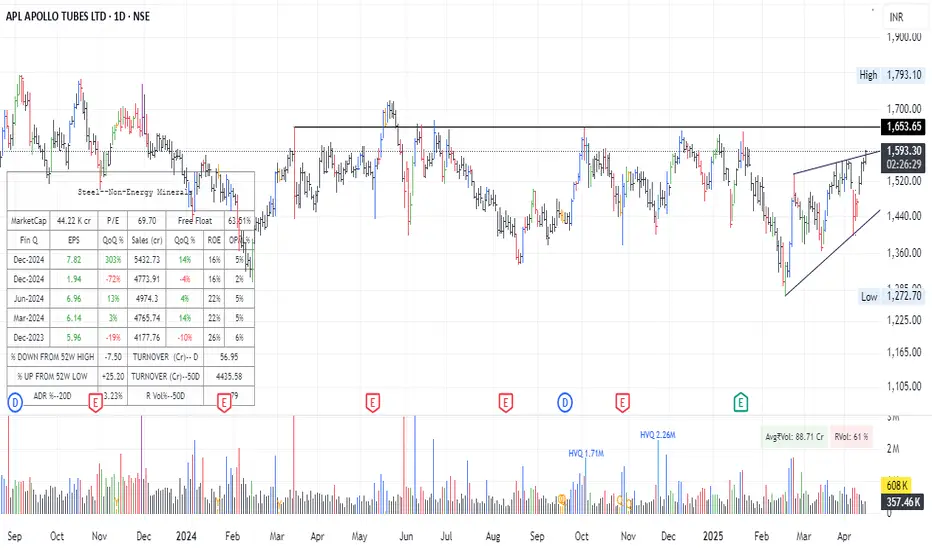
Apl Apollo Tube - ReRating Candidate !!??Stock peaked in Sep 2023.. Has been Range bound since almost 2 yrs now.. Interestingly had the best quarter ever last qtr.. Margins are stable and constant through many months.. If margins expand we are looking at a re-rating candidate.. Over all looking very interesting..
ETERNAL(ZOMATO)-Short term/positional long tradeStock has rejected trendline multiple times. From past 2 days it's holding near trendline and gone side ways.
If we see a breakout in 15th Apr'25 trading session it is good opportunity to go long.
Please avoid if goes below 218 or Opens gap down.
Please don't forget click on follow button so you won't miss any upcoming ideas.
Any confusion, feel free to drop msg. Happy to help :)
This is only for educational purpose, please manage your risk accordingly.

Breakout Alert on Ntpc Green LTD🔹 Counter Trendline Breakout (CT BO)
Price action has broken a well-respected counter trendline, indicating a potential shift in momentum from bearish to bullish. This breakout isn’t just symbolic — it's backed by conviction.
🔹 Volume-Based Confirmation
Today's bullish candle comes with significantly high volume, suggesting institutional activity and strong buyer interest. Volume is one of the most critical confirmation tools in breakout trading — and it's speaking loud and clear here.
🔹 Low → Higher Low → Breakout
A major Low was established earlier.
Price then formed a Higher Low Zone, indicating accumulation and a potential trend reversal.
The breakout candle confirms the Higher High – Higher Low (HH-HL) market structure — a classic signal of trend reversal and early uptrend formation.
🔔 Add to your watchlist.
📍 Mark the breakout zone.
📈 Let price action guide your decision.

HINDUSTAN FOODS Swing Trade (Long)Strong buyers entered again trapping the sellers on monthly time-frame and making a liquidity pool.
On daily time-frame price is in up-trend and is going up by sweeping lows.
If Nifty holds current levels of 23000, (ie. if Nifty is not bearish) then there are high chances of
HINDUSTAN FOODS reaching the target levels.
1:5 Risk to Reward
Follow me for more such simple trade setups based on Trend and Liquidity.
Happy Trading!

Multi time frame Simple analysis on SHKI make educational content videos for swing / positional trading

GMBREW Sell Trade with 1:8 RRGMBREW Sell Trade with 1:8 Risk to Reward.
Simple buyer - seller psychology based trade.
Retail buyers got trapped, in a down-trending stock which can fuel next downwards move.
Follow for more such setups.

SHRIRAMFIN Swing Trade (14.6%)After forming a Head & Shoulder pattern, retail sellers got trapped and that becomes the liquidity for next up-move from the institutional demand zone. So the trend is up.
Recently good liquidity sweep happened which can fuel next up-move in short term.
With 1:3 Risk Reward and potential 14.6% up-move.
Only if Nifty holds current levels. ie it does not go below 22,700. Otherwise exit this trade.
Follow for more such setups, comment your thoughts.

Bharti Airtel Swing TradeBharti Airtel has grabbed monthly liquidity and is ready to make ATH if overall market holds current level ie Nifty holds 22000.

The Most Powerful Gap Fill Strategy You've Never Used!Hello Traders!
Today, let’s dive into one of the most reliable and underrated trading setups – the Gap Fill Strategy on the Daily Chart . This strategy works like magic when traded with patience and proper confirmation. If you’re a swing trader looking for high-probability setups, this is a goldmine for catching reversals and trend continuation moves .
When a stock or index leaves a price gap and then returns to fill that area, it often provides a clear entry point with well-defined risk and reward .
What is a Gap Fill?
Gap Up or Gap Down: A gap is formed when the price opens significantly higher or lower than the previous day’s close.
Gap Fill: A gap fill happens when price retraces and returns to cover the gap zone fully or partially.
Why It Works: Gaps often represent emotional moves or news-based reactions. When that emotion fades, price tends to come back to “fill the gap,” offering a great opportunity.
How to Trade the Gap Fill Strategy
Chart Timeframe: Focus on the Daily Timeframe for more reliable swing setups.
Identify Clear Gaps: Look for recent gap ups or downs with strong candles and volume.
Confirmation: Wait for reversal candlestick patterns (like bullish engulfing, hammer, or doji) near the gap zone.
Entry: Enter once price enters the gap zone and shows signs of reversal.
Stop Loss: Place SL below the gap zone (for longs) or above it (for shorts).
Target: First target is the top/bottom of the gap; second target based on previous support/resistance.
When Is It Most Effective?
After News-Driven Gaps (like earnings, macro events)
At Key Support/Resistance Zones
In Range-Bound or Reversal Markets
Rahul’s Tip
Gaps get filled not always — but often! Combine this setup with volume analysis and candle patterns, and it turns into a powerful swing weapon. Trust the structure, and wait for confirmation.
Conclusion
The Gap Fill Strategy on the Daily Chart offers a simple yet effective way to catch swing trades with clean entries and exits. It’s perfect for those who can wait for the right moment rather than chase every candle.
Have you used the gap fill setup in your trading? Share your experience below and let’s grow together!

Doji Sandwich + Volume Spike = 10/10 Trades If You Spot It RightHello Traders!
Today, let’s talk about a highly underrated but powerful candlestick pattern — the Doji Sandwich . When this pattern appears with a volume spike , it can give you a high-probability breakout or breakdown setup . If you’ve ever missed strong moves because of late entries, this one’s for you.
Let’s decode how to spot it, trade it, and why it works so well.
What is the Doji Sandwich Pattern?
Structure: The pattern consists of three candles — a strong candle (bullish or bearish), followed by a Doji , and then another strong candle in the same direction as the first.
Indecision Trap: The Doji shows indecision, but the follow-up candle confirms that the previous trend will continue.
Reliability Boost: When supported by a volume spike on the third candle, it becomes a powerful confirmation of trend continuation.
How to Trade the Doji Sandwich Setup
Entry: Enter on the breakout of the third candle (closing above or below the Doji range).
Stop Loss: Place your stop loss just below the Doji (in bullish case) or above it (in bearish case).
Volume Confirmation: Make sure the third candle is accompanied by a visible volume spike — this confirms institutional activity.
Ideal Timeframe: 15min, 1hr, or Daily chart — depending on your trading style (intraday or swing).
When Does It Work Best?
Near support/resistance zones — as a continuation signal.
After a short pullback or consolidation .
In trending markets where volume confirms momentum.
Rahul’s Tip
Always combine price pattern + volume confirmation. A Doji Sandwich alone is good, but with a volume spike — it’s fire🔥. Don’t just watch it — prepare for it.
Conclusion
The Doji Sandwich pattern is one of those rare 10/10 setups when spotted correctly with volume. Simple, clean, and powerful — it can help you catch big moves early. Add it to your watchlist strategy, and you’ll never ignore this combo again!
Have you ever traded this pattern? Share your experience below, and let’s learn from each other!
