GMBREW Sell Trade with 1:8 RRGMBREW Sell Trade with 1:8 Risk to Reward.
Simple buyer - seller psychology based trade.
Retail buyers got trapped, in a down-trending stock which can fuel next downwards move.
Follow for more such setups.
Swingtrading

SHRIRAMFIN Swing Trade (14.6%)After forming a Head & Shoulder pattern, retail sellers got trapped and that becomes the liquidity for next up-move from the institutional demand zone. So the trend is up.
Recently good liquidity sweep happened which can fuel next up-move in short term.
With 1:3 Risk Reward and potential 14.6% up-move.
Only if Nifty holds current levels. ie it does not go below 22,700. Otherwise exit this trade.
Follow for more such setups, comment your thoughts.

Bharti Airtel Swing TradeBharti Airtel has grabbed monthly liquidity and is ready to make ATH if overall market holds current level ie Nifty holds 22000.

The Most Powerful Gap Fill Strategy You've Never Used!Hello Traders!
Today, let’s dive into one of the most reliable and underrated trading setups – the Gap Fill Strategy on the Daily Chart . This strategy works like magic when traded with patience and proper confirmation. If you’re a swing trader looking for high-probability setups, this is a goldmine for catching reversals and trend continuation moves .
When a stock or index leaves a price gap and then returns to fill that area, it often provides a clear entry point with well-defined risk and reward .
What is a Gap Fill?
Gap Up or Gap Down: A gap is formed when the price opens significantly higher or lower than the previous day’s close.
Gap Fill: A gap fill happens when price retraces and returns to cover the gap zone fully or partially.
Why It Works: Gaps often represent emotional moves or news-based reactions. When that emotion fades, price tends to come back to “fill the gap,” offering a great opportunity.
How to Trade the Gap Fill Strategy
Chart Timeframe: Focus on the Daily Timeframe for more reliable swing setups.
Identify Clear Gaps: Look for recent gap ups or downs with strong candles and volume.
Confirmation: Wait for reversal candlestick patterns (like bullish engulfing, hammer, or doji) near the gap zone.
Entry: Enter once price enters the gap zone and shows signs of reversal.
Stop Loss: Place SL below the gap zone (for longs) or above it (for shorts).
Target: First target is the top/bottom of the gap; second target based on previous support/resistance.
When Is It Most Effective?
After News-Driven Gaps (like earnings, macro events)
At Key Support/Resistance Zones
In Range-Bound or Reversal Markets
Rahul’s Tip
Gaps get filled not always — but often! Combine this setup with volume analysis and candle patterns, and it turns into a powerful swing weapon. Trust the structure, and wait for confirmation.
Conclusion
The Gap Fill Strategy on the Daily Chart offers a simple yet effective way to catch swing trades with clean entries and exits. It’s perfect for those who can wait for the right moment rather than chase every candle.
Have you used the gap fill setup in your trading? Share your experience below and let’s grow together!

Doji Sandwich + Volume Spike = 10/10 Trades If You Spot It RightHello Traders!
Today, let’s talk about a highly underrated but powerful candlestick pattern — the Doji Sandwich . When this pattern appears with a volume spike , it can give you a high-probability breakout or breakdown setup . If you’ve ever missed strong moves because of late entries, this one’s for you.
Let’s decode how to spot it, trade it, and why it works so well.
What is the Doji Sandwich Pattern?
Structure: The pattern consists of three candles — a strong candle (bullish or bearish), followed by a Doji , and then another strong candle in the same direction as the first.
Indecision Trap: The Doji shows indecision, but the follow-up candle confirms that the previous trend will continue.
Reliability Boost: When supported by a volume spike on the third candle, it becomes a powerful confirmation of trend continuation.
How to Trade the Doji Sandwich Setup
Entry: Enter on the breakout of the third candle (closing above or below the Doji range).
Stop Loss: Place your stop loss just below the Doji (in bullish case) or above it (in bearish case).
Volume Confirmation: Make sure the third candle is accompanied by a visible volume spike — this confirms institutional activity.
Ideal Timeframe: 15min, 1hr, or Daily chart — depending on your trading style (intraday or swing).
When Does It Work Best?
Near support/resistance zones — as a continuation signal.
After a short pullback or consolidation .
In trending markets where volume confirms momentum.
Rahul’s Tip
Always combine price pattern + volume confirmation. A Doji Sandwich alone is good, but with a volume spike — it’s fire🔥. Don’t just watch it — prepare for it.
Conclusion
The Doji Sandwich pattern is one of those rare 10/10 setups when spotted correctly with volume. Simple, clean, and powerful — it can help you catch big moves early. Add it to your watchlist strategy, and you’ll never ignore this combo again!
Have you ever traded this pattern? Share your experience below, and let’s learn from each other!

NIFTYAfter a meaningful descending triangle, an open expanding triangle has been detected. For Nifty to continue moving up, at least one support is required on this triangle, and this dip will be called as The TRUMP Effect. in.tradingview.com

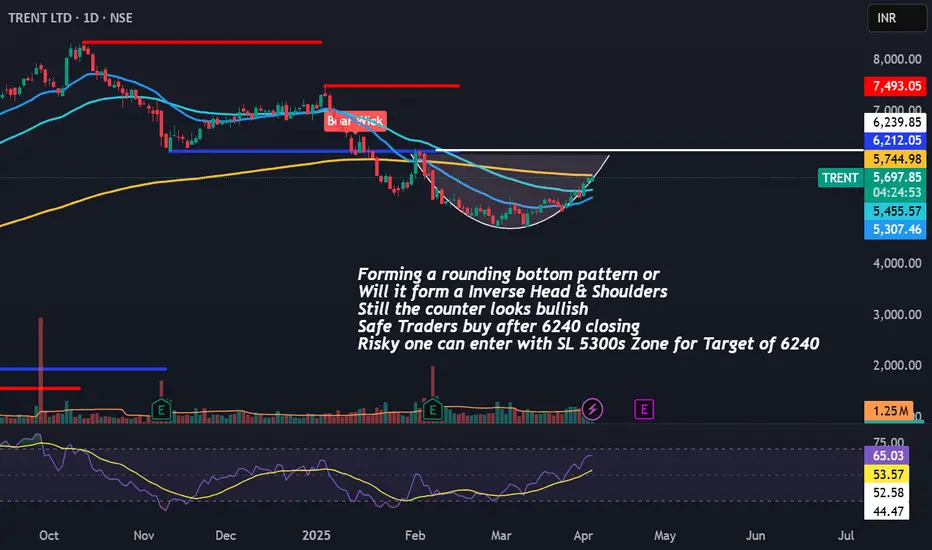
Trent Bullish Bias Target of 6240/-Forming a rounding bottom pattern or
Will it form a Inverse Head & Shoulders
Still the counter looks bullish
Safe Traders buy after 6240 closing
Risky one can enter with SL 5300s Zone for Target of 6240
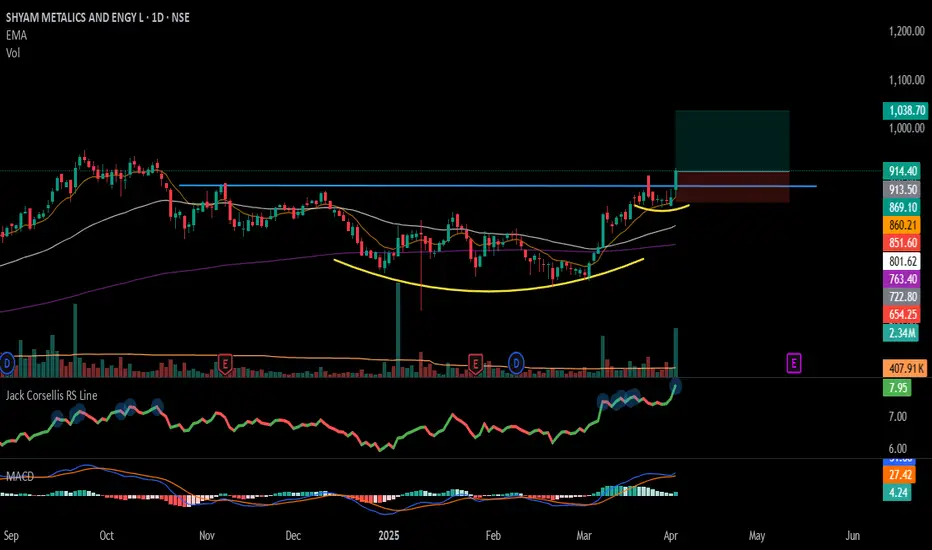
#SHYAMMETL - Cup & Handel Break Out in Daily Time Frame. 📊 Script: SHYAMMETL
Key highlights: 💡⚡
📈 Cup & Handel Break Out in Daily Time Frame.
📈 Price consolidation near Resistance & gave a BO with Volume
📈 Volume spike seen.
📈 MACD Bounce
📈 RS making 52WH
📈 One can go for Swing Trade.
BUY ONLY ABOVE 915 DCB
⏱️ C.M.P 📑💰- 914
🟢 Target 🎯🏆 – 14%
⚠️ Stoploss ☠️🚫 – 7%
️⚠️ Important: Market conditions are getting better, Position size 50% per Trade. Protect Capital Always
⚠️ Important: Always Exit the trade before any Event.
⚠️ Important: Always maintain your Risk:Reward Ratio as 1:2, with this RR, you only need a 33% win rate to Breakeven.
✅Like and follow to never miss a new idea!✅
Disclaimer: I am not SEBI Registered Advisor. My posts are purely for training and educational purposes.
Eat🍜 Sleep😴 TradingView📈 Repeat 🔁
Happy learning with MMT. Cheers!🥂
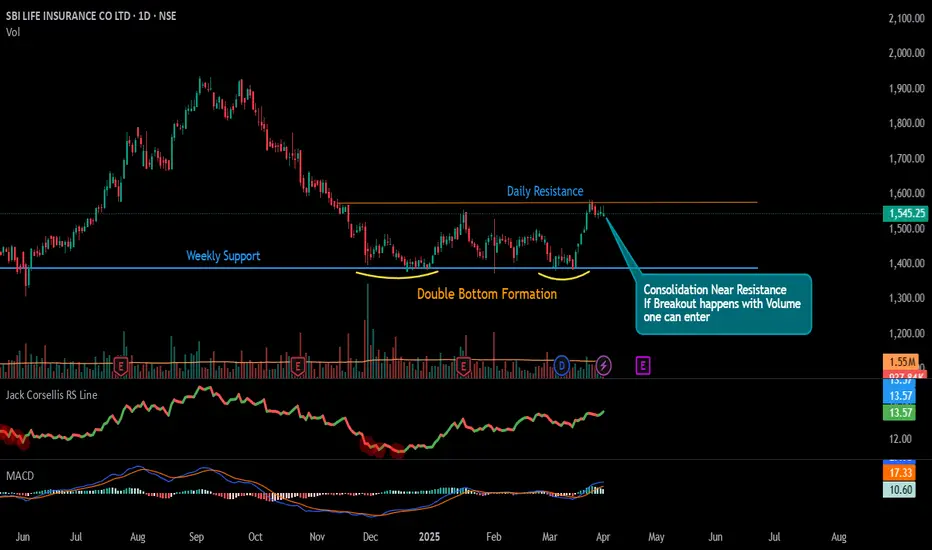
#SBILIFE – Weekly Timeframe Reversal in Play!📊 Script: SBILIFE
Key highlights: 💡⚡
📈 Double Bottom Formation in Weekly Time Frame.
📈 Price consolidation near Resistance in Daily Time Frame.
📈 Can Enter Breakout on if price sustains with volume.
📈 One can go for Swing Trade.
BUY ONLY ABOVE 1600 DCB
⏱️ C.M.P 📑💰- 1545
🟢 Target 🎯🏆 – NA%
⚠️ Stoploss ☠️🚫 – NA%
️⚠️ Important: Market conditions are not great, Position size 25% per Trade. Protect Capital Always
⚠️ Important: Always Exit the trade before any Event.
⚠️ Important: Always maintain your Risk:Reward Ratio as 1:2, with this RR, you only need a 33% win rate to Breakeven.
✅Like and follow to never miss a new idea!✅
Disclaimer: I am not SEBI Registered Advisor. My posts are purely for training and educational purposes.
Eat🍜 Sleep😴 TradingView📈 Repeat 🔁
Happy learning with MMT. Cheers!🥂
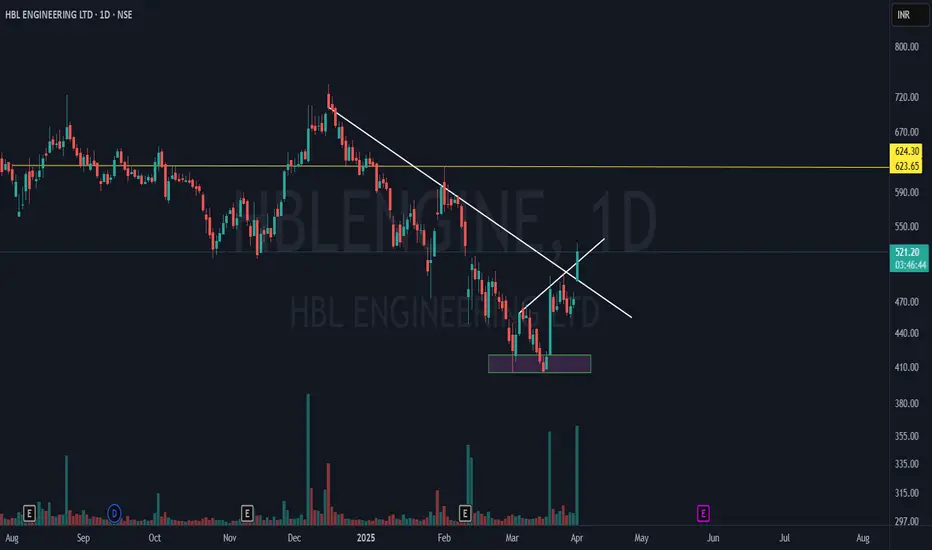
Hbl Engineering | Multi-Timeframe Breakout & Hidden Hurdles📈 Stock: HBL ENGINEERING LTD (NSE)
💰 CMP: ₹520.10 (+10.07%) - While making this Post
Key Highlights:
✅ Breakaway Gap: Opened above Critical Trendline (CT) resistance, confirming strength.
✅ Hidden Hurdle Cleared: The smaller trendline helped identify fakeouts vs. real breakouts.
✅ Strong Volume: High buying interest signals institutional participation.
✅ Next Resistance: ₹624.30 (MTF Hurdle) – a key level to watch.
🚀 Now watch for follow-through! Thoughts? Drop them below! 👇
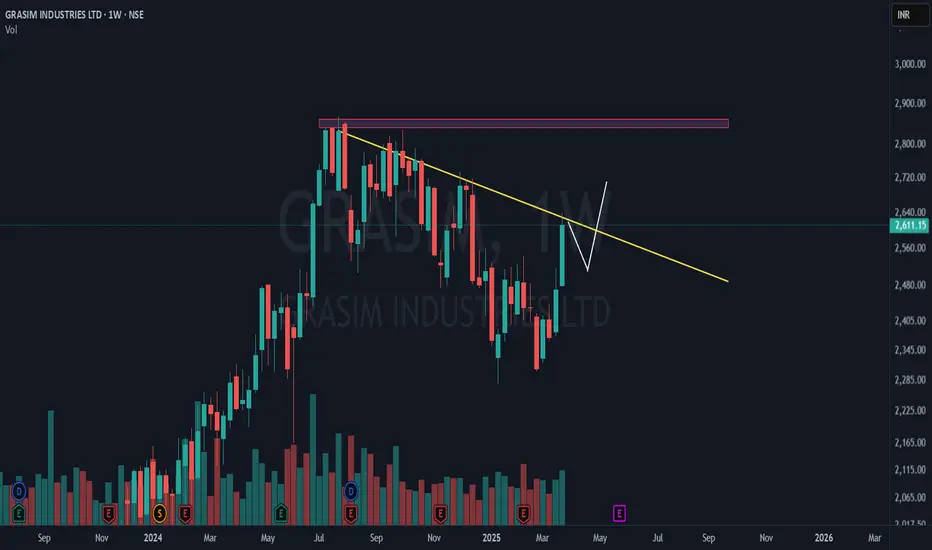
grasim industries ltd | breakout loading?📌 yellow counter trendline (ct) – A key resistance trendline on the weekly timeframe (wtf), which the stock is currently holding at. A breakout is pending .
📌 double bottom breakout – The stock has already rallied significantly after breaking out from a double bottom pattern. However, it's now in a crucial consolidation phase, needing a halt .
📌 price action roadmap – The current structure suggests either a consolidation or a minor dip, followed by a potential breakout above the yellow ct.
📌 red supply zone = major resistance – This area marks both the weekly timeframe all-time high (wtf ath) and multi-timeframe (mtf) resistance, making it a critical level to watch.
A clean breakout from here could be an "ice-break" move! 🚀 Will it break and fly or face rejection? 🤔
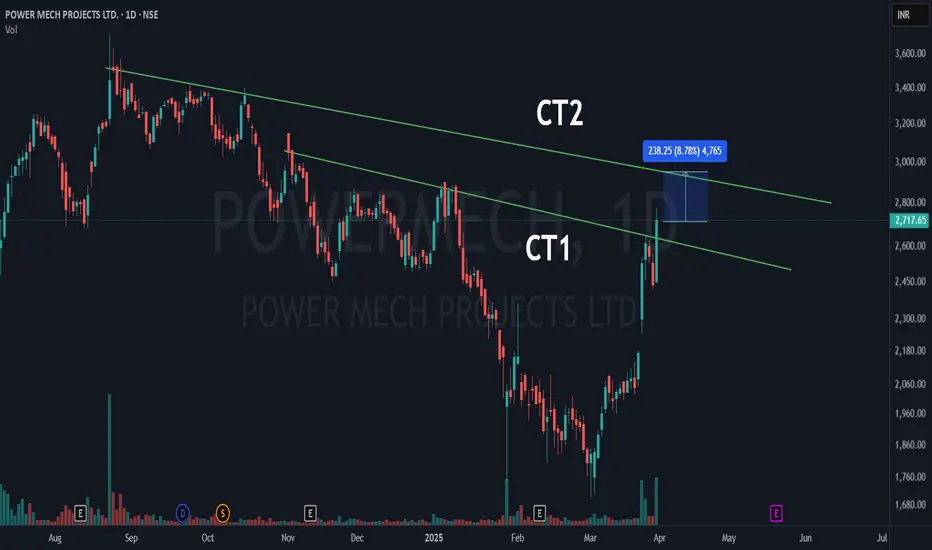
power mech projects ltd | unique DTF trade setup unfolding!📌 counter trendline 1 (ct1) – The first counter trendline (marked in green) has been successfully broken, indicating an early breakout and a shift in trend.
📌 counter trendline 2 (ct2) – The second counter trendline is the next key resistance. If the stock clears this level.
📌 two patterns in play – One pattern has already seen a breakout, while the second pattern’s resistance (ct2) still holds .
📊 volume confirmation – Increased volume supports the breakout, indicating strong participation from buyers.
Will ct2 break, or will it act as a resistance? 🤔📈
sumitomo chem india ltd | Wtf major breakout!📌 counter trendline (ct) – The yellow line that acted as resistance for the stock during its downtrend. The price has now broken above this, indicating a potential reversal.
📌 hidden line (hl) – The white line marking a key resistance level. Once this was breached, it signaled strong bullish momentum.
📌 trendline (t) – The green line acting as a long-term support. As long as the stock respects this trendline, the bullish structure remains intact.
📊 volume confirmation – A noticeable increase in volume suggests strong buyer interest, adding weight to the breakout.
What’s your take on this setup? 📈

Coal India Ltd - Breakout & Retest with Bullish MomentumCoal India Ltd has successfully broken a key resistance level and is currently retesting it, indicating potential bullish continuation. Entry zones are well-defined with a stop-loss to manage risk. Targets align with previous resistance levels, confirming strong risk-reward potential.
⚡ Key Technical Points:
- Resistance Breakout & Retest: Price has broken resistance and is retesting, a bullish confirmation signal.
- Resistance Breakout & Re-test 🔵
- Entry 1 - 401 🟢
- Entry 2 - 354 🟢 (Support Zone)
- Stop-Loss below 346 🔴 (Risk Management)
- Target 1 - 440.80 📈
- Target 2 - 502.75 📈
Why This is a Technically Strong Setup:
- ✅ Resistance Breakout & Retest: Price has broken a key resistance and is retesting it, a classic bullish continuation signal.
- ✅ Strong Support Levels: The 354 zone has acted as a solid support multiple times, making it a high-probability entry.
- ✅ Moving Averages Alignment: Price is reclaiming key moving averages, signaling trend reversal.
- ✅ Volume Confirmation: The breakout was backed by increasing volume, adding strength to the move.
- ✅ Favorable Risk-Reward Ratio: Defined stop-loss below 346 minimizes downside risk while upside targets offer a strong reward.
- ✅ Higher Highs & Higher Lows: Market structure suggests a shift to an uptrend.
🚨 No financial advice. Do your own research.

WABAG | Reversal Swing CandidateStock has corrected and now looked like formed base. Probably reversing from here.
Forming higher high Higher low
RSI is strong
Taking support on ema at daily level
Fundamentals are good.
Good for swing and long term.
SL and target for swing as given chart.

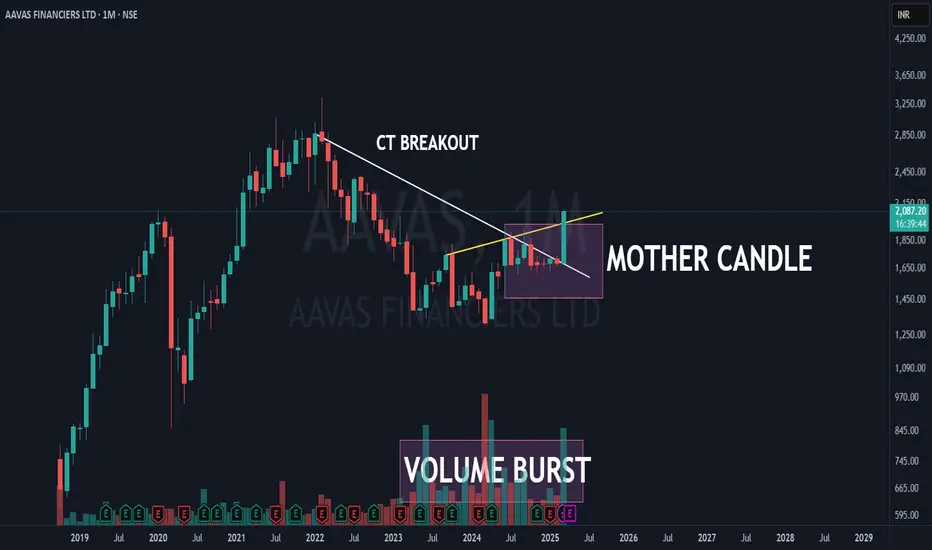
aavas financiers ltd | major monthly breakout! AAVAS is showing a strong bullish breakout on the monthly timeframe (MTF) with powerful confluence signals! Let’s break it down:
🔹 Counter Trendline (CT) Breakout ✅
Price has successfully broken the descending trendline, signaling a major trend shift.
🔹 Mother Candle Breakout ✅
The price has broken out of the mother candle's range, confirming strength.
🔹 Hidden Resistance Breach ✅
The yellow line marks a key resistance zone.
🔹 Volume Burst ✅
A significant volume spike confirms the breakout’s validity.
High participation = Strong conviction!
This is a highly bullish setup—will AAVAS continue its momentum? 📈👀
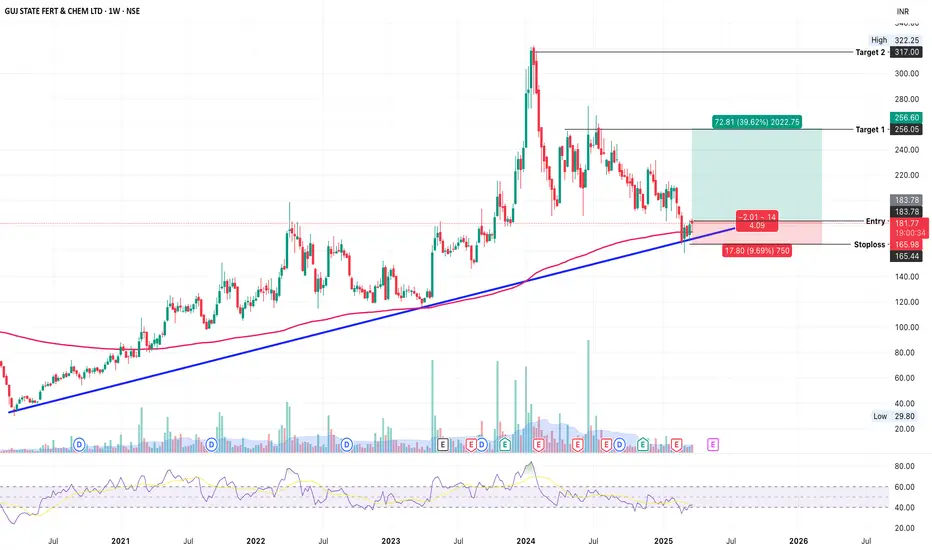
GUJARAT STATE FERT (NSE: GUJSTATFERT) Long-Term Investment GUJSTATFERT is showing signs of a strong rebound from a multi-year ascending trendline support on the weekly chart. Price action around the 200-week EMA and long-term trendline support indicates a potential fresh leg to the upside.
Key Observations:
Trendline Support: Stock has respected a rising trendline since 2020 and is currently rebounding after retesting it
EMA Alignment: Price holding just above the 200-week EMA – bullish long-term signal
Risk-Reward Setup: Entry near support offers favorable upside with defined risk
Support & Resistance Levels:
Immediate Support: ₹165
Entry: ₹183.78
Stoploss: ₹165
Target 1: ₹256
Target 2: ₹317
Major Resistance: ₹322
Indicators & Risk-Reward:
✅ RSI: Hovering around 45 – room for upward momentum
✅ Volume: Picking up near support zone, indicating accumulation
✅ Risk-to-Reward: ~1:4 – excellent long-term setup
Verdict: Bullish (Weekly Chart View)
A clean long-term trendline bounce with confluence at 200-week EMA presents a high-probability swing or positional trade setup.
Plan of Action:
BUY: ₹183.78
Stoploss: ₹165
Target 1: ₹256
Target 2: ₹317
Trailing SL: After ₹220, start trailing to lock profits
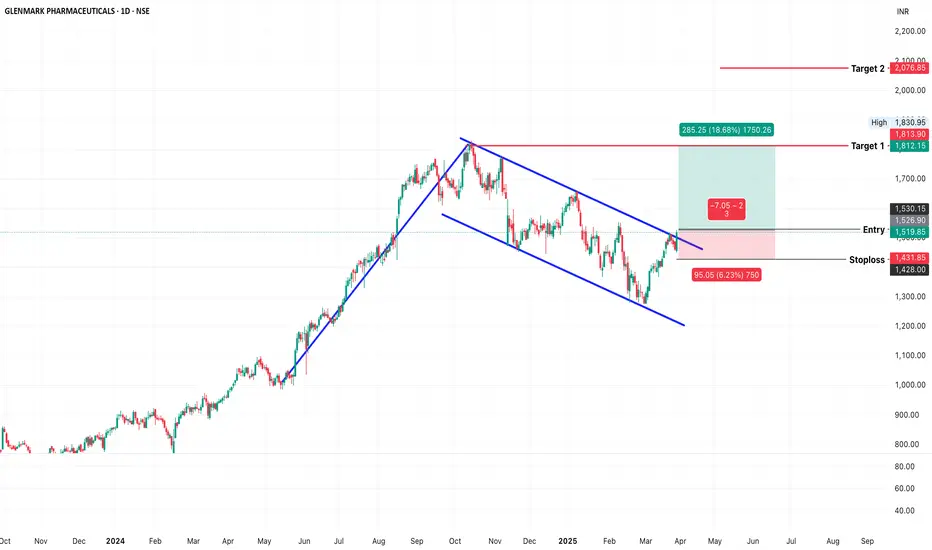
GLENMARK PHARMA (NSE: GLENMARK) – Confirmed Channel BreakoutGlenmark Pharma has confirmed a breakout from a falling wedge and flag & pole pattern , supported by strong volume and a bounce from the 200 EMA . Price structure and momentum suggest bullish continuation.
Key Observations:
Pattern Formation: Falling wedge + flag & pole since September 2024
Breakout Confirmation: Closed above upper trendline at ₹1,519.85 on March 27, 2025
200 EMA Support: Price took support at 200 EMA and reclaimed both key moving averages
Volume Spike: High volume on breakout candle validates the move
Support & Resistance Levels:
Immediate Support: ₹1,432
Breakout Level (Entry): ₹1,520
Target 1: ₹1,813
Target 2: ₹2,076
Major Resistance: ₹2,100
Indicators & Risk-Reward:
✅ RSI: 64.92 – showing strong bullish momentum
✅ Volume: Significant volume surge during breakout
✅ Risk-to-Reward: ~1:3 – ideal for swing setup
Verdict: Bullish
With pattern breakout, volume confirmation, and RSI strength, Glenmark is poised for a potential up-move.
Plan of Action:
BUY: ₹1,520
Stop Loss: ₹1,432
Target 1: ₹1,813
Target 2: ₹2,076
Trailing SL: Start trailing above ₹1,650 to protect profits
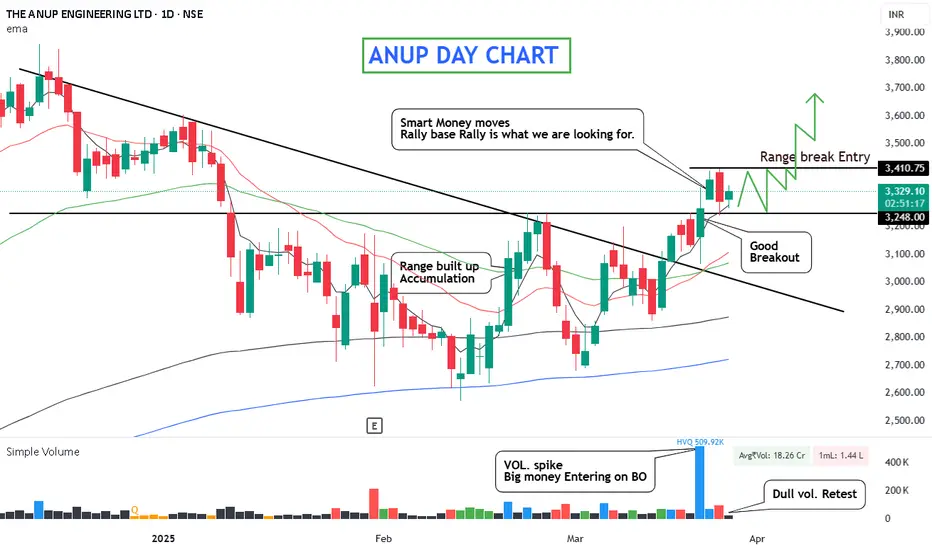
ANUP - Smart Money Inflow NSE:ANUP
ANUP Day Chart
logic - Earlier it was in a correction mode with major market but comparatively it has fallen very less to the major indexes and also maintained its major uptrend so we can say that it have not attracted heavy sellers during fall.
Then it went into a consolidation and formed a horizontal resistance zone.
Recently it have broken out with good volume and also formed a retest of 5EMA
on low volume showing low selling.
Now What?
To qualify this Setup We need a few more days of range forming a base below - 3410 level and as per setup no big red volume on the pullback bars
Where and when is the entry - As you can see on the chart entry upon break out of base and make sure volume should be high.
(Note - if the volume is very low or below the 20-day average in the previous candle it's a good sign that sellers have gone.)
Stop - can be taken below base levels
Targets - will be 10%-20% or any subsequent channel resistance area.
Follow the rules to find perfect qualifying stocks and add them to the watchlist and observe then build a base for a few days to get familiar with the stock's behaviour.
Keep learning,
Happy Trading.
#AVANTIFEED - Multi Year Breakout Candidate📊 Script: AVANTIFEED
Key highlights: 💡⚡
📈Multi Year Breakout
📈 VCP in Weekly Time Frame
📈 BO with Volume in Daily Time Frame
📈 MACD gave a Bounce
📈 Price consolidated for 6 Years
📈 One can go for Swing Trade
⚠️ Over All Market condition is bad, Practice paper trading
🟢 If you have any questions regarding the setup, please feel free to leave your inquiries in the comments, and I will respond promptly.
BUY ONLY ABOVE 800 DCB
⏱️ C.M.P 📑💰- 786
🟢 Target 🎯🏆 – 30%
⚠️ Stoploss ☠️🚫 – 15%
⚠️ Important: Always Exit the trade before any Event.
⚠️ Important: Always maintain your Risk & Reward Ratio.
✅#Boost, #Like & #Follow to never miss a new idea! ✅
Disclaimer: I am not SEBI Registered Advisor. My posts are purely for training and educational purposes.
Eat🍜 Sleep😴 TradingView📈 Repeat 🔁
Happy learning with MMT. Cheers!🥂

#SARDAEN VCP Formation in DTF - Keep In WL 📊 Script: SARDAEN
Key highlights: 💡⚡
📈 VCP BreakOut in Daily chart.
📈 Price gave a good up move and consolidated before BO.
📈 Volume spike on Breakout
📈 MACD Cross Over
📈 One can go for Swing Trade.
BUY ONLY ABOVE 511 DCB
⏱️ C.M.P 📑💰- 506
🟢 Target 🎯🏆 – 20%
⚠️ Stoploss ☠️🚫 – 108
️⚠️ Important: Market conditions are not great, Paper Trade Only. Protect Capital Always
⚠️ Important: Always Exit the trade before any Event.
⚠️ Important: Always maintain your Risk & Reward Ratio.
✅Like and follow to never miss a new idea!✅
Disclaimer: I am not SEBI Registered Advisor. My posts are purely for training and educational purposes.
Eat🍜 Sleep😴 TradingView📈 Repeat 🔁
Happy learning with MMT. Cheers!🥂

#KSCL - VCP BO in DTF📊 Script: KSCL
Key highlights: 💡⚡
📈 VCP in DTF
📈 BO with Volume
📈 MACD gave a Bounce
📈 Price consolidated for 140Days
📈 One can go for Swing Trade
⚠️ Over All Market condition is bad, Practice paper trading
🟢 If you have any questions regarding the setup, please feel free to leave your inquiries in the comments, and I will respond promptly.
BUY ONLY ABOVE 1036 DCB
⏱️ C.M.P 📑💰- 1036
🟢 Target 🎯🏆 – 16%
⚠️ Stoploss ☠️🚫 - 8%
⚠️ Important: Always Exit the trade before any Event.
⚠️ Important: Always maintain your Risk & Reward Ratio.
✅#Boost, #Like & #Follow to never miss a new idea! ✅
Disclaimer: I am not SEBI Registered Advisor. My posts are purely for training and educational purposes.
Eat🍜 Sleep😴 TradingView📈 Repeat 🔁
Happy learning with MMT. Cheers!🥂

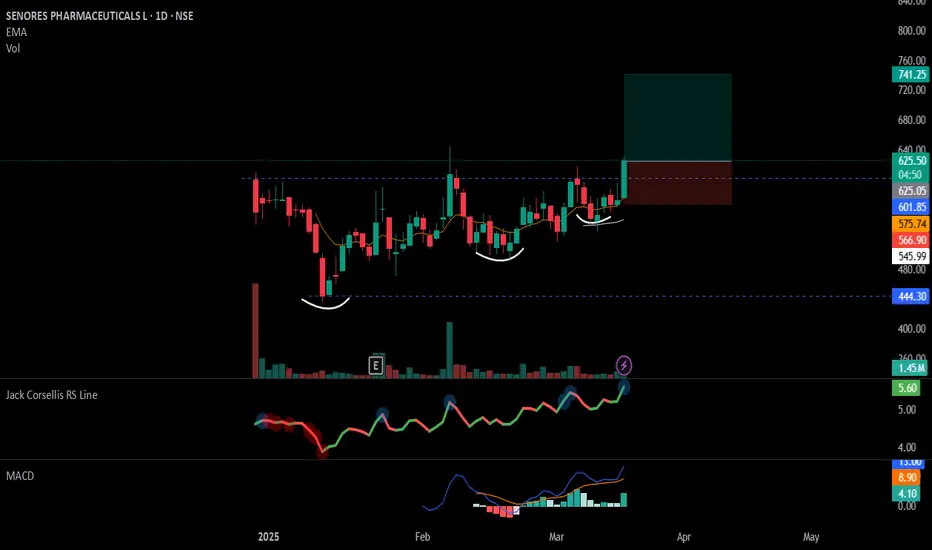
#SENORES - IPO Base Break-Out / VCP formation in Daily chart📊 Script: SENORES
Key highlights: 💡⚡
📈 VCP formation in Daily chart.
📈 IPO consolidation Break Out.
📈 Volume spike on Breakout
📈 MACD Bounce
📈 RS is making 52WH
📈 One can go for Swing Trade.
BUY ONLY ABOVE 625 DCB
⏱️ C.M.P 📑💰- 625
🟢 Target 🎯🏆 – 18%
⚠️ Stoploss ☠️🚫 – 9%
️⚠️ Important: Market conditions are getting better, Position size 25% per Trade. Protect Capital Always
⚠️ Important: Always Exit the trade before any Event.
⚠️ Important: Always maintain your Risk:Reward Ratio as 1:2, with this RR, you only need a 33% win rate to Breakeven.
✅Like and follow to never miss a new idea!✅
Disclaimer: I am not SEBI Registered Advisor. My posts are purely for training and educational purposes.
Eat🍜 Sleep😴 TradingView📈 Repeat 🔁
Happy learning with MMT. Cheers!🥂