GOOGLE - SWING TRADE IS GOING TO HAPPENGOOGLE - SWING TRADE IS GOING TO HAPPEN
Entry would be around 146 and SL is 130 for the target all time high.
Disclaimer: This is just for educational purpose.
Swingtrading

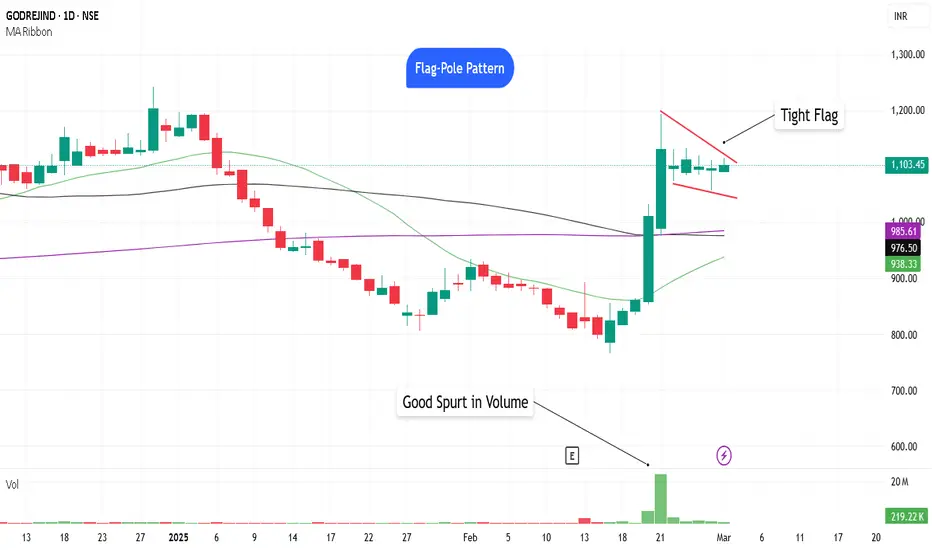
Is #GODREJIND a good setup? Let me know views on the Comment.Here is the chart of #GODREJIND.
Thought the base structure doesn't looks good, here are some of the features:
Formed a Flag-Pole Pattern
Is above 200 SMA
Good Spurt in Volume
Consolidating and forming a TIGHT FLAG
Be cautious, the Market Stance is WEAK and no Long should be initiated. Keep it on the watch list and let's see how it performs.
Let me know your views on the comment box.
Nifty at a 1000-Day Trendline Support - Finally we are here !!Nifty is currently testing a confluence of two long-term trendlines – one from the monthly timeframe (blue line) and another from the weekly timeframe (yellow line). This 1000-day trendline cluster is a major reactive support zone, making this a make-or-break level for the index.
🔍 Key Observations:
✔️ The blue trendline represents a long-term uptrend, making it a crucial level for institutional traders.
✔️ The yellow trendline, which has also acted as a dynamic support, adds strength to this zone.
✔️ A breakdown below this cluster could open doors for further downside
✔️ However, if Nifty holds this level, a strong rebound can be expected, potentially continuing its long-term bullish structure.
🚀 What’s Next?
A weekly close below this zone could accelerate selling pressure.
If buying emerges, this could be a great risk-reward trade for swing and positional traders.
Price action confirmation is key before making any major trading decisions!
🔥 Will this historical support hold, or is a deeper correction coming? Drop your thoughts in the comments! 👇

PARAGMILK By KRS Charts24th Feb 2025 / 11:42 AM
Why PARAGMILK?
1. Fundamentally Undervalued Stock with Good Financial figures. 🎯
2. Technically, Wave counts wise It is in last leg of correction.🔥
3. After Wave count it is showing Higher Low as per Dow Theory. ✅
4. +OB with FVG is visible, most importantly reversal is confirmed by Green Candle from 50% Encroachment. 📈
5. RSI is above 40. which is good for swing Trade buy side.
Expected Target Short and Med T is posted in Chart 👆
SL as per Closing basis in 1D.

CNXFINANCE seems stronger compared to NIFTY50. Disagree?Refer to the enclosed comparison of NSE:CNXFINANCE and $NIFTY50.
NSE:CNXFINANCE looks stronger than $NIFTY50 and is evidenced by some Finance sector stocks coming out of the base.
Have a look at NSE:BAJFINANCE , NSE:BAJAJFINSV , NSE:CHOLAFIN , NSE:CHOLAHLDNG and NSE:SHRIRAMFIN
But given the Market Stance, which is too Weak, I prefer to Watch all these stock than trade.
What's your view?

GBPNZD - Channel Boundaries in Play! What’s Next?The weekly chart of GBPNZD shows price action respecting an ascending channel structure. The pair has been moving within a well-defined ascending channel since early 2023.
GBPNZD weekly chart highlights price action within an ascending channel structure with key levels in play. Watch for bullish opportunities near the support zone at 2.1400–2.1800 or bearish continuation if price breaks below this zone. What’s your bias? Let me know in the comments! #GBPNZD #Forex #TechnicalAnalysis
Disclaimer:
This analysis is for informational purposes only and should not be considered financial advice. Forex trading involves significant risk of loss and may not be suitable for all investors.

Undervalued Hero MotorCorpAiming for a 40% gain from here. It’s a positional call and a good value to consider. Fundamentally strong and technically favorable as well.
🚨DYOR
🚨SL must, it depend's on your risk appetite

#INDIANHUME - Reversal Pattern (W Bottom Pattern)📊 Script: INDIANHUME
Key highlights: 💡⚡
📈 W Bottom Pattern at Demand Zone
📈 Deman Zone tested
📈 W Bottom Pattern BO in DTF
📈 Volume Spike Seen
📈 MACD can give a Bounce
📈 Price consolidated for 31Days
📈 One can go for Swing Trade
⚠️ Over All Market condition is bad, Practice paper trading
🟢 If you have any questions regarding the setup, please feel free to leave your inquiries in the comments, and I will respond promptly.
BUY ONLY ABOVE NA DCB
⏱️ C.M.P 📑💰- 373
🟢 Target 🎯🏆 – NA%
⚠️ Stoploss ☠️🚫 – Below Swing Low%
⚠️ Important: Always Exit the trade before any Event.
⚠️ Important: Always maintain your Risk & Reward Ratio.
✅#Boost, #Like & #Follow to never miss a new idea! ✅
Disclaimer: I am not SEBI Registered Advisor. My posts are purely for training and educational purposes.
Eat🍜 Sleep😴 TradingView📈 Repeat 🔁
Happy learning with MMT. Cheers!🥂

BEML - Confluence of Supports Suggests a Potential Reversal!The weekly chart of BEML indicates a potential reversal as the stock approaches a critical confluence of support levels. After a significant correction from its all-time high, the price is now testing key technical levels that could act as a strong base for a bullish reversal.
Key Observations:
1. 200-Week EMA Support:
- The price is currently hovering near the 200-week EMA, which has historically acted as a strong dynamic support zone in trending markets.
2. Fibonacci Retracement:
- The stock is approaching the 0.618 Fibonacci retracement level, which is widely regarded as a golden ratio for potential reversals during corrections.
3. Potential Bullish Reversal:
- If the stock holds above this critical support zone, it could initiate a reversal toward higher levels.
---
Let me know your thoughts in the comments! #BEML #TechnicalAnalysis #SwingTrading"
---
Disclaimer:
This analysis is for informational and educational purposes only and does not constitute financial advice. Trading involves risk, and past performance is not indicative of future results. Always conduct your own research and consult with a qualified financial advisor before making any investment decisions.

Bajaj Finance - Breakout Confirmed! Heading Toward ₹11,850?Bajaj Finance (BAJFINANCE) has broken out of its multi-year consolidation range with strong momentum. The ascending trendline and breakout suggest a bullish continuation toward ₹11,850. Watch for pullbacks to enter long positions.
Key Observations:
1. Ascending Trendline Support:
- The stock has consistently respected the ascending trendline since 2021, with multiple bounces (marked by green arrows), indicating strong bullish momentum.
2. Breakout Above Resistance:
- After consolidating between for nearly two years, the price has finally broken above the resistance zone, confirming a bullish breakout.
3. Upside Potential:
- Based on the height of the previous consolidation range, the breakout target is projected at ₹11,850.
5. Strong Base Support:
- The ₹6,500–₹7,000 zone remains a strong support area in case of any pullbacks.
---
Disclaimer:
This analysis is for informational and educational purposes only and does not constitute financial advice. Trading involves risk, and past performance is not indicative of future results. Always conduct your own research and consult with a qualified financial advisor before making any investment decisions.*

Axis Bank - Reversal from Support? Bullish Continuation Ahead!Axis Bank weekly chart shows a potential reversal setup as it tests key support levels: the lower boundary of an ascending channel and the 200-week EMA. If bullish confirmation emerges, this could present an excellent swing trade opportunity. Let me know your thoughts in the comments! #AXISBANK #TechnicalAnalysis #SwingTrading"
Key Observations:
1. Ascending Channel Support:
- The price is currently testing the **lower boundary of the ascending channel**, which has acted as dynamic support since 2020.
2. 200-Week EMA Support:
- The **200-week EMA is providing additional support, reinforcing the likelihood of a bounce from this level.
3. Bullish Structure Intact:
- Despite the recent correction, the overall trend remains bullish as long as the price respects the channel's lower boundary.
5. **Upside Potential**:
- If the reversal materializes, the price could aim for the midline of the channel and eventually retest the upper boundary.
---
Disclaimer:
This analysis is for informational and educational purposes only and does not constitute financial advice. Trading involves risk, and past performance is not indicative of future results. Always conduct your own research and consult with a qualified financial advisor before making any investment decisions.

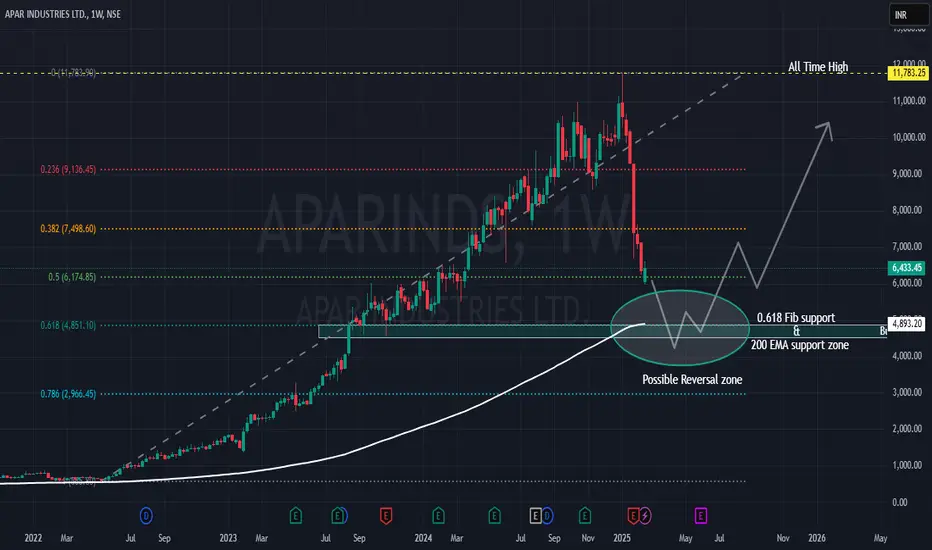
APARINDS - Fibonacci & EMA Confluence: A Reversal Opportunity?The weekly chart of *APAR Industries (APARINDS) suggests a potential reversal setup as the price approaches a critical confluence of support zones. After a strong upward rally, the stock is undergoing a healthy correction, which could provide an opportunity for long-term investors or swing traders.
Key Observations:
1. Fibonacci Retracement Support:
- The price is nearing the 0.618 Fibonacci retracement level, a key level often respected in trending markets.
2. 200-Week EMA Support:
- The 200-week EMA aligns closely with the Fibonacci level, adding further strength to this zone as potential support.
3. Reversal Zone Highlighted:
- The green rectangle zone marks the support zone suggesting a high probability of reversal.
So, APAR Industries (APARINDS) is approaching a critical support zone defined by the confluence of the 0.618 Fibonacci retracement and the 200-week EMA. This area has historically acted as strong support and could provide an excellent opportunity for long trades if bullish signals emerge. Let me know your thoughts in the comments! #APARINDS #TechnicalAnalysis #SwingTrading"
---
Disclaimer:
This analysis is for informational and educational purposes only and does not constitute financial advice. Trading and investing involve significant risk of loss. Always conduct your own research and consult with a qualified financial advisor before making any investment decisions.
Mastering Market Structure: The Perfect Swing Trade SetupUnderstanding actionable areas is the key to profitable trades. This chart shows how to identify a strong zone and apply your setup at the right time rather than chasing trades blindly.
A Resistance Identified: A breakout attempt, but this is a strong resistance.
B Breakout Confirmed & Sustained: The price successfully sustains above the resistance.
C Reversal Signal: The price starts falling, hinting at a correction.
D Breakdown or Fake Breakdown? The whole level is broken, but this could be a trap.
E Regaining the Zone: The price reclaims the level, signaling a potential high-probability trade setup.
The Strategy?
A failed breakout followed by a sustained breakout.
A retest of the support zone and a breakdown.
A strong comeback reclaiming the level, making it a perfect swing/positional trade opportunity IF your setup aligns.
🔥 Actionable Insight: Don't just enter at any breakout or breakdown—wait for confirmation in key zones. If your setup matches, this is where the best trades happen!

Senores Pharma: Cup & Handle - Ready for Some Action?NSE:SENORES
Senores Pharma is forming a potential cup and handle on the daily timeframe. A breakout attempt on Feb 6, 2025, failed to sustain above ₹607.35 as selling pressure came in second half.
Now, the cup and handle pattern is progressing, making next week crucial. A close above ₹607.35 is the key level to watch for confirmation.
Volumes are rising, with today's volume (Feb 21, 2025) nearly 5x yesterday's. The stock's resilience despite market pressure indicates strength.
Cup and Handle pattern usually don't disappoint so would be interesting to watch.
Senores Pharmaceuticals is a research-driven company focused on developing specialty pharmaceutical products for regulated markets. The company has shown impressive financial performance:
Recent Financials (Q3 FY25):
Net Sales: ₹106.4 crore (up 35% YoY from ₹78.7 crore in Q3 FY24)
QoQ Performance: Increased from ₹104.4 crore in Q2 FY25 (up 1.92%)
EBITDA: ₹29.1 crore (up 92% YoY)
PAT: ₹17.2 crore (up 142% YoY from ₹7.1 crore in Q3 FY24)
9MFY25 Performance:
Total Revenue: ₹288.1 crore (up 157% YoY from ₹112.1 crore in 9MFY24)
PAT: ₹40.7 crore (up 162% YoY)
Market Position : The stock has outperformed its sector and the broader Sensex, achieving consecutive gains over the past month and trading above multiple moving averages.
Future Projections : Management anticipates a top-line growth of 50%-60% for FY26, with plans to launch five new products in the current quarter.
Strategic Focus : Continued investment in R&D and infrastructure development is expected to enhance manufacturing capabilities and expand product offerings.

Amazing swing trading idea in UPLI daily make educational content videos for swing / positional trading

MAHARASTRA SEAML - Aggressive Reversal Bet!Price Analysis & Overview:
1. EMA support taken.
2. Strong Fib support zone.
3. Blast above 900
4. 100%+ Potential
5. Need good volumes
6. Entry above 710 post confirmations
7. Strong buying candle formation is needed.
- Stay tuned for further insights, updates and trade safely!
- These are my personal views.
- If you liked the analysis, don't forget to leave a comment and boost the post. Happy trading!
Disclaimer: This is NOT a buy/sell recommendation. This post is meant for learning purposes only. Please, do your due diligence before investing.
Thanks & Regards,
Anubrata Ray

How to Trade Parallel Channels Like a Pro | Intra & Swing TradesLearn how to trade parallel channels effectively in this detailed breakdown. I cover two types of parallel channels:
Up trending Parallel Channel – Enter at higher lows for a long position.
Downtrending Parallel Channel – Short at lower highs for intraday trades or wait for a breakout at resistance for swing/positional trades.
Master risk-reward strategies and improve your trade setups today!

"Crucial Neckline Breakout Ahead for Ashiana Housing LtdHello everyone, today i have brough a news base trade setup of Ashiana Housing Ltd. and it is showing an exciting setup on the charts as it approaches a neckline breakout level at ₹368. This is a critical resistance zone, and if the stock sustains above this level, it could mark the beginning of a strong upward move.
Here’s why this is interesting:
Technical Setup: After a period of consolidation, the stock is attempting to break out of a well-defined neckline. This kind of breakout often signals the start of a new trend.
Volume is Key: A breakout supported by higher volumes would confirm strong buying interest, which is exactly what traders want to see.
Recent News Adds to the Momentum:
Ashiana Housing recently launched the final phase of its luxury residential project, Ashiana Ekansh, in Jaipur's Mansarovar Extension. This has been well-received and could boost the company’s fundamentals.
While the stock faced some selling pressure recently, the current setup indicates the potential for a turnaround.
Key Levels to Watch:
Entry Point: ₹368 – Breakout confirmation is crucial.
Stop Loss: ₹344 – To manage risk effectively.
Targets:
1st Target: ₹413
2nd Target: ₹438
3rd Target: ₹468
Why This Matters:
A breakout from this level could provide a solid risk-reward opportunity for traders. However, patience is key – wait for confirmation before jumping in. Also, keep an eye on the broader market sentiment and any updates related to the company.
Final Thought:
Ashiana Housing is at a pivotal point. If the breakout happens, this could be an exciting ride to the targets. Stay alert, manage your risks, and let the market guide you.
Disclaimer:- Please always do your own analysis or consult with your financial advisor before taking any kind of trades.
If you found this analysis insightful, don’t forget to hit like and follow for more such content!
For related trading ideas and educational posts, check out our profile TraderRahulPal Let’s learn and grow together!

"Budget 2025: Don’t Miss This High-Potential Railway Stock!"Hello Everyone, I hope you all are doing great! Today, I’ve brought you a stock that’s catching my attention both technically and fundamentally . This setup looks solid for short-term opportunities and has the potential to deliver significant gains over the long term as well. Stock name is RVNL and it is trading in a Descending Channel Pattern , and the price is currently near a critical support zone around 395-415 . This level is supported by a Bullish Harami candlestick pattern , which is a strong reversal signal. Additionally, the previous resistance zone has turned into support , adding credibility to the bullish outlook.
Last breakout above 355 resulted in an 83% rally to 647. If history repeats, a breakout above 510 could trigger a similar 83% move, targeting 947 in the long term. This aligns with strong fundamentals and Budget 2025’s expected focus on infrastructure spending.
Volume and Indicators:- Significant volume spikes at the support zone indicate institutional buying interest , which adds strength to the current level.
MACD is in the negative zone but showing signs of flattening, which could indicate a potential momentum reversal.
Fundamental Catalyst:- RVNL holds a pivotal role in transforming India's railway infrastructure , making it a prime beneficiary of Budget 2025 . The government ’s focus on infrastructure spending is likely to act as a positive catalyst, supporting the stock’s long-term growth potential.
Conclusion:- A breakout above 510 could unlock significant upside potential, aligning with both technical and fundamental perspectives. Traders should watch for a sustained move above 510 for confirmation of bullish momentum.
Disclaimer:- This analysis is for educational purposes only. Please trade responsibly and consult a financial advisor before making any decisions.
If you found this analysis helpful, don’t forget to like, follow, and share your thoughts in the comments below! Your support keeps me motivated to share more insights. Let’s grow and learn together—happy trading!

LODHA: Chart and Fundamentals Align for a Promising MoveHello everyone, Happy Republic Day to all my followers, I hope you all will be doing good in your life and your trading as well. Today i have brought a stock which name is Macrotech Developers (LODHA) and it has delivered an exceptional quarterly performance, reflecting robust financial strength and promising growth. Here’s the detailed breakdown:
Quarterly Financial Highlights
Revenue from Operations: 4083 crore, a substantial rise compared to 2931 crore in the same quarter last year.
Net Profit: 944.8 crore, showing strong growth compared to 505.2 crore in Q3 FY24.
EBITDA Margins: Improved significantly, showcasing efficiency in operations.
Pre-sales: 2570 crore for the quarter, with collections reaching 2280 crore.
Net Debt: Reduced to 6240 crore, highlighting financial discipline and a stronger balance sheet.
Technical Analysis
Strong Support Zone: The price has bounced from the ₹1125-1075 support zone, a proven demand area.
Morning Star Pattern: A bullish candlestick pattern near the support zone signals a potential reversal.
Oversold RSI: RSI recently dipped into the oversold region, further indicating a likely bullish move.
Falling Resistance Trendline: The stock is nearing a critical resistance trendline. A breakout above this level could confirm upward momentum.
With a strong financial performance in Q3 FY25, including a sharp rise in revenue and net profit, coupled with a favorable technical setup, LODHA looks promising for swing traders. Watch for a breakout above the falling resistance trendline for further confirmation.
Disclaimer:- This analysis is for educational purposes only. Please trade responsibly and consult a financial advisor before making any decisions.
If you found this analysis helpful, don’t forget to like, follow, and share your thoughts in the comments below! Your support keeps me motivated to share more insights. Let’s grow and learn together—happy trading!

Polycab India Ltd – A Strong Technical and Fundamental Setup!Hello Everyone, i hope you all will be doing good in your life and your trading as well. Today i have brough a stock which name is Polycab India Ltd and it is currently testing a crucial support zone after a sharp correction. The previous resistance has turned into support, and a Morning Star candlestick pattern is forming, indicating a potential reversal. This setup aligns well with the stock’s long-term growth story.
From a technical perspective, a breakout from this support zone could lead to strong upside momentum. The entry zone is 5850-5750, with targets at 6333, 6955, and 7550, while a stop-loss at 5450 ensures risk management.
On the fundamental side, Polycab remains a market leader in the wires & cables industry, backed by strong revenue growth, profitability, and a solid order book. With the government's focus on electrification and infrastructure development, the stock has promising long-term potential.
Fundamental Ratio:
Market Cap
₹ 87,699 Cr.
Current Price
₹ 5,830
High / Low
₹ 7,607 / 4,236
Stock P/E
47.7
Book Value
₹ 571
Dividend Yield
0.51 %
ROCE
31.3 %
ROE
23.2 %
Face Value
₹ 10.0
Industry PE
31.9
Debt
₹ 193 Cr.
EPS
₹ 122
Promoter holding
63.0 %
Intrinsic Value
₹ 2,329
Return over 5years
43.3 %
Debt to equity
0.02
Net profit
₹ 1,865 Cr.
Disclaimer:- This analysis is for educational purposes only. Please trade responsibly and consult a financial advisor before making any decisions.
If you found this analysis helpful, don’t forget to like, follow, and share your thoughts in the comments below! Your support keeps me motivated to share more insights. Let’s grow and learn together—happy trading!

Bharti Airtel – Strong Setup for Short-Term & Positional HoldingHello everyone! Hope you're all doing great in life and in trading. Today, I bring you a stock that has not only given a strong breakout but also delivered exceptional Q3 FY25 results stock name is Bharti Airtel Ltd. and it is the world’s leading providers of telecommunication services with presence in 18 countries representing India, SriLanka, 14 countries in Africa.
After breaking out of a descending trendline , Bharti Airtel is now retesting the 1630-1600 support zone . If this level holds, we could see a strong upside move in the coming sessions. The technical structure remains bullish, with an entry zone between 1630-1600 , and targets at 1688, 1736, and 1778 , while the final positional target is set at 1955 . For risk management, a short-term stop loss at 1570 and a positional stop loss at 1520 should be considered. RSI is showing strong momentum , and volume confirmation on the breakout strengthens the bullish case
.
Latest Q3 FY25 results highlight consistent revenue and profit growth . The company’s standalone revenue surged 19.1 percent YoY to 45,129 crore , with its India business growing 24.6 percent YoY . ARPU has increased to 245 , boosting overall profitability. EBITDA came in at 24,880 crore , with a 55.1 percent margin , showing strong operational efficiency. On the expansion front, 5G rollout is progressing aggressively, with 5.2K new towers added , and the subscriber base has grown by 25.2 million users . Additionally, Bharti Airtel has significantly improved its financial position, having prepaid 36,263 crore in spectrum dues , further strengthening its balance sheet.
Market Cap
₹ 9,70,118 Cr.
Current Price
₹ 1,620
High / Low
₹ 1,779 / 1,098
Stock P/E
48.5
Book Value
₹ 153
Dividend Yield
0.49 %
ROCE
13.1 %
ROE
14.9 %
Face Value
₹ 5.00
Industry PE
40.9
Debt
₹ 2,25,541 Cr.
EPS
₹ 43.2
Promoter holding
53.1 %
Intrinsic Value
₹ 421
Return over 5years
25.1 %
Debt to equity
2.59
Net profit
₹ 27,074 Cr.
Disclaimer:- This analysis is for educational purposes only. Please trade responsibly and consult a financial advisor before making any decisions.
If you found this analysis helpful, don’t forget to like, follow, and share your thoughts in the comments below! Your support keeps me motivated to share more insights. Let’s grow and learn together—happy trading!

Aarti Pharmalabs | Rectangle Pattern Breakout | Big Upside AheadHello everyone! I hope you all are doing great. 😊 Today, I’ve got something interesting for you – a solid breakout in Aarti Pharmalabs! After months of going sideways, Aarti Pharmalabs has finally woken up! The stock was stuck between 555 (support) and 695 (resistance) for a long time, but now, the bulls have taken control and pushed it past this critical resistance zone.
Here’s what’s happening:
The price tested 695 multiple times but kept getting rejected. This time, it broke out with strong volume , showing that buyers mean business. This could be the beginning of a strong uptrend!
Key Levels to Watch:
🔹 Short-Term Target: 815
🔹 Final Target: 895
🔹 Best Entry Zone: 750-715 (if we get a pullback, it’s a golden chance!)
🔹 Stop Loss: 670 (always manage risk!)
Fundamental View:
Aarti Pharmalabs is growing steadily, expanding into regulated markets , and benefiting from increasing demand for specialty chemicals . The sector looks strong, but risks like raw material costs and regulatory challenges remain. Despite that, the stock is still at a reasonable valuation and has room for further upside.
What’s Next?
As long as the breakout holds above 695 , the bullish momentum should continue. If we see a retest of the breakout zone, it could be a great entry point before the next rally.
What do you think? Will Aarti Pharmalabs hit 895 soon? Drop your thoughts in the comments!
Disclaimer: This analysis is for educational purposes only . Please trade responsibly and consult a financial advisor before making any decisions.
If you found this analysis helpful, don’t forget to like, follow, and share your thoughts in the comments below! Your support keeps me motivated to share more insights. Let’s grow and learn together— happy trading!
