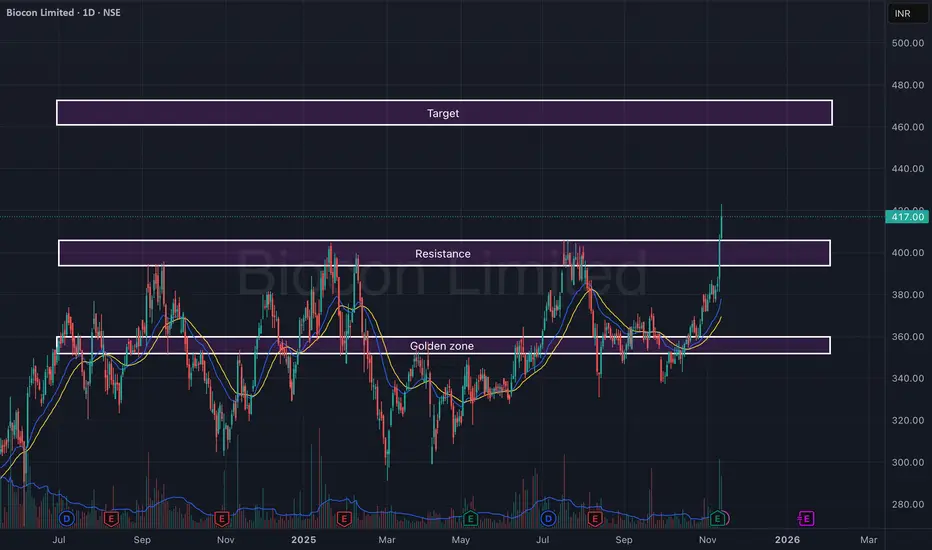
Biocon Ltd – Breakout from Resistance with Strong Volume SurgeBiocon has delivered a powerful breakout above its key resistance zone of ₹395–₹405, backed by a sharp volume expansion and strong follow-through candles. After months of consolidation within the golden zone (₹355–₹370), the stock has finally regained momentum, suggesting a potential trend reversal.
The structure now favors continuation toward the upper target zone, with EMAs aligning positively and momentum indicators supporting strength.
🎯 Key Levels:
CMP: ₹417.00 (+2.73%)
Golden Zone (Base Support): ₹355 – ₹370
Resistance (Now Support): ₹395 – ₹405
Target Zone: ₹460 – ₹475
Stop-Loss: ₹385 (on daily close basis)
📊 Technical View:
Resistance breakout with strong bullish candle and high volume.
EMA crossover (20 > 50) confirms short-term bullish trend.
Sustaining above ₹405 may lead to a momentum rally toward ₹460+.
Golden zone remains a reliable base for any pullback opportunities.
🧠 View:
Biocon has confirmed a breakout after a prolonged consolidation phase. Sustained momentum above ₹405 could lead to a steady move toward ₹470 levels in the short to medium term.
Swingtrading
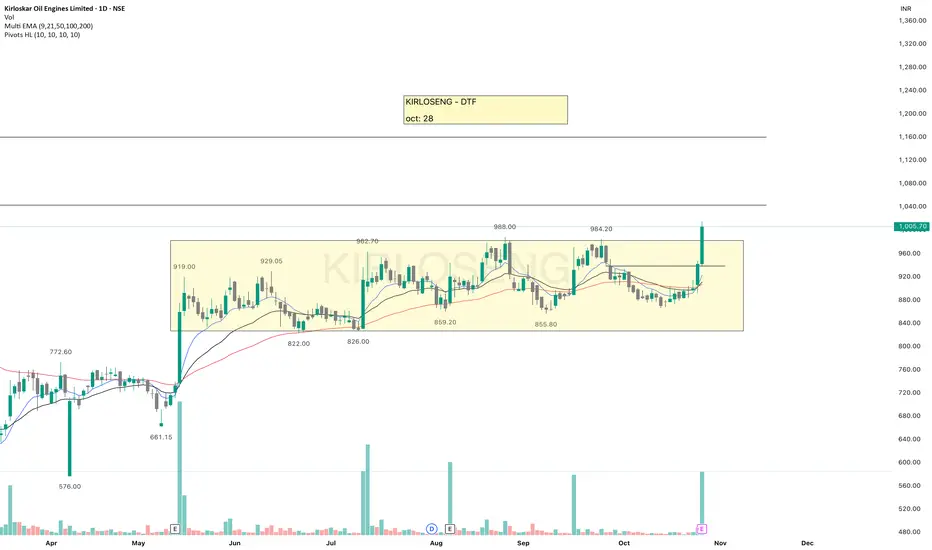
KIRLOSENGKIRLOSENG - The stock has given a breakout after consolidating in a range for over 5 months.
Volume is strong, and EMAs are aligning well, but a follow-up candle is needed for confirmation.
Market structure looks bullish but price seems slightly stretched so waiting for a small retracement would be ideal.
1040 is a nearby resistance.
Keep it on your watchlist for paper trading.
✅ If you like my analysis, please follow me here as a token of appreciation :)
in.tradingview.com/u/SatpalS/
📌 For learning and educational purposes only, not a recommendation. Please consult your financial advisor before investing.
Bajaj Auto #Screener — Structure Compression Before the BreakoutBajaj Auto (NSE: BAJAJ-AUTO) is forming a clean structure compression between a long-term descending trendline (blue) and rising support trendline (purple).
The stock has created higher lows, showing buyer strength returning after a corrective phase.
This is a classic squeeze pattern where price coils before a directional move — something high-quality large caps often do before a trend continuation.
Key Structure Highlights
📌 Strong support base at ₹8550–8600
📌 Rising trendline support since Mar 2025
📌 Sellers defending the ₹9490 major supply zone
📌 Multiple failed breakdowns → indicates demand
📌 Compression between trendlines tightening
📌 Price still above 50 EMA on weekly (momentum intact)
Key Levels
Major Resistance:
₹9490 (big supply zone + trendline confluence)
Support Levels:
₹8850
₹8550 (structure support)
Below this, momentum weakens
As long as price maintains above ₹8550, structure stays bullish-to-neutral with potential for upside resolution.
View
Momentum bias stays positive above ₹8550.
A decisive close above ₹9490 may trigger a clean continuation move.
Technical Snapshot
✅ Large-cap quality stock
✅ Higher lows (structure strength)
✅ Price contraction = energy build-up
✅ Watching breakout above ₹9490 for trend continuation
✅ Good risk-defined setup for swings
This isn’t a random breakout play — it’s a large cap structural setup, where the next move usually sets a multi-week trend.
📒 Educational price structure analysis — not investment advice.

Asian Paints #Screener — Trend Reversal Before The Crowd Asian Paints Ltd (NSE: ASIANPAINT) has given a strong breakout from a long-term descending trendline with a sharp momentum candle.
This move signals a trend reversal after months of consolidation and price compression — supported by solid weekly volume.
Chart Structure #Screener
📌 Breakout from descending trendline
📌 Volume surge confirming buyer interest
📌 Price holding above 50 EMA on weekly
📌 Formation of higher lows since early 2025
📌 Strong bullish candle closing above key supply zone
Key Levels
Resistance Zone: ₹2880 – ₹3130
Support Zone: ₹2640 – ₹2720
Major Support: ₹2490 (structure base)
As long as price stays above ₹2640, trend bias remains bullish ✅
View
This setup represents a trend shift, not just a breakout — aligning with strength returning in large-cap sectors.
A healthy retest or consolidation above ₹2700 zone could provide follow-through opportunities.
Technical Snapshot
✅ Trendline breakout confirmation
✅ Volume expansion + wide-range candle
✅ Higher-low formation
✅ Momentum shift to buyers
✅ Mid-to-large cap stock showing leadership recovery
📒 Educational analysis only — not investment advice.

BANK NIFTY - Technical Analysis Bank Nifty is showing an interesting setup on the weekly chart.
After breaking out above its previous all-time high, the index has started contracting in a tight range, indicating healthy consolidation.
On the daily timeframe, it continues to take support near the 9 EMA, and during minor dips, it has also reversed from the 20 EMA, reflecting strong buying interest.
If Bank Nifty breaks out of this range with momentum, the upside potential remains open, sky’s the limit.
In case of a pullback, watch these key support zones:
🟩 57,500 – first immediate support
🟩 57,160 – secondary support
🟩 56,600 – third support
🟩 56,000 – major support zone if deeper retracement occurs
Overall market structure is Bullish, and a bit more consolidation or a short pullback will only strengthen the base for a sustained breakout.
✅ If you like my analysis, please follow me here as a token of appreciation :)
in.tradingview.com/u/SatpalS/
📌 For learning and educational purposes only, not a recommendation. Please consult your financial advisor before investing.

NIFTY - Technical analysisNIFTY gave breakout of the range and then retested the same, took support at 50ema and gave reversal.
Now there is probability of going towards 26104 and then crossing 26277, overall setup is Bullish.
Today there was gap up so in between it may fill this gap.
✅ If you like my analysis, please follow me here as a token of appreciation :)
in.tradingview.com/u/SatpalS/
📌 For learning and educational purposes only, not a recommendation. Please consult your financial advisor before investing.

COLPAL | Selling exhausted?DISCLAIMER: This idea is NOT a trade recommendation but only my observation. Please take your trades based on your own analysis.
Points to note:
-----------------
1. RSI shows a bullish divergence with price.
2. The rejection of selling comes inside a Demand zone.
-----------------
A trade can be taken with the above points in mind:
Entry - CMP, SL - 2145, Tgt - 2400

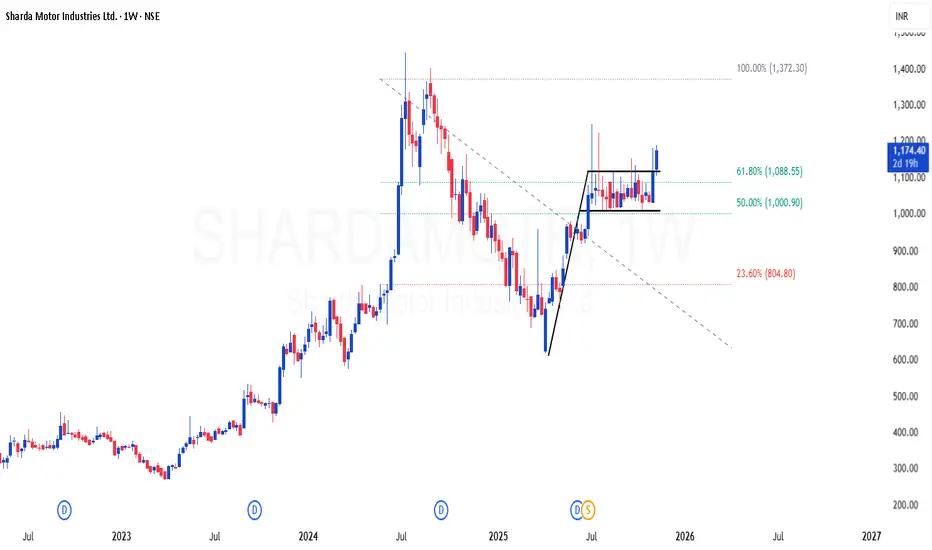
SHARDAMOTR | Nice flag breakout in weekly time frameSHARDAMOTR | Nice flag breakout in weekly time frame
CMP : 1170 (Dip : 1000)
SL : 900
Target : 1800 (based on fib)
NUVAMANUVAMA looks good, overall structure is bullish.
EMAs are aligned, it has sustained the recent resistance breakout, now there is probability of an upside move.
There is another resistance nearby 7868.
Keep it in your watchlist.
✅ If you like my analysis, please follow me here as a token of appreciation :)
in.tradingview.com/u/SatpalS/
📌 For learning and educational purposes only, not a recommendation. Please consult your financial advisor before investing.

LATENTVIEWLATENTVIEW is looking good.
It gave breakout of an old resistance and then retested, EMAs are aligned, overall a bullish structure.
Now if it sustains above the trendline then there is probability of an upside move.
Keep it in your watchlist.
✅ If you like my analysis, please follow me here as a token of appreciation :)
in.tradingview.com/u/SatpalS/
📌 For learning and educational purposes only, not a recommendation. Please consult your financial advisor before investing.

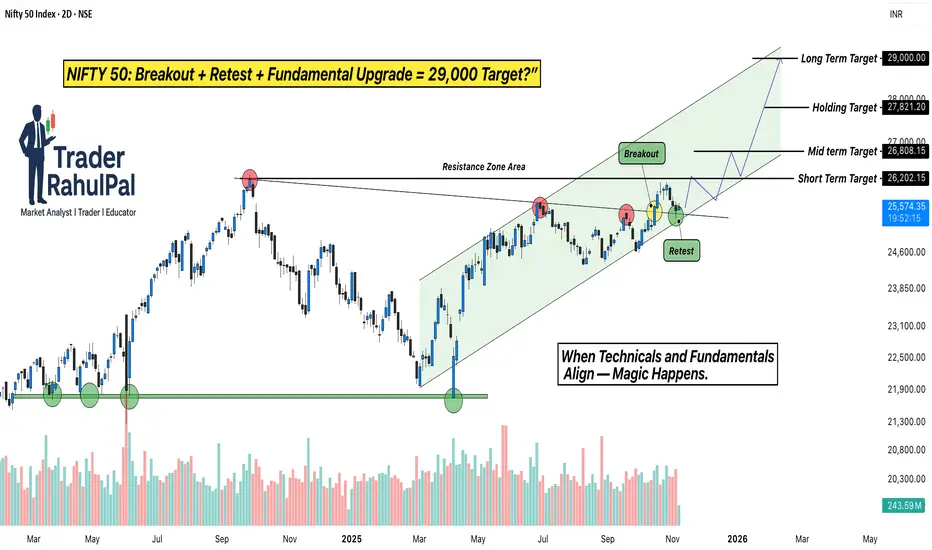
NIFTY Breakout + Goldman Sachs Upgrade = 29,000 Target?Hello Traders!
Today’s analysis is on NIFTY 50 Index, which has recently given a strong Breakout and Retest setup after months of consolidation. The index broke out from its Resistance Zone , retested the breakout area perfectly, and is now holding firmly inside a rising Trend Channel .
This move is not just technical, it’s being backed by major institutional optimism. According to a recent Goldman Sachs report , India’s stock market has been upgraded to “Overweight”, with NIFTY 50 projected to reach 29,000 by 2026 .
Why this setup is special?
Perfect breakout and retest structure with strong volume confirmation.
Channel trend remains intact, showing controlled accumulation at higher levels.
Institutional support from Goldman Sachs aligns with the technical breakout, adding conviction to the rally.
Levels to Track:
NIFTY is holding above the breakout zone near 25,000 , with immediate support seen at 24,600 . As long as the index sustains above this level, the short-term upside remains open toward 26,800 , followed by the next leg around 29,000 , matching Goldman Sachs’ longterm projection.
Rahul’s Tip:
When technicals and fundamentals align, the results are often explosive. A clean retest like this, supported by global institutional confidence, can lead to a powerful trend extension. Traders who position early usually ride the strongest part of the move.
(Analysis By @TraderRahulPal | More analysis & educational content on my profile. If this helped you, don’t forget to like and follow for regular updates.)
Disclaimer:
This analysis is for educational purposes only and should not be taken as financial advice. Please do your own research or consult your financial advisor before investing.
Crompton | A Reversal Imminent?DISCLAIMER: This idea is NOT a trade recommendation but only my observation. Please take your trades based on your own analysis.
Points to note:
-----------------
1. RSI shows a bullish divergence with price.
2. The rejection of selling comes inside a Weekly Demand zone.
3. The high volume inside the Demand zone shows presence of buyers at this level.
-----------------
A trade can be taken with the above points in mind:
Entry - CMP, SL - 269, Tgt - 305, RR- 1.88

Sobha- A breakout of consolidation is on cardsRealty sector has been performing well post Q2 results announcements.
Sobha has posted stellar Q2 numbers but it might be one off quarter as well.
Technically, stock is looking ripe for a good flag breakout of consolidation.
We might soon see a breakout coming but sustainment of breakout is crucial for further upmove.
Levels are mentioned on chart. We can see upside of more than 50% if breakout sustains.
You can also check other realty sector stocks and see if any similar pattern is visible.
Please note that I am just NISM certified RA and not SEBI registered.
This analysis is not a recommendation but has been shared for educational purposes only.

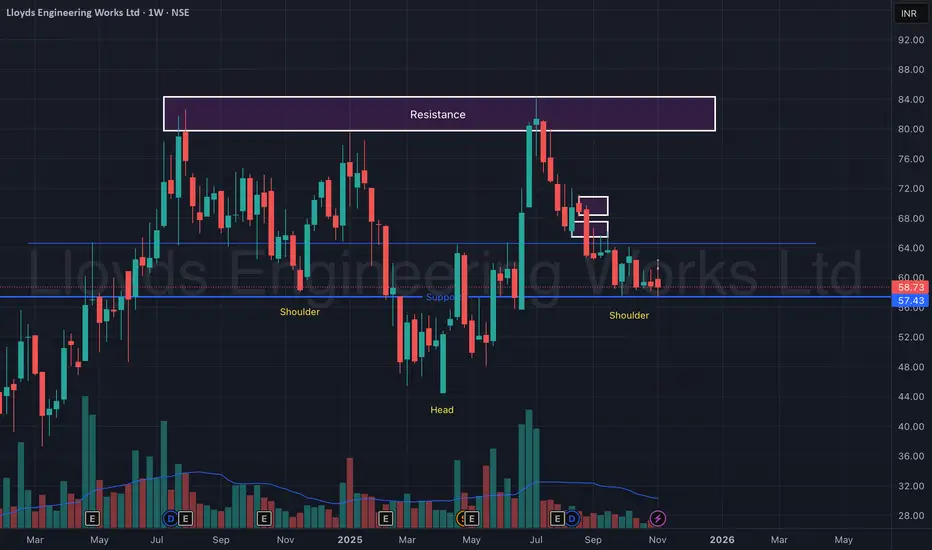
Lloyds Engineering Works Ltd – Ready to Blast from Support Zone!Lloyds Engineering is showing a textbook Inverted Head & Shoulders pattern on the weekly timeframe — a strong reversal formation that often precedes a major uptrend.
The support zone near ₹57–₹58 has held firmly for months, acting as a base for accumulation.
A bullish structure is clearly visible, with both shoulders aligning near the same horizontal support and increasing volumes hinting at smart money participation.
Once the stock decisively breaks above the ₹64 neckline zone, a powerful breakout toward ₹80+ could unfold in the coming weeks.
🎯 Key Levels:
CMP: ₹58.73 (+0.22%)
Pattern: Inverted Head & Shoulders
Support Zone: ₹57 – ₹58 (Strong base)
Neckline / Breakout Zone: ₹64 – ₹66
Target Zone: ₹80 – ₹85
Stop-Loss: ₹54 (Weekly close basis)
📊 Technical View:
Inverted Head & Shoulders forming over a year-long base.
Strong volume spikes near the right shoulder = early accumulation.
EMAs flattening and ready for crossover confirmation.
Sustaining above ₹64 could ignite momentum breakout toward ₹80+.
🧠 View:
Lloyds Engineering looks technically ready for a breakout. With the pattern structure completed and strong volume support, a close above ₹64 can trigger a new uptrend — this one’s “ready to blast.”
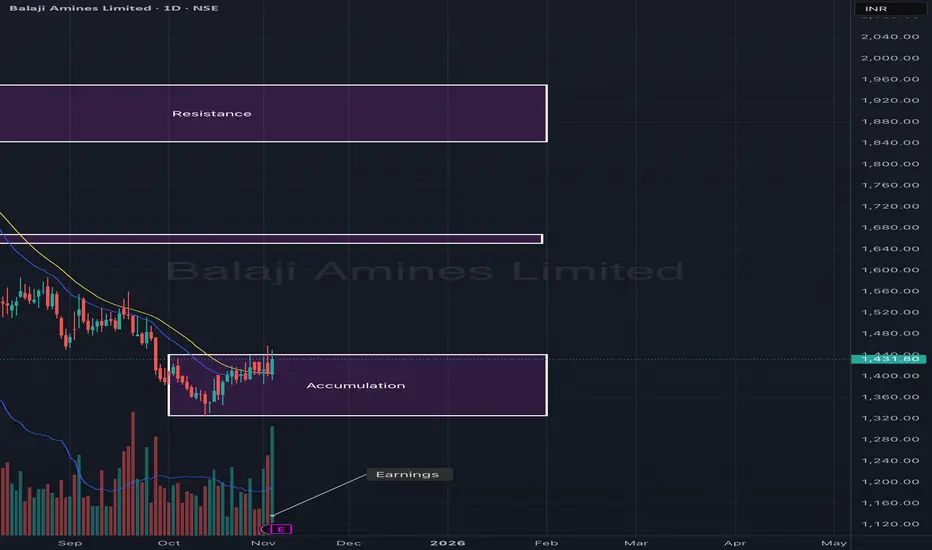
Balaji Amines Ltd – Accumulation Phase Before Potential UpsideBalaji Amines appears to be in a strong accumulation zone after an extended downtrend. The stock has been consolidating between ₹1,350–₹1,450, forming a solid base supported by stable volumes. A sustained move above this range could mark the beginning of a trend reversal and initiate a fresh leg toward the upper resistance levels.
The recent earnings announcement may act as a potential catalyst, as the stock shows early signs of momentum supported by short-term moving average crossovers.
🎯 Key Levels:
CMP: ₹1,431.80 (+1.93%)
Accumulation Zone: ₹1,350 – ₹1,450
Resistance 1: ₹1,650 – ₹1,700
Resistance 2: ₹1,900 – ₹1,950
Stop-Loss: ₹1,340 (on daily close basis)
📊 Technical View:
Price consolidating near the base zone post-correction, signaling accumulation.
Volume stability and EMA alignment suggest early buying interest.
A breakout above ₹1,450 could trigger a move toward ₹1,700.
Sustaining above ₹1,700 may open the next leg toward ₹1,950+.
🧠 View:
Balaji Amines is forming a base after prolonged correction. A close above ₹1,450 with volume confirmation can trigger momentum toward ₹1,700 in the short term, and ₹1,950 in the medium term.
PARAGMILKStock is sustaining the upside move, staying above 9ema.
Now a breakout from here may give a good upside move. Overall setup is bullish, but always use the SL even when doing paper trading.
Keep it in your watchlist.
✅ If you like my analysis, please follow me here as a token of appreciation :)
in.tradingview.com/u/SatpalS/
📌 For learning and educational purposes only, not a recommendation. Please consult your financial advisor before investing.

RBL BANKStock is maintaining the move above all key EMAs, last Swing Low (242.35) took support at 50 exponential moving average, which is a good sign.
Previous resistance is becoming a support, price is consistently taking support above 20ema.
A move from here may give a good upside move.
✅ If you like my analysis, please follow me as a token of appreciation :)
in.tradingview.com/u/SatpalS/
📌 For learning and educational purposes only, not a recommendation. Please consult your financial advisor before investing.

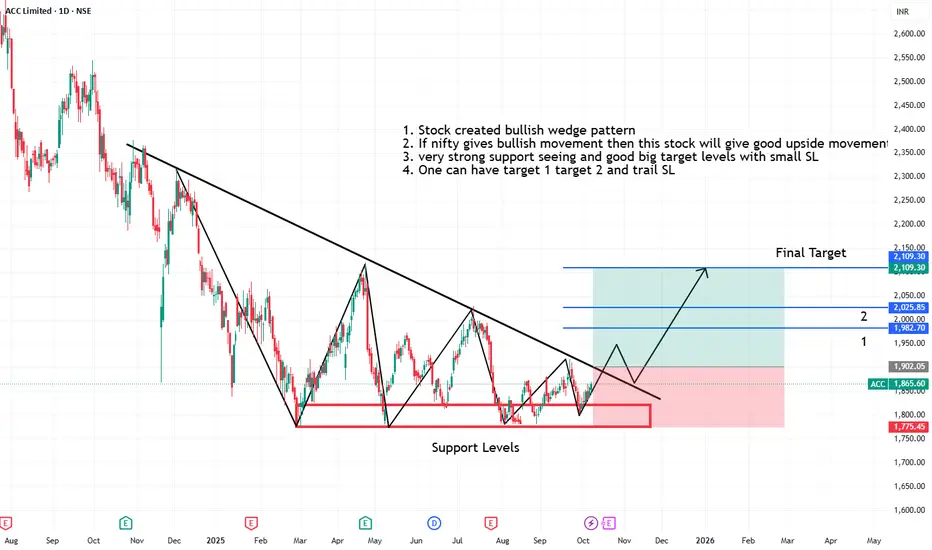
Acc creating bullish wedge pattern on strong support levels1. Stock created bullish wedge pattern
2. If nifty gives bullish movement then this stock will give good upside movements
3. very strong support seeing and good big target levels with small SL
4. One can have target 1 target 2 and trail SL
Low Volatility, Big Opportunity? What VIX Says About Nifty.Good Afternoon!
Since market is red allover there nothing to do about it. Did some analyses with India Vix index how it gauge us with nifty 50.
How It Works :
1.When the VIX is low (as now), it means traders believe the market will stay stable prices won’t jump wildly soon. In such periods, big sudden crashes or rallies are less likely
But Analyzing nifty when Vix is between 8 to 12 generally it starts moving towards bull phase as per past example on chart.
2.When India VIX spikes sharply (say, above 18-25 or more), it means people are scared and bracing for large moves—like during COVID-19 or major elections.
Which is seen in chart from Sept'21 to Feb'22 till June'22 in Nifty when Vix was ranging between 15 to 33
Currently it ranging between 8 to 12 range which as per past may indicate a fresh leg in nifty.
But Again saying Price is King!

RBL Bank -Multi-Year #Breakout After 4 Years of ConsolidationRBLBANK has broken out of a multi-year resistance zone after a long accumulation phase since 2020.
This type of structure often leads to sustained upside momentum if the #breakout holds.
📌 Breakout Zone: ₹280 – ₹300
📌 Current Price: ~₹327
📌 Structure: Higher Highs & Higher Lows
📌 Volume: Strong accumulation visible
📌 Trend: Strong uptrend above long-term trendline & EMAs
Key Levels
Immediate Resistances ₹360
₹425 (Major long-term level)
Supports
₹300 – breakout retest zone
₹260 (major swing support)
As long as price stays above ₹300, bulls remain in control 🐂🔥
Technical Highlights
✅ 4-year consolidation breakout
✅ Major downtrend line broken
✅ Strong volume confirmation
✅ Clean price action + trend continuation
View
Bias remains bullish as long as price holds above the breakout zone.
Breakout + retest setups may offer opportunities in trending markets.
Not investment advice — for educational chart analysis only. Always do your own research.

Bajaj Consumer Care - Multi Year #BreakoutBAJAJCONSUMER has finally given a strong multi-year breakout after consolidating for almost 4+ years ✅
📌 Breakout Zone: ₹285 – ₹295
📌 Current Price: ~₹307
📌 Volume: Increasing – confirms accumulation
📌 Trend: Higher Highs & Higher Lows structure intact
📌 EMA Support: Riding above EMA – strong momentum
This kind of long-term range breakout often leads to multi-month / multi-year uptrends if sustained 🏆
Next Major Zones / Targets
₹330
₹360
₹400+ (Long-term)
Support Levels
₹288 – breakout retest zone
₹260 (strong major support)
As long as price stays above ₹288, bulls in full control 🐂💪
📈 Positioning: Long bias (This is for educational analysis only, not investment advice. Please do your own research.
Chart Setup
✅ Multi-Year Trendline Break
✅ Price above 200 EMA & 50 EMA
✅ Strong volume breakout
✅ Bullish price action + momentum
Risk Management
Always trail stop-loss & manage position size.
Market me survive karna hi jeet hai✨

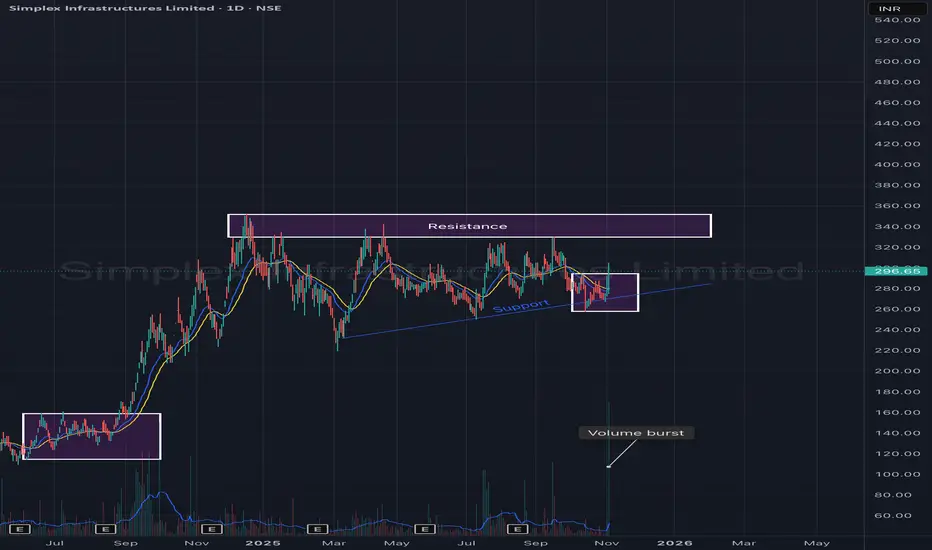
Simplex Infrastructures Ltd – Ascending Triangle Formation with Simplex Infrastructures is showing signs of accumulation and trend continuation within an ascending triangle pattern on the daily chart. The stock has been consistently forming higher lows while facing resistance around the ₹330–₹340 zone.
A recent volume burst near the support trendline indicates strong buying interest from lower levels — hinting at a potential breakout attempt in the coming sessions.
🎯 Key Levels:
CMP: ₹296.65 (+3.20%)
Support Trendline: ₹270 – ₹280
Resistance Zone: ₹330 – ₹340
Breakout Target: ₹370 – ₹390
Stop-Loss: ₹270 (on daily close basis)
📊 Technical View:
Formation of a higher-low structure within an ascending triangle.
Strong volume activity around support confirms accumulation.
Short-term EMAs are flattening, awaiting breakout confirmation.
A close above ₹340 with volume could trigger the next up leg toward ₹380+.
🧠 View:
Simplex Infra is building strength within a bullish ascending triangle pattern. A decisive move above ₹340 may confirm breakout momentum, supported by the recent volume surge, while the rising trendline continues to act as a strong base.
OGS LONGHello traders,
I'd like to post my analysis on OGS with a more timely and actionable observation. While the consolidation range of $79.50 - $83.10 is still valid, a clearer entry signal has just presented itself.
Context: Following the significant breakout on the week of September 22, OGS has been in a healthy consolidation.
Key Observation: The stock has now pulled back to test the precise level of its former breakout resistance. This "resistance-to-support flip" is a classic bullish confirmation.
The Entry Signal: The most critical development is the formation of a strong bullish reversal candle precisely at this new support level. This price action indicates that buyers are actively defending this new floor.
Multi-Timeframe Confirmation: The significance of this signal is amplified as this reversal pattern is visible on both the Weekly and Daily charts.
