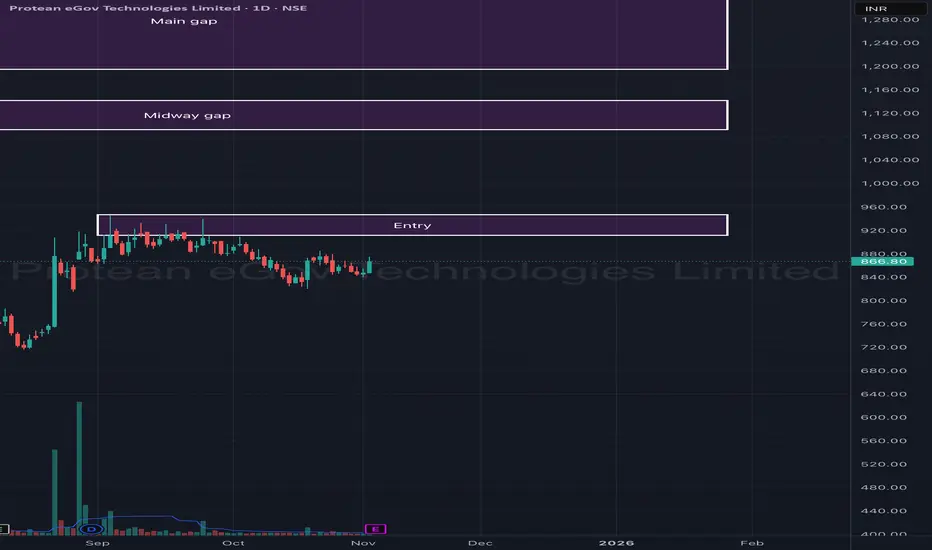
Protean eGov Technologies Ltd – Gap Fill Setup (Daily Chart)Protean eGov Technologies is showing early signs of base formation after a prolonged downtrend. The price is currently consolidating near the ₹850–₹880 zone, forming a potential accumulation structure that could lead to a gap-fill rally in the short to medium term.
The chart highlights two major unfilled gaps — a midway gap and a main gap — both acting as key upside targets once the current range breakout confirms.
🎯 Key Levels:
CMP: ₹866.80 (+2.25%)
Entry Zone: ₹850 – ₹880
Midway Gap Target: ₹1,100 – ₹1,150
Main Gap Target: ₹1,280 – ₹1,350
Stop-Loss: ₹820 (on daily close basis)
📊 Technical View:
Price consolidating after a steep decline — forming a base near support zone.
Volume spikes during accumulation suggest smart buying interest.
Breakout above ₹880–₹900 could trigger a gap-fill move toward ₹1,100+.
Short-term EMAs are flattening, indicating the downtrend might be losing momentum.
🧠 View:
Sustaining above ₹880 could confirm the beginning of a recovery phase. Watch for a breakout with volume to target ₹1,100 first (midway gap), followed by ₹1,300+ (main gap fill).
Swingtrading
EUR/JPY Sell Momentum BuildsEUR/JPY has officially transitioned into a sell-side trend following clear exhaustion of its previous bullish cycle. The market structure shows consecutive lower highs and strong downside displacement, confirming that sellers are now in control of short-term momentum.
Recent liquidity sweeps above prior highs were quickly rejected, signaling institutional distribution and profit-taking. Order flow dynamics continue to favor the downside, with bearish impulses showing higher efficiency than any corrective rebounds.
Momentum and sentiment both align with sustained selling pressure. The pair is operating within a redistribution phase, and the market tone remains defensive as participants seek lower value zones.
Overall outlook: Bearish bias remains dominant. The market is expected to extend lower while maintaining controlled volatility until meaningful demand re-enters the market.

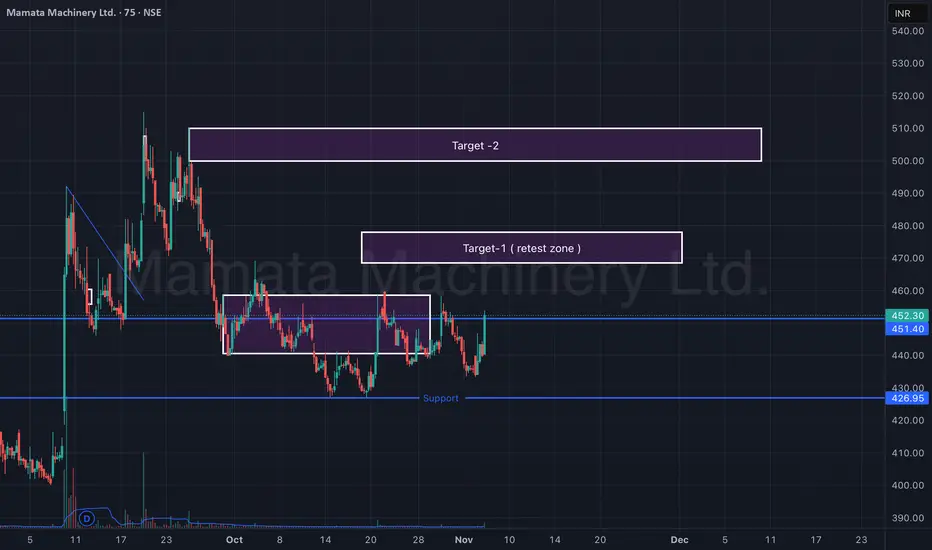
Mamata Machinery Ltd – Support Reversal & Retest Zone (75-min)Mamata Machinery is showing early signs of reversal from a strong support zone around ₹425–₹430. After forming a double-bottom-like structure, the stock has bounced sharply with rising volumes, indicating a possible short-term trend reversal.
Currently, price action is approaching a retest zone (Target-1) near ₹465–₹470. Sustaining above this level can open the path toward the next resistance cluster (Target-2) near ₹505–₹515.
🎯 Key Levels:
CMP: ₹452.30 (+3.81%)
Support Zone: ₹425 – ₹430
Target-1 (Retest Zone): ₹465 – ₹470
Target-2: ₹505 – ₹515
Stop-Loss: ₹425 (on 75-min close basis)
📊 Technical View:
Price rebounded from major support with visible volume spike.
Structure forming higher lows — early indication of momentum shift.
Short-term EMAs turning upward; potential crossover likely soon.
Sustained move above ₹470 can confirm breakout continuation toward ₹510+.
🧠 View:
Mamata Machinery has reversed from key support and is testing its retest zone. A breakout above ₹470 could trigger a short-term rally toward ₹510, while maintaining a stop-loss below ₹425.
Ambuja Cements Ltd – Inverted Head & Shoulder Breakout in ProgreAmbuja Cements is displaying a classic Inverted Head & Shoulder pattern on the weekly timeframe, signaling a potential medium-term trend reversal. The neckline breakout zone around ₹560–₹580 is being tested again, and the price has shown a strong rebound from this area, confirming buyer strength.
The stock had earlier broken out of a falling wedge pattern, further strengthening the bullish bias. A sustained move above ₹580 with volume could confirm the breakout and pave the way for higher targets.
🎯 Key Levels:
CMP: ₹577.20 (+2.09%)
Pattern: Inverted Head & Shoulder + Falling Wedge
Neckline Zone: ₹560 – ₹580
Target-1: ₹630 – ₹640
Target-2: ₹690 – ₹710
Stop-Loss (Weekly Close): ₹540
📊 Technical View:
Price breaking out from a falling wedge after forming a reversal base.
EMA alignment turning positive – 20 EMA attempting to cross above 50 EMA.
Volume spikes seen near breakout areas indicate accumulation.
Sustaining above ₹580 may lead to a rally toward ₹640 and then ₹700+.
🧠 View:
Ambuja Cements shows early signs of a trend reversal backed by a strong chart structure. A weekly close above ₹580 would confirm the breakout, opening potential upside targets of ₹640 and ₹700 in the medium term.

Raghav Productivity Enhancers Ltd | Weekly VCP Breakout | Moment🏭 Company Overview
Raghav Productivity Enhancers Ltd (NSE: RPEL) is India’s leading producer of silica ramming mass, a key refractory material used in steel manufacturing furnaces. The company operates modern facilities with global quality standards, catering to both domestic and international steel producers.
Fundamental Keys
Company's market cap ₹35,887 Cr
PE Ratio : High Valuation (78.90)
Price to sales: >15.75
ROE: >30% Excellent
ROA: >26% Good
Net Profit Margin: >19% Good
Operating Margin: >45% Good
EBITDA Margin: >28% Good
Debt-to-Equity: 0.0279 (debt-free profile)
Quick Ratio: 3.67
Cash Ratio: 0 (working capital tightness)
Debt to EBITDA: 0.098 Good
Annual sales have increased for 3 consecutive years.
Quarterly revenue trending upward for 5 years.
Strong balance sheet with growing total assets and minimal debt.
Financially robust with excellent profitability and asset efficiency.
Valuations are stretched, but strong earnings momentum supports short- to medium-term bullish sentiment.
Technical Analysis (Weekly + Daily)
Stock formed a perfect VCP (Volatility Contraction Pattern). A series of tightening swings leading to a breakout with a massive green candle.
Breakout candle closed near high - shows conviction buying.
Volume expansion on breakout confirms institutional participation.
Price now comfortably trades above key resistance zone (~₹740) flipping previous resistance into new support. All moving averages aligned bullishly with expanding volume signaling a high-probability breakout continuation.
Price trades above 9, 20, and 50 EMA - bullish alignment. ADX is showing healthy trend strength. RSI mildly overbought, typical for breakout continuation. MACD confirmed strong bullish crossover. Weekly volume surged to ~995K, 3× above average clear sign of institutional activity. Daily volume >615K confirms multi-timeframe buying interest.
Swing Trade Plan : For 1-3 weeks
Breakout Aggressive Entry: ₹795–805 On (close above breakout high)
Retest Entry: ₹740–760 (On low-volume retest of breakout zone)
Stop-Loss ₹650 Below 50 EMA / prior base
Target 1: ₹850–880 (First resistance zone)
Target 2: ₹950–1,000 )Measured flag projection)
Trailing Strategy:
Move SL to ₹740 after T1 achieved.
Trail below 9 EMA (daily) as price trends higher.
Exit if weekly candle closes below 20 EMA with volume expansion.
⚠️ Disclaimer
This analysis is for educational and research purposes only. It is not financial advice. Always conduct your own due diligence and use proper risk management.

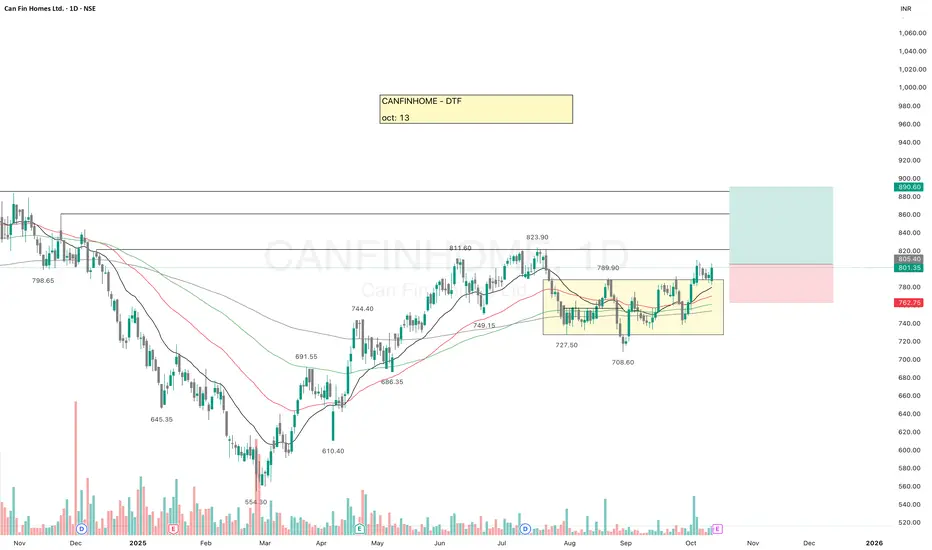
CANFINHOMECANFINHOME has given breakout of the recent resistance.
Looking at a good position, all key EMAs are aligned, if it sustains the move then it may give a good upside move.
There are a couple of resistance points which may become small hurdle in between.
✅ If you like my analysis, please follow me here as a token of appreciation :)
in.tradingview.com/u/SatpalS/
📌 For learning and educational purposes only, not a recommendation. Please consult your financial advisor before investing.
Astral Ltd – Strong Base, High ExpectationsNSE:ASTRAL
🔹 Fundamental Overview
Business Profile: Astral is a leading player in India’s building materials sector, engaged in manufacturing pipes, fittings, adhesives, and bathware products with a strong brand presence and pan-India distribution.
Financial Strength: The company maintains an exceptionally strong balance sheet with very low debt (Debt/Equity ~0.04), reflecting conservative financial management.
Profitability: Delivers ROE around 14 % and ROA near 10 %, demonstrating healthy operational efficiency.
Valuation: The stock trades at a premium valuation with a P/E near 80× and P/B above 10×, indicating high investor confidence and growth expectations.
Growth Trend: Revenue and profit growth have been modest recently, with single-digit YoY expansion amid a slower construction cycle.
Strengths: Industry leadership, strong brand recall, product diversification (plumbing to adhesives), and debt-free operations.
Risks: Elevated valuation levels, cyclical exposure to real estate and construction demand, and potential margin pressure from input cost fluctuations.
🔹 Technical Overview
Trend Direction: Long-term structure remains bullish, with the stock trading above its 50-day and 200-day moving averages.
Momentum: RSI around 55, showing neutral momentum — neither overbought nor oversold.
Trend Strength: ADX near 18 suggests a weak trend phase; stock may be consolidating before the next directional move.
Support Levels: ₹1,420 – ₹1,430 range offers strong support for accumulation.
Resistance Levels: ₹1,475 – ₹1,490 is a crucial breakout zone; a close above this range can trigger a fresh rally.
🔹 Investor Takeaway
Outlook: Astral combines a debt-free balance sheet, premium brand positioning, and steady market dominance—making it a high-quality compounder in the construction materials space.
Investment Horizon: Ideal for long-term investors (2–5 years) seeking exposure to India’s infrastructure and housing growth themes.
Risk Profile: Moderate to high—strong company, but entry should be disciplined due to high valuation.
⚠️ Disclaimer:
This analysis is for educational and informational purposes only.
We are not SEBI-registered analysts or advisors.
This is our personal view based on available data and market trends.
Please consult your SEBI-registered investment advisor before making any investment or trading decisions.
You are solely responsible for any financial decisions you make based on this content.
========================
Trade Secrets By Pratik
========================

#SBFC - VCP Breakout in DTF Script: SBFC
Key highlights: 💡⚡
📈 VCP Breakout in DTF
📈 Short consolidation below Resistance
📈 Volume spike seen during Breakout.
📈 MACD Bounce
📈 Keep in WL
⚠️ Important: If you have any questions about the setup, feel free to drop them below — I’ll respond to each one.
⚠️ Important: Always Exit the trade before any Event.
⚠️ Important: Always maintain your Risk:Reward Ratio as 1:2, with this RR, you only need a 33% win rate to Breakeven.
✅Like and follow to never miss a new idea! ✅
Disclaimer: I am not SEBI Registered Advisor. My posts are purely for training and educational purposes.
Eat🍜 Sleep😴 TradingView📈 Repeat 🔁

Privi Speciality Chemicals Ltd – Weekly Breakout SetupPrivi has shown a clean breakout from a long consolidation zone, backed by steady volume expansion. After months of range-bound action, the stock finally broke above ₹2,600 and is now sustaining well above its breakout zone — indicating the start of a new upward leg.
Price action shows strong bullish candles supported by the 10- and 20-week EMAs, signaling trend confirmation.
🎯 Key Levels:
CMP: ₹2,903 (+2.55%)
Breakout Zone: ₹2,500 – ₹2,600
Target Zone: ₹3,150 – ₹3,250
Stop-Loss: ₹2,700 (weekly close basis)
📊 Technical View:
Weekly breakout from multi-month consolidation box.
Volume confirmation supports sustained momentum.
Price trading above both EMAs, confirming bullish trend continuation.
Minor resistance near ₹2,950; sustained move above can accelerate momentum.
🧠 View:
Privi Speciality Chemicals has completed a strong breakout after a long accumulation phase. Sustaining above ₹2,900 can push the stock towards ₹3,200 levels in the coming weeks.

Timken India Ltd – Strong Breakout Momentum (Daily Chart)Timken India is showing strong bullish momentum after multiple rejections near ₹3,000 levels. The stock has now given a clean breakout from its short-term resistance zone, supported by rising volumes and bullish candles, indicating renewed buying interest.
The price has reclaimed key moving averages and is now eyeing the next resistance zone near ₹3,500–₹3,520, which acts as the target zone on the chart.
🎯 Key Levels:
CMP: ₹3,144 (+2.89%)
Breakout Zone: ₹3,080 – ₹3,100
Target Zone: ₹3,480 – ₹3,520
Stop-Loss: ₹3,000 (on daily close basis)
📊 Technical View:
Breakout above recent swing highs with volume confirmation.
Price now trading above key EMAs, indicating trend reversal.
Bullish continuation likely if price sustains above ₹3,100.
Volume spike adds strength to the breakout setup.
🧠 View:
The breakout from consolidation backed by volume makes Timken India a strong candidate for short-term momentum trades. Sustaining above ₹3,100 can open room toward ₹3,500+, with a stop-loss below ₹3,000.

HEGDrying volume during the pullback, tight contraction in the stock, EMAs are aligned.
There is probability of an upside move.
✅ If you like my analysis, please follow me as a token of appreciation :)
in.tradingview.com/u/SatpalS/
📌 For learning and educational purposes only, not a recommendation. Please consult your financial advisor before investing.

PAYTM LONG TERM INVESTING IDEAPAYTM on weekly chart has now stopped falling further and now consolidating on the lower levels.
Current price level is good to enter and we can add further at around 450 level.
Stop loss can be put around 400 or trail using 20/50 EMA.
This is a LONG term and a bit risky bet but if you have faith in paytm's fundamentals these are really good levels ;)

UNIONBANK | Cup & Handle breakout aheadUNIONBANK | Cup & Handle breakout ahead
CMP : 149
Something interesting is coming up from this counter

Indraprastha Medical Ltd | Bullish Flag Breakout | Swing SetupCompany Overview (Fundamental)
Indraprastha Medical Corporation Ltd (IMCL) operates under the Apollo Hospitals Group and manages the Indraprastha Apollo Hospital, New Delhi — one of India’s largest multi-specialty hospitals. Company financially strong, consistent profitability, improving margins, and low debt.
Fundamentally stable company with consistent earnings and a defensive sector (Healthcare).
Strong base for technical breakout follow-through.
💰 Market Cap: ~₹5,400 Cr
📈 Revenue Growth (YoY): +16% (Strong Growth)
💸 Net Profit Margin: ~10–12% (steady)
💵 Debt-to-Equity: 0.05 (virtually debt-free)
📊 ROE (Return on Equity): ~20%
Technical Overview
The setup represents a bullish continuation phase, with EMAs stacked positively and volume confirming accumulation.
Price trades above all 3 key EMAs (9, 20, 50) — strong bullish alignment.
Formation of a textbook Bullish Flag Pattern after a sharp pole rally from ₹460 to ₹610.
Recent candle closed bullish with +3.4% gain and high volume (2.48M) — indicating renewed buying interest.
RSI ~60 → Momentum healthy and not overbought.
MACD positive crossover developing, confirming bullish trend strength.
Price Action Analysis
Clean, bullish, momentum-driven move with volume confirmation.
Buy on dip near breakout retest at ₹580-583
Book Partial profit at ₹625–630
target 2: ₹655–660 this will be Flag breakout projection.
A perfect risk to reward ratio following.
Disclaimer
This analysis is for educational and research purposes only — not investment advice.
Always do your own due diligence and manage risk before trading.

Indian Hotels Co. Ltd:NSE | swing trading setup | Study🧠 1. Chart Pattern Formation
You’ve drawn and highlighted three rounded bottoms (circled in blue). This resembles a Triple Bottom pattern, which is a bullish reversal formation after a downtrend or a long consolidation.
Support zone: Around ₹710–₹715 (black horizontal line).
Resistance trendline: Descending (green line) connecting lower highs since the major top near ₹900.
If the price breaks above this descending trendline convincingly with volume, it could confirm a trend reversal or at least a strong swing rally.
-----------
📈 2. Key Levels
Support: ₹710–₹715
Immediate Resistance: ₹760 (trendline resistance)
Breakout Target 1: ₹820 (approx. +9–10%)
Breakout Target 2: ₹870–₹900 (approx. +15–16%)
These match the vertical projections (blue measured moves) drawn on the chart.
⚠️ 5. Risks / Invalidations
If the stock falls below ₹710 with volume, the bullish setup fails.
Consolidation can continue if breakout lacks volume.
Broader market weakness (Nifty, hotel sector) could delay the move.
Pattern: Triple bottom with descending trendline
Bias: Bullish if breakout confirmed
Setup Type: Swing trade (2–6 weeks)
Targets: ₹820 / ₹880–₹900
Stop-loss: ₹710
⚠️ Note:
This is not a recommendation to buy or sell. The above analysis is for educational and technical study purposes only. Always do your own research and consider your risk tolerance before taking any trade.

Graphite India: Sparking the Next Electrode UpswingNSE:GRAPHITE
Company snapshot
India’s largest graphite electrode manufacturer; also produces specialty graphite, impervious graphite equipment, GRP pipes and high-speed steel.
Capacity of ~98,000 TPA across plants at Durgapur and Nashik; Germany plant closed. Utilisation stood at ~83% in FY25.
Investing in advanced carbon technologies; announced ~25,000 TPA capacity expansion (~123,000 TPA target).
Market context
Rising share of electric-arc-furnace (EAF) steel globally supports electrode demand.
US anti-dumping duty (~93.5%) on Chinese graphite improves non-Chinese producers’ competitive positioning.
Valuation & stock stats (Oct 2025)
Share price ~₹625; 52-week range ~₹365–₹638.
Market cap ~₹122 billion; P/E ~34; P/B ~2.1; dividend yield ~1.8%.
Peer: HEG and other electrode-cycle players.
Key fundamentals
Q1 FY26 results: Total income ~₹789 crore; PAT ~₹145 crore; EBITDA ~₹200 crore.
Business mix (FY25): Graphite & Carbon ~89%; Steel ~9%; Others ~2%.
Ownership: Promoters ~65% (no pledge); FIIs ~6.6%; MFs ~7.5%; DIIs ~9.6%.
Capacity & capex
Base electrode capacity ~98,000 TPA; plan to expand by ~25,000 TPA.
Expansion capex ~₹600–650 crore; timeline yet to be fully disclosed.
Technical view
Trend: Price is above 200-day moving average (~₹559); near 52-week high.
Support zone: ~₹480–₹510–₹546.
Resistance/breakout zone: ~₹630–₹640.
Strategy: Positive momentum; consider buying on dips with support around ₹540.
Actionable watch-points
Electrode price trends and needle-coke spread (core margin driver).
Execution of the ~25,000 TPA expansion—schedule, funding, payback.
EAF steel cycle developments in India and globally.
Policy/anti-dumping updates impacting Chinese graphite supply.
Capital allocation: capex vs dividend, progress in advanced carbon tech.
Key risks
Slowdown in EAF steel or electrode demand; sharp rise in raw-material (needle coke) costs.
Reversal of favourable trade or tariff policies.
Expansion delays or weaker‐than‐expected product mix shift to lower margin grades.
Stance
Fundamental: Strong balance sheet, favorable cycle exposure, expansion potential.
Technical: Bullish bias
⚠️ Disclaimer:
This analysis is for educational and informational purposes only.
We are not SEBI-registered analysts or advisors.
This is our personal view based on available data and market trends.
Please consult your SEBI-registered investment advisor before making any investment or trading decisions.
You are solely responsible for any financial decisions you make based on this content.
========================
Trade Secrets By Pratik
========================

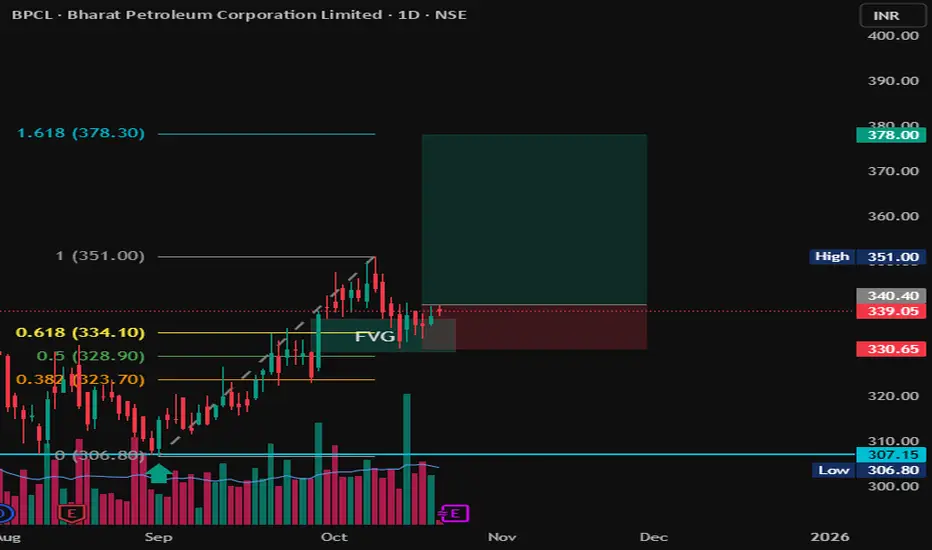
BPCL | FVG + Fibonacci COnfluence | Long Setup toward 378 💬 Description:
Chart Type: 1D (Daily)
Stock: BPCL – Bharat Petroleum Corporation Ltd.
🧩 Setup Overview
BPCL has completed a clean retracement into a Fair Value Gap (FVG) aligning with the 0.5–0.618 Fibonacci retracement zone from the previous upswing (306 → 351).
The zone around ₹334–₹340 acted as strong demand support, hinting at a possible continuation leg to the upside.
📊 Trade Plan
Entry Zone: ₹338–₹340
Stop Loss: ₹330
Target 1: ₹351
Target 2: ₹378 (1.618 Fib Extension)
Risk–Reward Ratio: ~1:3
📈 Technical Confluence
✅ FVG + 0.618 Fib alignment
✅ Retest & bounce confirmation
✅ Volume showing accumulation
✅ Clear higher-low structure maintained
🚨 Invalidation
Setup invalid if price closes below ₹330, which would break FVG and shift structure to bearish.
🧠 Bias: Bullish continuation
Time Horizon: Swing (2–4 weeks)
Jaicorp ltdCup handle pattern with good volume in green days,
Negative days low dry volume .
178 resistance if it break then easily move more up side
Stop loss below handle
9%

GRAPHITE - Near 18months old ResistanceGRAPHITE - The market structure looks strongly bullish, and EMAs are perfectly aligned, confirming trend strength.
The stock is now approaching an 18-month-old resistance zone. A breakout above this level could open the door for a solid upside move.
However, it’s important to wait for a retest and proper confirmation before entering, even during paper trading.
Keep it on your watchlist for paper trading.
✅ If you like my analysis, please follow me here as a token of appreciation :)
in.tradingview.com/u/SatpalS/
📌 For learning and educational purposes only, not a recommendation. Please consult your financial advisor before investing.

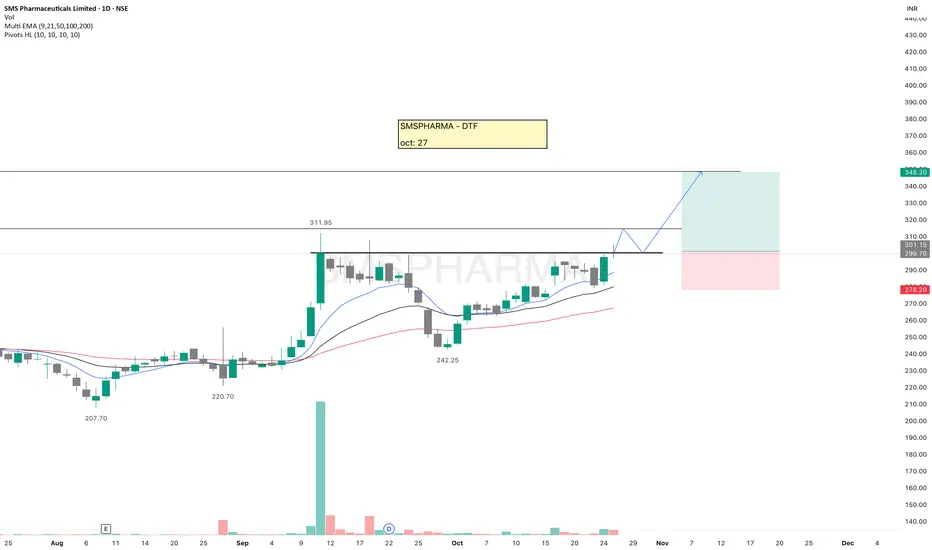
SMSPHARMASMSPHARMA is looking strong and forming a bullish structure. A breakout from the current level can lead to a good upside move.
Even while paper trading, always use a stop-loss, it builds the right trading habit.
Keep this stock on your watchlist.
✅ If you like my analysis, please follow me here as a token of appreciation :)
in.tradingview.com/u/SatpalS/
📌 For learning and educational purposes only, not a recommendation. Please consult your financial advisor before investing.
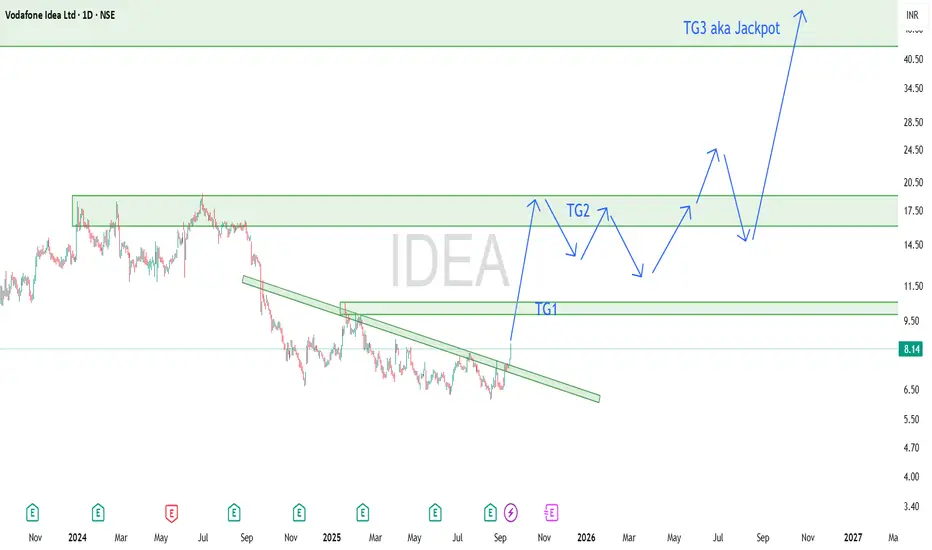
How to make Vodafone Idea a multibagger by 2026-2027After consolidating heavily at the bottom IDEA is finally moving up, We can plan for a long term view for insane profits, it will take months though. If your view is short just keep looking for bullish inside candle after a retracement and enter or Look out for good options CE setups in intraday for the next year or so, You can ride using 20 and 50 SMAs.
I'm gambling on the path(shown in arrows) it might take to reach jackpot, Remember holding that long will be a BUMPY ride, there might be deep retracements, expert traders will add more on those, Noobs will end up panicking and sell on the low of retracements and regret later. We also might see a couple of months long consolidations. If you are happy with the TG1, TG2 gains, you can book early and enter again when a good bullish setup forms.
OR this plan will fail miserably but its worth trying ;)
Entry at CMP or around 7
SL at 5.95
Targets 10, 18, 40 and beyond..
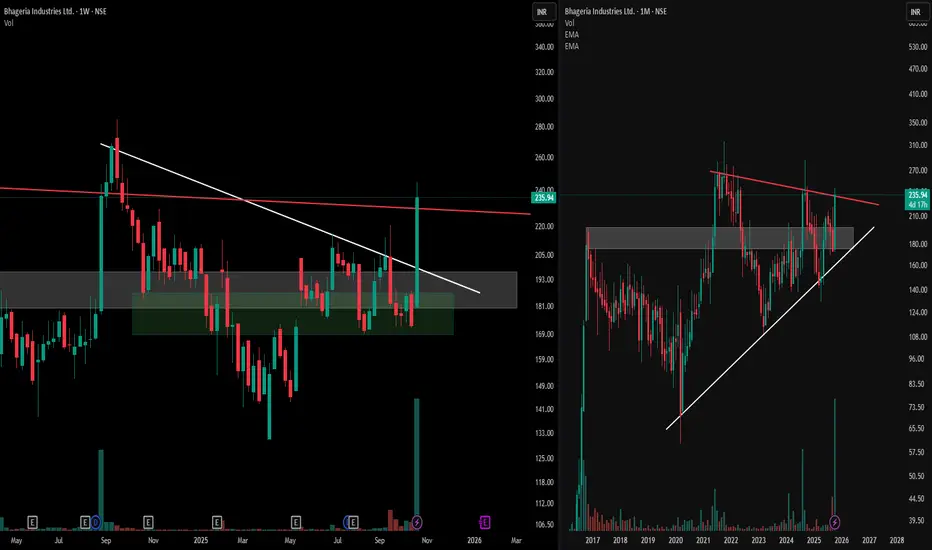
Mastering MTFA Charts : Symmetrical & Descending PatternsObserve the synergy of multiple time frames with this detailed analysis of Bhageria Industries Ltd.
Target Points -
1) The right panel displays a monthly chart, highlighting a broad symmetrical triangle formation within a prominent supply-demand zone—notice how the structure showcases the interplay of lower highs and higher lows, reflecting a period of equilibrium and market compression.
2) The left panel brings the focus to the weekly time frame, where a descending triangle pattern unfolds, providing additional insight into the ongoing price structure.
3) This multi-time frame approach emphasizes how patterns from broader time frames interact with shorter-term consolidations, enhancing our ability to spot critical decision areas on the charts.
4) Using both the monthly and weekly perspectives together, traders and learners can deepen their understanding of structural price action, pattern development, and the relevance of context provided by supply and demand zones. Dissecting these formations side by side promotes disciplined, informed chart reading without bias towards anticipating outcomes.
This analysis is for educational purposes only and does not constitute financial advice.
WELENTWELENT is forming a bullish structure. After multiple rejections at resistance, it finally broke out, retested, and is turning bullish again.
There’s good volume and tight contraction near the SHS. If it sustains above 560, there’s a strong probability of an upside move.
Keep this stock on your watchlist.
✅ If you like my analysis, please follow me here as a token of appreciation :)
in.tradingview.com/u/SatpalS/
📌 For learning and educational purposes only, not a recommendation. Please consult your financial advisor before investing.
