INOXWINDINOXWIND is showing strength, a breakout from the current level could lead to a good upside move.
The structure is turning bullish, EMAs are getting aligned.
If it sustains above 155 then there is probability of an upward move.
Resistance: around 165, above which we may see 174.
Keep it on your watchlist.
✅ If you like my analysis, please follow me here as a token of appreciation :)
in.tradingview.com/u/SatpalS/
📌 For learning and educational purposes only, not a recommendation. Please consult your financial advisor before investing.
Swingtrading

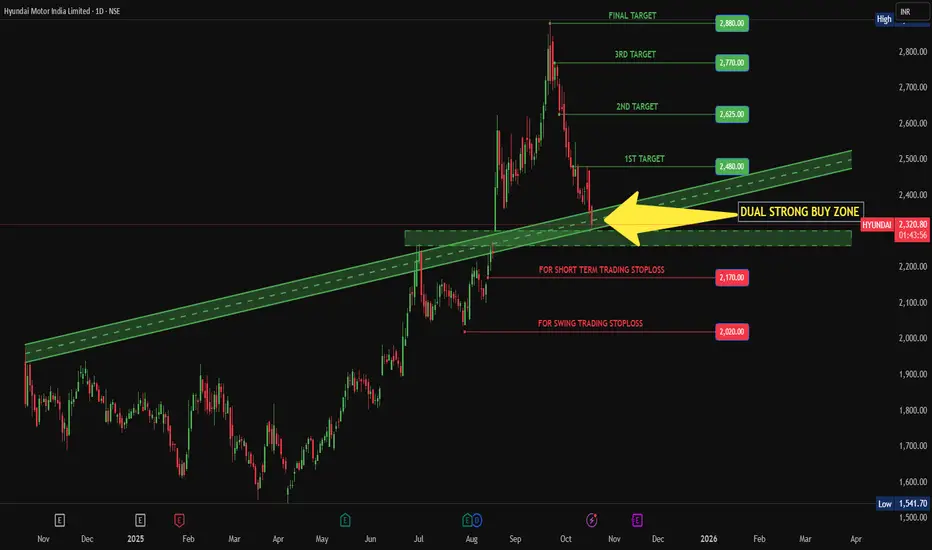
HYUNDAI IN STRONG BUY ZONEHyundai Motors India reach at dual strong buy zone area to consider as a long trade, use your skill as well knowledge to enter in a trade not guaranteed return. Do your own research than make a trade. But technically and fundamentally Hyundai is in good spot to consider as a long trade.
Bitcoin – Buying the Trendline, Not the HypeBitcoin (BTCUSD) continues to respect its rising trendline structure , showing consistent demand on every retest. This type of price action often reveals where smart money is quietly adding positions, not chasing, but accumulating near support.
Each of the highlighted points shows how price has respected this trendline multiple times, forming a clean series of higher lows. As long as this level holds, the broader direction remains bullish.
Currently, BTC is testing this key support once again. I’m positioning near the trendline because the risk is clearly defined , and the potential reward toward 111K+ remains wide open.
Short-term volatility can still appear, but structure beats emotions . As long as buyers defend this zone, we may see another impulsive leg forming soon.
Disclaimer: This analysis is for educational purposes only. It’s not investment advice. Always do your own research before trading.

NUVOCO | Simple trendline breakout - Looks good for 35-50%NUVOCO | Simple trendline breakout - Looks good for 35-50%
CMP : 422 (Dip : 380)

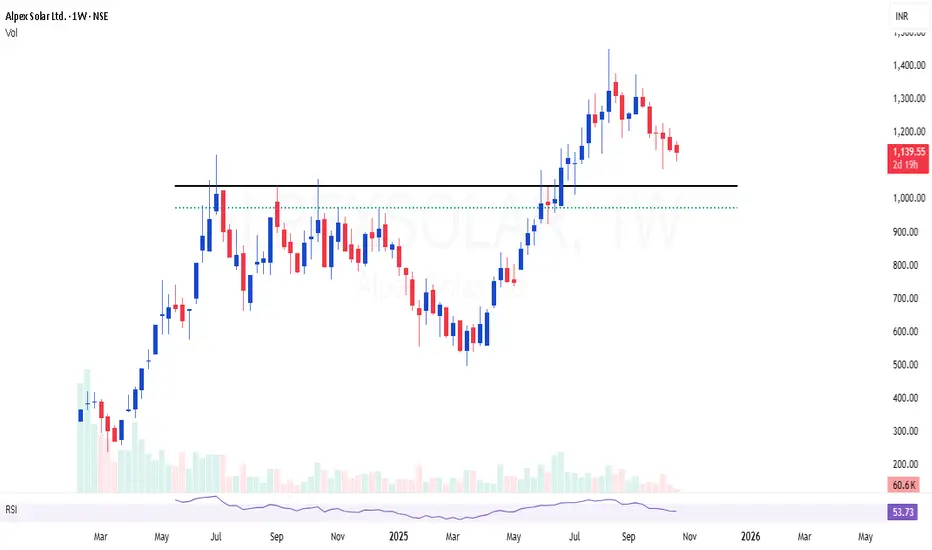
ALPEXSOLAR | Strong breakout and ready for next leg of rallyALPEXSOLAR | Strong breakout and ready for next leg of rally, Cash flow increasing
CMP : 1140
RBLBANK | Stock is getting re-rated - Looks good for doublingRBLBANK | Stock is getting re-rated - Looks good for doubling
CMP : 325

Candlestick Secrets Traders Never Tell YouDiscover candlestick patterns hidden in plain sight and master their true power like never before
Charts used in this Video are over 3 months old

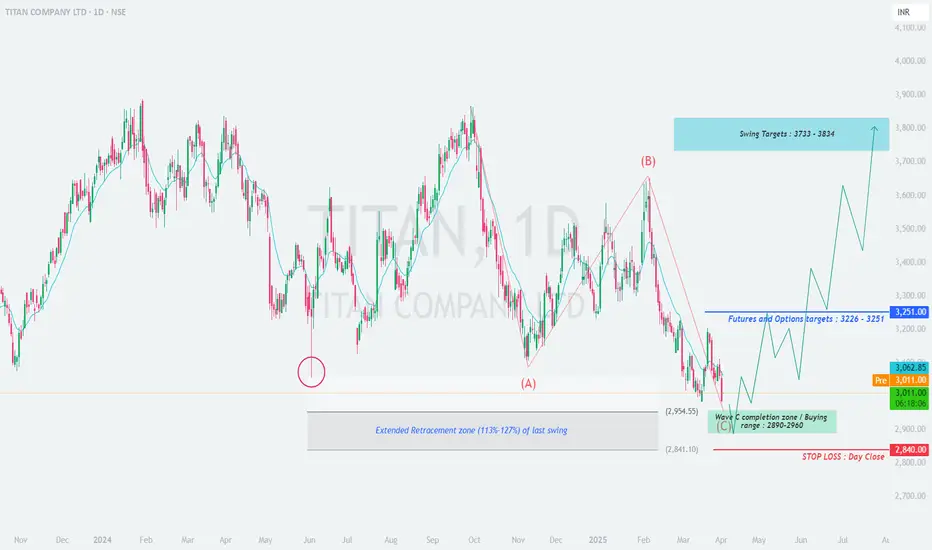
TITAN - High Probability Reversal SetupTITAN COMPANY LTD (NSE:TITAN) - High Probability Reversal Setup
Weekly Timeframe Analysis | Potential Swing Trade Opportunity
▲ BULLISH CASE
Elliott Wave Structure:
• Appears to be completing Wave C of correction (ABC pattern)
• Wave C = 1.272 extension of Wave A at ₹2,890-2,960 zone
• Typical reversal area for such corrections
Technical Confluences:
• Fibonacci Support:
1.127-1.272 retracement of prior uptrend
Aligns with 2023 swing high area
• Volume Profile:
High volume node at ₹2,920
Declining volume on recent downmove
Pattern Recognition:
• Potential falling wedge (bullish)
• RSI(14) weekly showing bullish divergence
• MACD histogram flattening near lows
▼ RISK FACTORS
• Breakdown below ₹2,840 invalidates setup
• Broader market weakness could delay recovery
• FIIs reducing positions in consumer sector
📊 Trade Plan
Entry Zone: ₹2,890-2,960 (scale-in approach recommended)
Stop Loss: Daily close below ₹2,840 (absolute)
Targets:
T1: ₹3,226 (61.8% retrace)
T2: ₹3,733 (previous high)
T3: ₹3,834 (127% extension)
Timeframe: 8-12 week hold for full targets
📌 Key Levels
Support
Resistance
₹2,960 (immediate)
₹3,100 (200 DMA)
₹2,890 (strong)
₹3,226 (F&O OI peak)
₹2,840 (absolute)
₹3,733 (ATH)
💡 Additional Notes:
• Watch for bullish reversal candle patterns in the zone
• FII derivative data shows put writing at ₹2,900 strike
• Consumer sector showing relative strength vs Nifty
Would you take this trade? Discuss in comments!
#TITAN,#NSE,#swingtrading,#elliottwave,#technicalanalysis
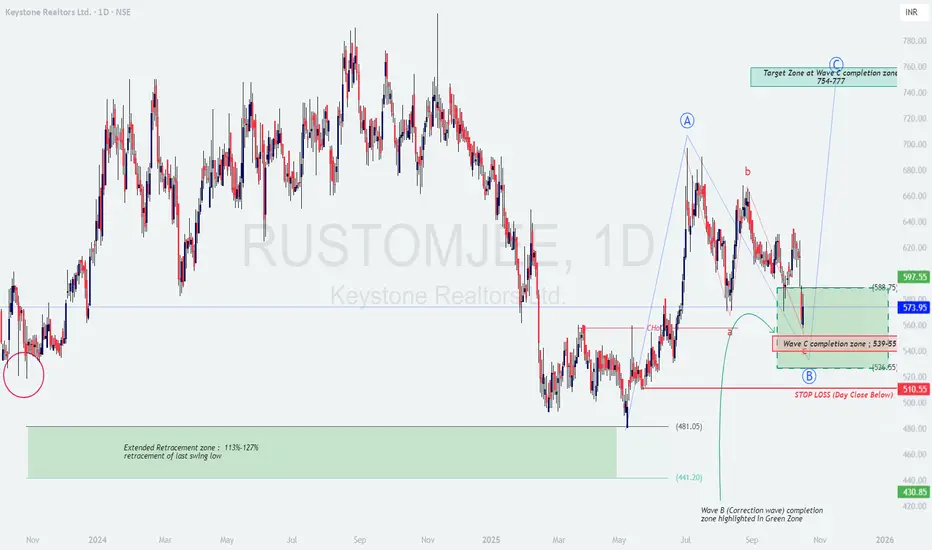
RUSTOMJEE: Structure Shift Pending Structure overview
Price has completed a corrective downswing into a high-probability demand cluster marked as the Wave C completion zone 539–551 , aligning with prior structure support and the recent change‑of‑character (ChoCH) retest. The preceding upswing from May formed an impulsive leg (A), followed by a three‑leg pullback (a‑b‑c) that is now basing near the green box.
The broader thesis is a potential transition from correction to the next advancing leg (C) if the stock holds above the invalidation band and reclaims the upper boundary of the box with expanding volume.
Key levels
Buy zone: 551–539 (staggered entries).
Trigger confirmation: Daily close above 573–575 (ChoCH shelf) and then 588–590 (range high) to open momentum.
Targets: T1 597–605 (gap/structure), T2 654–675 (swing supply), Primary target 754–777 (projected Wave‑C completion).
Invalidation/Stop: Day close below 510–512 cancels the bullish swing; expect deeper retest into 481–441 if violated.
Momentum and pattern notes
The decline into 539–551 shows slowing downside and overlapping candles, consistent with completion of wave c. A higher low above 539 followed by a break of 588 would confirm a trend inflection.
Volume expansion on green days near 560–575 will strengthen the reversal case; weak bounce with fading volume would argue for more range before lift‑off.
Trade plan (cash/swing)
Entry 1: Accumulate small size within 551–539 with a tight stop under 535 intraday and core stop on day close below 510–512.
Entry 2 (confirmation): Add on a daily close above 573–575; raise stop to 545.
Entry 3 (breakout): Add on strong close above 588–590 with volume; trail under the breakout bar low.
Exits: Scale 30–40% at 597–605, another 30% around 654–675, and ride the rest toward 754–777 with a weekly trailing stop under higher lows.
Option tactics (if applicable)
Bull call spread when cash closes above 575: buy near‑ATM call, sell +80 to +120 OTM to reduce theta and cap risk. Consider a calendar call around 560 if expecting a slower grind higher. Exit or roll if the stock loses 575 on a closing basis after entry.
Risk management
Position sizing: Risk a fixed fraction of equity (0.5–1%) based on the 510–512 invalidation; avoid adding if price threatens the stop.
Respect daily/weekly closes for decisions; intraday spikes are common near base zones.
If the stock closes below 510–512, step aside and wait for a fresh base closer to 481–441.
Prediction
Base‑case scenario favors a swing advance from 551–539 toward 597–605, then 654–675 within 2–6 weeks, with the potential to extend into 754–777 if 590 holds post‑breakout and market breadth supports. Failure to reclaim 575–590 quickly would likely keep the stock range‑bound between 551 and 590 before the next directional move.
Disclaimer: This post is for education only and is not investment advice or a solicitation to buy/sell securities; I am not a SEBI registered analyst .
Buy Glenmark : Gap Fill Swing Setup📅 Gap Up Observed: 11 July 2025
🧩 Setup Type: Gap Fill + Rally Base Rall
🧠 Trade Logic
- 🔼 A gap-up occurred on 11 July, signaling bullish momentum.
- 📉 The market subsequently filled the gap, a common technical behavior.
- 🛡️ After the gap fill, price has retraced a level where we can see rally base rally.
- 🎯 Based on this structure, I identified a swing opportunity aligned with my setup rules.
📊 Position Details
- 🟢 Entry: AMO Order placed. I will get the open price today. Oct 17, 2025
- 🚫 Stop Loss: Not placed (managed via time-based exit).
- ⏳ Exit Plan: Will close the position within 14 calendar days, based on price action and momentum.

Multi‑Timeframe RSI Divergence Strategy with CandlesticksA confluence-based setup combining higher timeframe levels, RSI divergence, and candle signals for high‑probability swing entries . Sharing how to Create and backtest strategies on Trading view platform .
Charts used are 3 months or older .

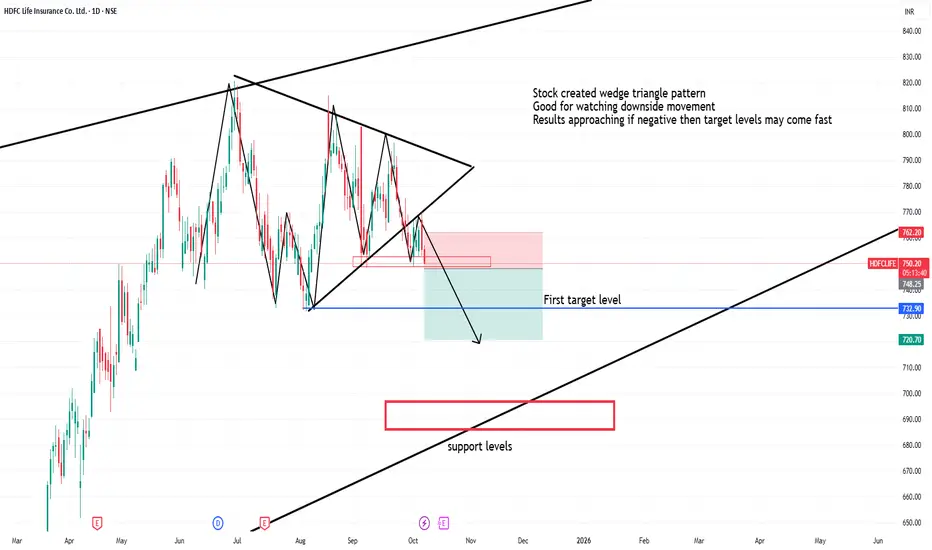
Hdfclife created bearish wedge triangle patternStock created wedge triangle pattern
Good for watching downside movement
Results approaching if negative then target levels may come fast
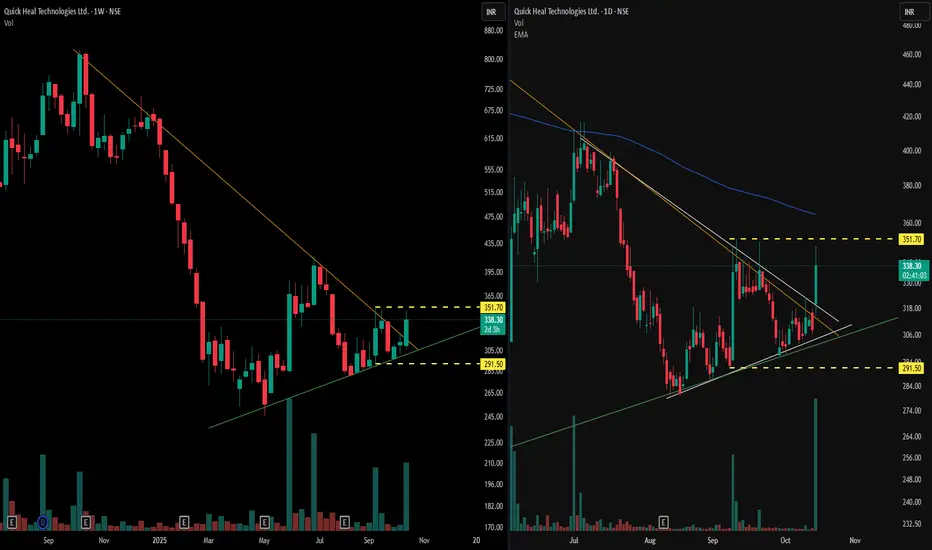
Multi-Timeframe VCP Observations📊 Weekly Time Frame Observations (left panel)
- It displays a visible pattern contraction structure, specifically a Volatility Contraction Pattern (VCP), formed over multiple months
- An orange trendline marking the descending resistance, and a green line depicting the rising support, which together highlight the range contraction of price
- Volume spikes coincide with specific price responses at these zones, denoting heightened activity during volatility periods within the VCP
📈 Daily Time Frame Observations (right panel)
- Presents a more compressed Volatility Contraction Pattern (VCP), mirroring the broader weekly setup but over a shorter time span.
- Below the blue 200-day exponential moving average
❗ Disclaimer: The above post is strictly observational and does not constitute any trading advice or predictions regarding breakout or price direction.
Don’t Miss This Rare MCX Setup Breakout + Retest= Big Move AheadHello Traders!
Today’s analysis is on MCX Ltd., where we just spotted a powerful Descending Triangle Breakout . After weeks of consolidation, the price has finally broken the falling resistance and even retested the breakout zone. This setup often leads to a strong trending move.
Why this setup is special?
Price respected support multiple times, showing heavy demand from lower levels.
Breakout + Retest makes it one of the most reliable continuation patterns.
Risk–Reward is highly favorable for both short-term and positional traders.
Levels to Track:
Currently, the best accumulation zone lies between 8000–8155 , which gives a low-risk entry point. On the upside, the immediate short-term target is around 8446 , while the medium-term level aligns with the previous ATH near 9115 . If momentum sustains, the stock even has potential to reach the positional target of 9774 . For risk management, traders can keep a short to medium-term stop loss at 7788 , while positional traders may consider a wider SL at 7522 .
Rahul’s Tip:
Such breakouts don’t come often. Once the retest is done, the real rally usually begins. Traders who wait too long often end up chasing the move at much higher prices.
If you want to catch these setups before they take off, make sure you follow closely — (Analysis By @TraderRahulPal, TradingView Moderator). More analysis & educational content is shared regularly on my profile. Sometimes one breakout can change your trading month completely. If this helped you, don’t forget to like and follow for regular updates.
Disclaimer:
This analysis is for educational purposes only and should not be taken as financial advice. Please do your own research or consult your financial advisor before investing.

Aurobindo Pharma – Strong Core, Next Growth AheadNSE:AUROPHARMA
🔹 Fundamental Overview
Aurobindo Pharma is a diversified, integrated pharmaceutical company with a strong presence in generics, APIs, and specialty formulations, operating across over 150 countries.
Market Capitalization: Around ₹65,000 crore—a large-cap pharma player with stable earnings visibility.
Valuation: Trades at a P/E of about 18–19× and P/B near 2×, making it fairly valued compared to peers.
Profitability: Return on Equity (ROE) around 10–11% and Net Profit Margin near 10%, reflecting steady but moderate profitability.
Balance Sheet Strength: Low leverage with Debt-to-Equity ratio of roughly 0.25, highlighting financial discipline.
Growth Trend: Revenues and earnings have shown consistent moderate growth, with recent improvement in operating margins driven by cost control and new product launches.
Dividend Policy: Low dividend payout; management prioritizes reinvestment and expansion.
Strengths: vertically integrated model, global footprint, diversified product portfolio, and strong R&D capabilities.
Risks: Regulatory scrutiny (especially in the USFDA space), pricing pressure in generic markets, and raw material cost volatility.
🔹 Technical Overview
Trend Direction: The stock maintains a bullish to neutral bias, trading above its 50-day and 200-day moving averages, showing medium-term strength.
Momentum: RSI near 55–60, suggesting balanced momentum without overbought signs.
Trend Strength: ADX around 30 indicates a healthy ongoing trend; MACD remains in positive territory, supporting upward bias.
Support Levels: Strong base between ₹1,030 and ₹1,070, ideal zone for accumulation.
Resistance Levels: Key resistance lies around ₹1,120 – ₹1,150; a breakout above this range may trigger sustained upside.
Long-Term Projection: On a 3–5-year horizon, strong fundamentals and sector growth could drive price toward ₹2,500+.
Risk Management: Maintain stop-loss near ₹1,000 to safeguard capital; trail stops as price advances beyond ₹1,200.
🔹 Investor Takeaway
Outlook: Aurobindo Pharma combines financial stability, diversified revenue, and steady earnings visibility—well-positioned for long-term growth.
Strategy: Accumulate on dips near support zones and add on breakouts above ₹1,150 with confirmation.
Investment Horizon: Suitable for investors seeking medium-to-long-term exposure (1–5 years) in India’s resilient pharmaceutical sector.
Risk Profile: Moderate—best for investors comfortable with regulatory and currency-related volatilities.
========================
========================
⚠️ Disclaimer:
This analysis is for educational and informational purposes only.
We are not SEBI-registered analysts or advisors.
This is our personal view based on available data and market trends.
Please consult your SEBI-registered investment advisor before making any investment or trading decisions.
You are solely responsible for any financial decisions you make based on this content.
========================
Trade Secrets By Pratik
========================

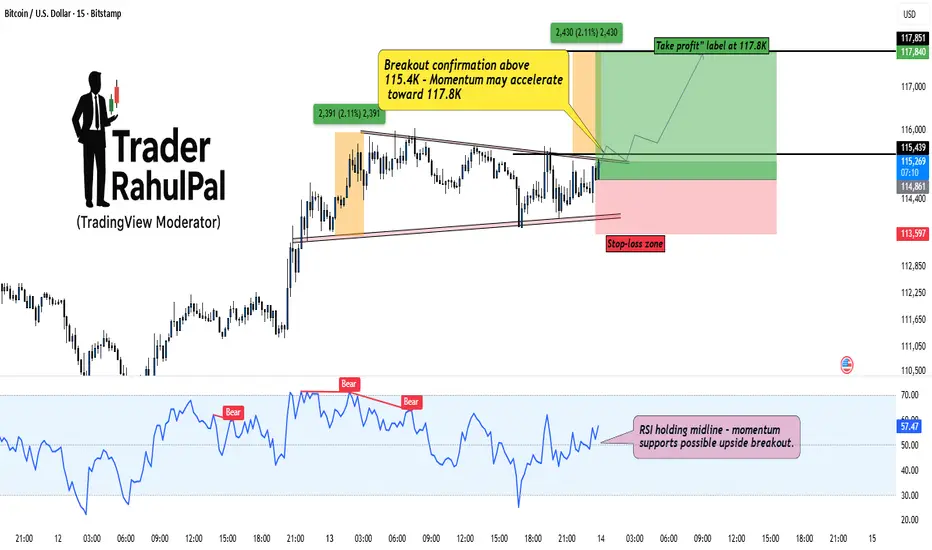
BTC – Building Discounted Longs Before the Breakout?Bitcoin (BTCUSD) is currently consolidating within a tight compression zone, showing signs of accumulation near 114.8K–115.4K . The market is coiling up right under resistance, hinting that a potential breakout could be around the corner.
As seen on the chart, structure remains bullish with a well-defined base and higher low formation. The key breakout confirmation lies above 115.4K , which could trigger a momentum push toward 117.8K , aligning with previous swing projections.
However, I’m personally building a small discounted entry position even before the confirmed breakout. The reason? When momentum starts expanding, it rarely gives clean entries, so catching early positioning near support provides better R:R potential.
RSI is holding above the midline, reflecting sustained buyer strength, while volume compression suggests a volatility expansion phase ahead. If price manages to sustain above the upper trendline, expect quick upside continuation.
Stop-loss remains below 113.6K to stay protected against fakeouts.
Rahul’s Tip:
Smart money often positions early when the crowd hesitates — timing matters, but conviction matters more.
Analysis By @TraderRahulPal (TradingView Moderator)
If this helped you spot the setup early, like and follow for more real-market insights.
Disclaimer: This analysis is for educational purposes only and should not be taken as financial advice. Please do your own research or consult your financial advisor before investing.
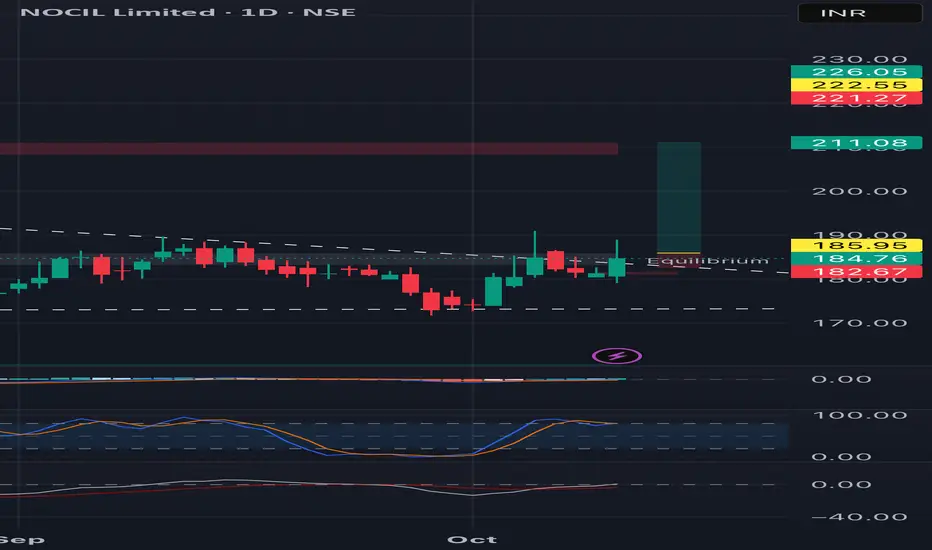
Breakout in NOCILPossibility of a strong breakout in NOCIL.
One can enter above 186 for a possible target of 210.
Note - I am not SEBI registered. This is only for educational purpose..
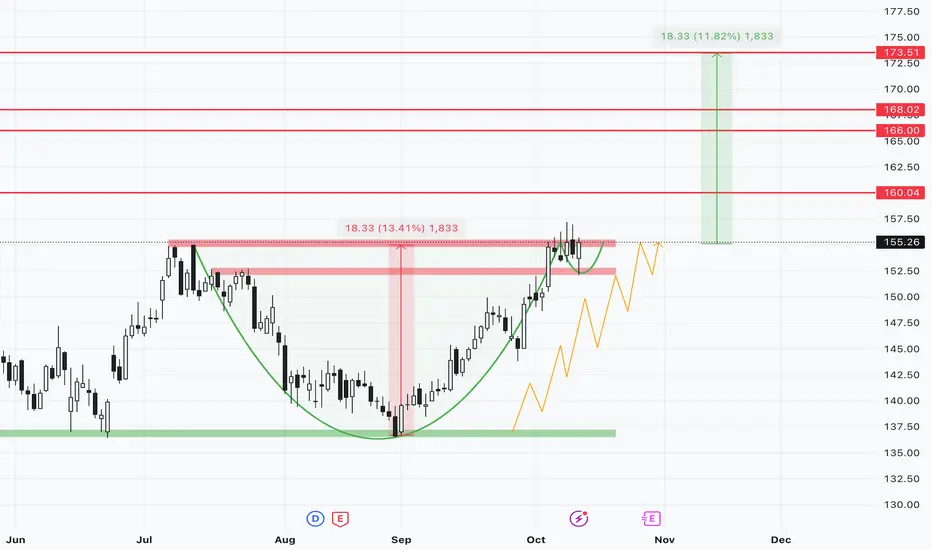
IOC - Potential breakout swing candidateChart Analysis :
Price sustaining near its major resistance of 155 and gave a retest today near 152 level. If breaks out and sustains 1hour above 156 can consider for long. Following a Cup and Handle pattern with Higher Highs intact from recent September lows.
Key Levels :
Support : 152/150
Resistance/Targets : 157/160/166/168/173
StopLoss: 150 Closing basis
Disclaimer:
I am not SEBI registered. This analysis is for educational purposes only and not investment advice. Please do your own research before trading or investing.
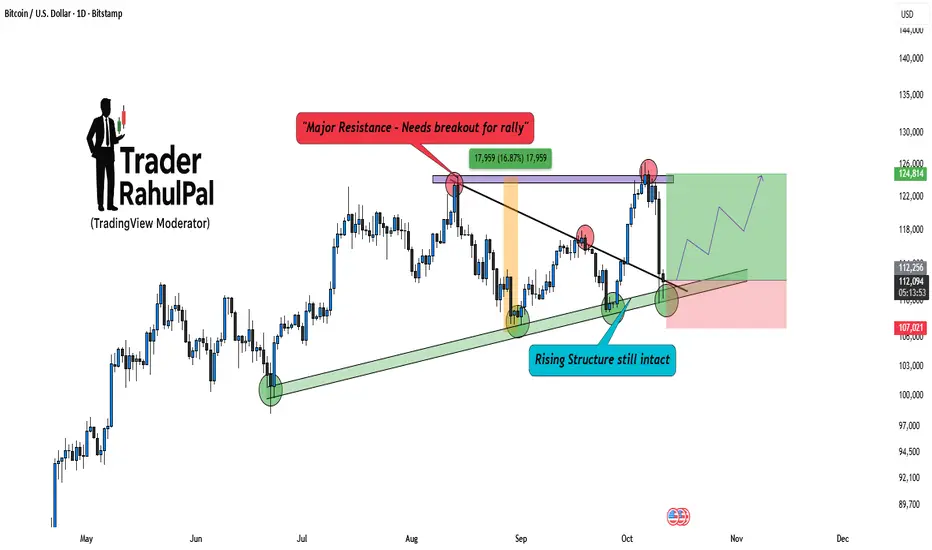
Bitcoin – Rising Structure Still Intact, Bulls Aren’t Done YetBitcoin (BTCUSD) continues to respect its rising structure , even after a sharp pullback from the resistance zone near 125K. While short-term traders might see this as weakness, price action tells a different story, the overall structure is still intact and favors the bulls.
Notice how BTC once again bounced from the ascending trendline support, confirming that institutional buyers are still active around these zones. The recent rejection was from a well-defined major resistance area , but as long as Bitcoin holds above the rising support band, the bias remains positive.
A breakout above 125K will open the doors for another impulsive leg toward 130K+ levels . On the downside, any sustained drop below 107K could temporarily shift momentum, but so far, there’s no structural damage visible.
Analysis By @TraderRahulPal (TradingView Moderator)
If this structure analysis helped you, like and follow for more insights on BTC’s long-term cycles.
Disclaimer: This analysis is for educational purposes only and should not be taken as financial advice. Please do your own research or consult your financial advisor before investing.
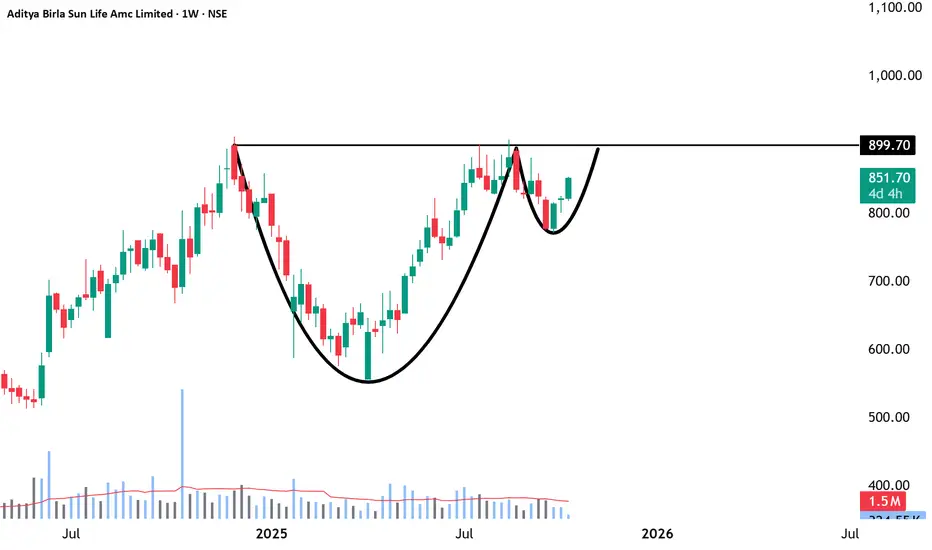
Aditya Birla Sun Life AMC-Built to Compound, Poised to BreakoutNSE:ABSLAMC
🔹 Fundamental Overview
Business Strength—One of India’s leading asset management companies, part of the Aditya Birla Group; operates across mutual funds, PMS, and AIF segments.
Financial Health – Debt-free balance sheet with excellent profitability and high cash reserves.
Profitability Metrics – ROE around 28%, ROA near 25%, and net margins above 50%, indicating strong operational efficiency.
Growth Trend – Revenue and net profit are both growing at ~20–25% YoY, supported by rising AUM and stable fee income.
Valuation—Trades near 24× P/E and 6–7× P/B; premium valuation justified by brand strength and consistency, but limits margin of safety.
Dividend Policy – Moderate yield (~1.5–1.7%) with regular payouts; good for long-term income seekers.
Key Positives—Strong parentage, scalable business, high ROE, and steady market share gains.
Key Risks—Market-linked revenues, fee compression risk, and competition from passive products and fintechs.
🔹 Technical Overview
Trend Bias—The long-term trend remains bullish, with the price comfortably above the 50-DMA (₹838) and 200-DMA (₹748).
Momentum – RSI around 55–60, neutral to mildly positive; no overbought signs.
Trend Strength – ADX below 20 shows consolidation; potential for trend expansion if volume picks up.
Crucial Support Zone – ₹ 815 – ₹ 830; strong base for accumulation.
Resistance Zone – ₹ 854 – ₹ 860; a breakout above this range may trigger a sustained rally.
Long-Term Projection – 2,500+++ possible over 3–5 years in favorable market conditions.
Risk Control – Maintain stop-loss below ₹ 810 for long positions; trail profits once above ₹ 900.
🔹 Investor Takeaway
Outlook—Fundamentally robust, financially sound, and technically poised for breakout after consolidation.
Strategy—Ideal for gradual accumulation on dips and adding on confirmed breakouts above ₹ 860.
Time Horizon – Best suited for 1–5 year investors seeking stable compounding from a high-quality financial business.
========================
========================
⚠️ Disclaimer:
This analysis is for educational and informational purposes only.
We are not SEBI-registered analysts or advisors.
This is our personal view based on available data and market trends.
Please consult your SEBI-registered investment advisor before making any investment or trading decisions.
You are solely responsible for any financial decisions you make based on this content.
========================
Trade Secrets By Pratik
========================
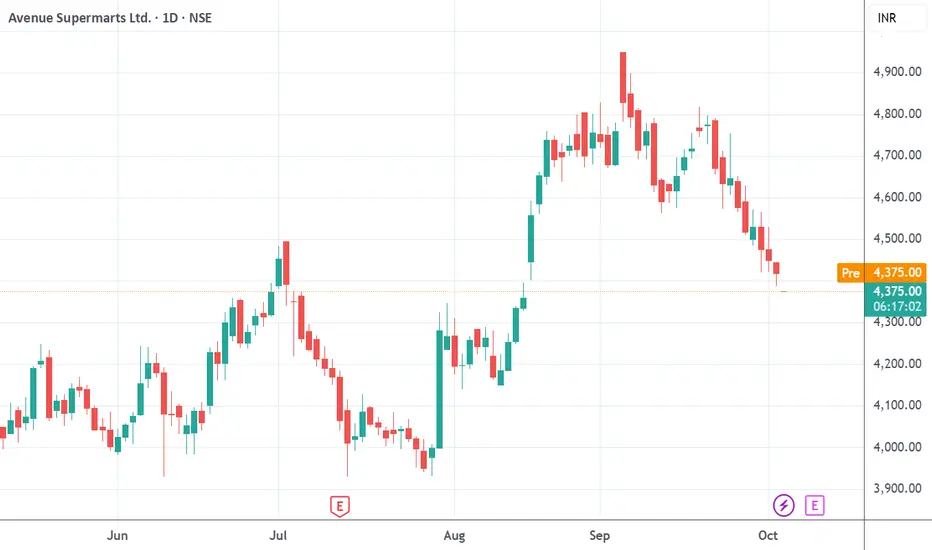
Trade Setup: DMART | Rally–Base–Rally zone 14AUG25🟢 Trade Setup: DMART (Avenue Supermarts Ltd)
- 📅 Entry Date: Oct 06, 2025
- 💰 Buy Price: ₹4375
- 🔍 Setup Logic: Rally–Base–Rally zone identified around 14AUG25, signaling bullish continuation
- 🧠 Bias: Anticipating momentum build-up into the 14AUG25 zone
- ⏳ Exit Plan: Will exit before Oct 20, 2025 (14 days from entry)
- 📌 Exit Price: To be updated post execution
- 📊 Trade Type: Positional, short-term momentum play
- 🛡️ Risk Note: Time-based exit strategy, not dependent on price target
#DMART #RallyBaseRally #TradeSetup #PositionalTrade #StockMarketIndia #TechnicalAnalysis #TradeJournal #MomentumPlay #ShortTermTrade #TradingViewIndia #EthicalTrading #TradeHow #OctTrades #NSEStocks #PriceAction #ExitStrategy #TradingDiscipline
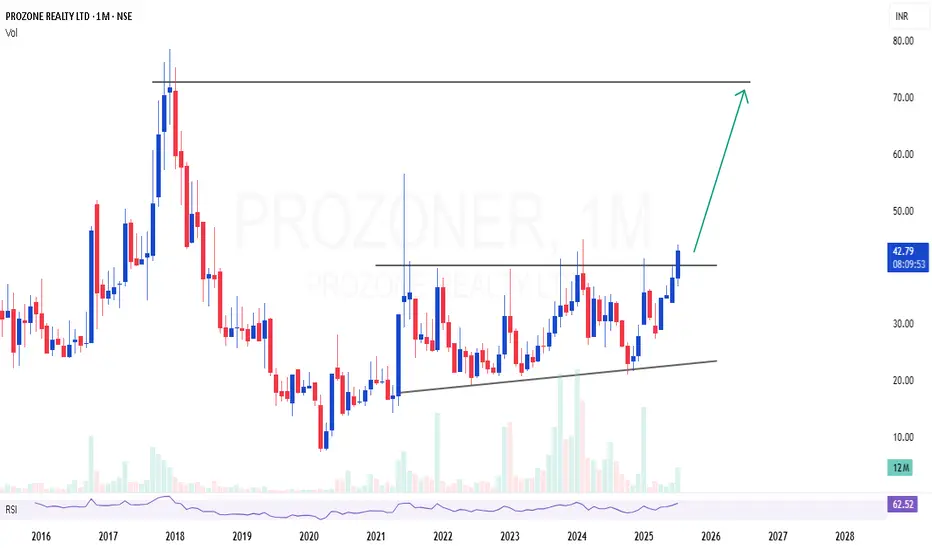
PROZONER | Excellent monthly breakout and closePROZONER | Excellent monthly breakout and close
Long consolidation and closed above the resistance in monthly time frame
Looks potential for 50-60% room
CMP : 42 (Dip : 35)
SL : 30
Bitcoin Correction = Smart Money Opportunity, ready for 3% move!Bitcoin (BTCUSDT) has been consolidating inside a well-defined descending channel , reflecting a healthy correction phase after the recent rally. While many traders panic in these phases, experienced players know that corrections are temporary, structures define direction.
Notice how price is approaching a key zone between 117K–116K, which aligns perfectly with both the lower channel boundary and the prior breakout retest zone. This area acts as a high-probability reversal zone , where strong hands are likely waiting for confirmation candles to re-enter the trend.
Psychologically, the 120K round level remains crucial. Expect volatility near this zone, as retail traders get trapped while smart money positions itself quietly before the breakout.
Once the breakout sustains above 121K, short-term traders could target levels around 122.5K–123K , while positional traders may aim for much higher structural targets.
Rahul’s Tip:
Never fear a pullback when structure stays intact, institutions use these dips to accumulate while the public exits too early. Stay patient, let the structure play out.
Analysis By @TraderRahulPal (TradingView Moderator)
If this breakdown and re-entry logic helped you, don’t forget to like and follow for regular updates.
Disclaimer: This analysis is for educational purposes only and should not be taken as financial advice. Please do your own research or consult your financial advisor before investing.
