BSEAfter a good fall now BSE is showing some strength. It has given a breakout of a falling trendline on the daily time frame. One can look to enter here or at dips till 2280.
Stop loss 2180
Target- 2450, 2500, 2550,
Disclaimer- This is just for educational purposes.
Follow for more such learning and analysis.
Jai Shree Ram
Swingtrading

Bitcoin – Rising Higher, But the Real Battle Is Yet to Begin!Bitcoin continues to trade inside a rising structure , respecting both its long-term support and resistance channels. The trend remains healthy as long as price holds above the 116,000–116,500 support zone , which has been tested multiple times with strong buying reactions.
Currently, BTC is approaching a major resistance confluence zone . The chart clearly shows that every previous rejection near this zone has led to profit-booking, but this time the structure looks different, buyers are more confident, and momentum is building from the base levels .
If Bitcoin manages to sustain above the minor resistance area , the road opens towards 131,500 levels and beyond . However, traders should remember, such breakouts demand patience, not prediction. The stronger hands will always think in cycles, not candles .
The psychology of the market here is simple: every pullback to the rising support attracts accumulation by smart money , while emotional traders exit too early. This phase often separates investors from speculators.
Rahul’s Tip : Don’t fear the dips. Fear missing the structure that defines the entire bull leg. If the support holds, this could be the foundation of the next major BTC wave.
Disclaimer: This analysis is for educational purposes only and should not be taken as financial advice. Please do your own research or consult your financial advisor before investing.
Analysis By @TraderRahulPal (TradingView Moderator) | More analysis & educational content on my profile
👉 If you found this helpful, don’t forget to like and follow for regular updates.

TATA STEEL Tata Steel has been facing resistance near 159 level.
It gave BO and also re-tested it. Today we can see there is good volume, there is probability of an upside move.
Keep eyes on it.
✅ If you like my analysis, please follow me here as a token of appreciation :)
in.tradingview.com/u/SatpalS/
📌 For learning and educational purposes only, not a recommendation. Please consult your financial advisor before investing.

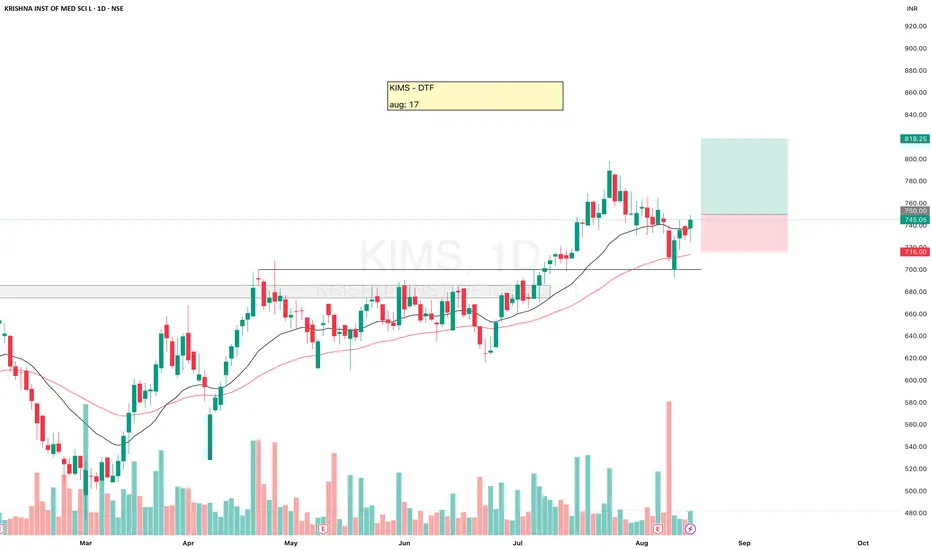
KIMSKIMS - Price action is Bullish.
The stock gave a breakout above the ₹700–710 zone earlier.
Recently, it came down for a retest and respected that support level.
EMA Structure
Price is trading above all key EMAs (20, 50, 100, 200), also above 200ema for the last 4months.
This alignment shows a healthy uptrend and strong momentum.
Volume
On 8th Aug, there was a big red candle with slightly higher-than-average volume. It looked like profit booking or short-term panic selling, not a genuine trend reversal.
If the fall was real distribution, we would have seen more follow-up red candles with heavy volume. But instead, after that day, volume picked up on the upside, showing buyers absorbed the selling pressure and defended the support.
Price is trying to bounce back after retesting.
One must use the SL.
✅ If you like my analysis, please follow me as a token of appreciation :)
in.tradingview.com/u/SatpalS/
📌 For learning and educational purposes only, not a recommendation. Please consult your financial advisor before investing.
ZUARIThe stock has successfully retested its breakout zone and is showing signs of strength.
Trading above all key EMAs with a clean alignment, confirming a strong trend bias.
Recent sessions show low-volume, tight-range contraction, often a precursor to a decisive move.
Today’s hammer candle at the support zone reflects buying interest.
A sustained move above ₹305 with rising volume could open the door for further move.
✅ If you like my analysis, please follow me as a token of appreciation :)
in.tradingview.com/u/SatpalS/
📌 For learning and educational purposes only, not a recommendation. Please consult your financial advisor before investing.

HINDZINCHINDZINC
Stock looks good, constantly moving above all key EMAs from a last couple of sessions, especially sustaining above 20ema.
Tight contraction near resistance area, a breakout from here may give a good upside move.
Keep it in your watchlist for paper trades.
✅ If you like my analysis, please follow me as a token of appreciation :)
in.tradingview.com/u/SatpalS/
📌 For learning and educational purposes only, not a recommendation. Please consult your financial advisor before investing.

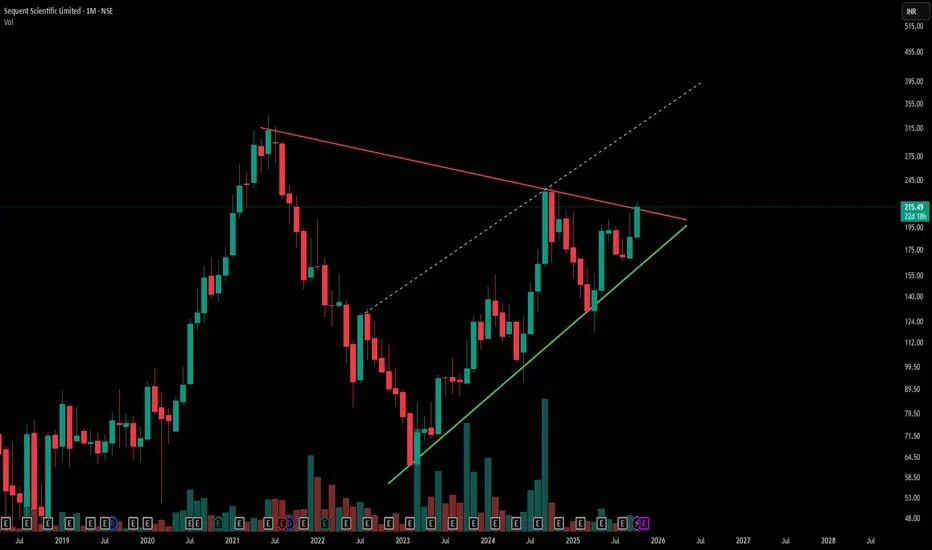
Symmetrical Triangle Breakout Watch | Sequent Scientific-Red line marks a key counter trendline (resistance) from previous swing highs, acting as a short-term ceiling.
-Green line indicates the primary trendline (support) from recent swing lows, showing steady price strength.
-Hidden dashed lines reveal underlying resistance zones, adding complexity to potential breakout levels.
-The overall chart displays a large symmetrical triangle pattern—a classic consolidation setup, Simple .
- Disclaimer: Trading involves significant risk and is not suitable for all investors. Past performance does not guarantee future results. Always conduct your own research, consider seeking advice from a qualified financial advisor, and trade only with capital you can afford to lose.
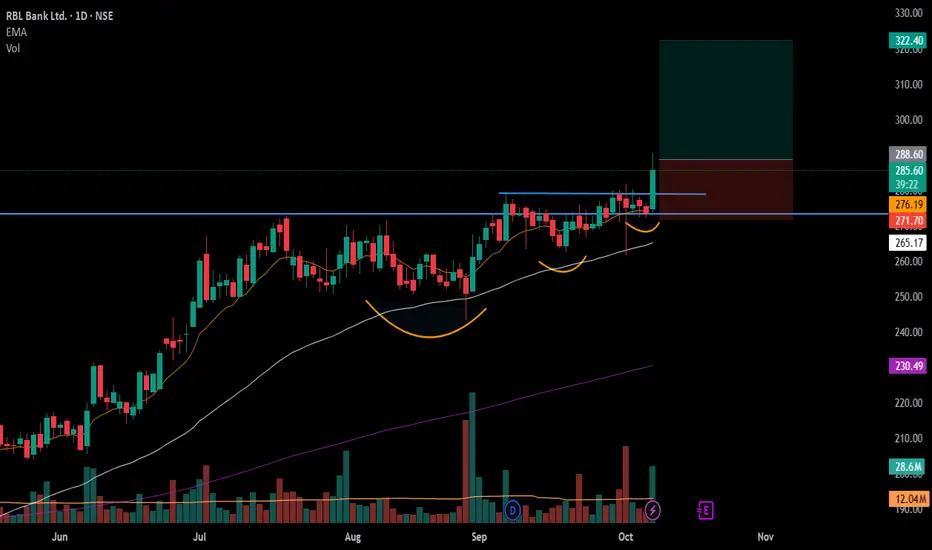
#RBLBANK - VCP BreakOut in Daily Time FrameScript: RBLBANK
Key highlights: 💡⚡
📈 VCP BreakOut in Daily Time Frame
📈 Volume spike during Breakout
📈 Large Base BreakOut – Zoom Out
📈 Private Bank Sector showing strength
📈 Can go for a swing trade
BUY ONLY ABOVE 288 DCB
⏱️ C.M.P 📑💰- 286.90
🟢 Target 🎯🏆 – 12%
⚠️ Stoploss ☠️🚫 – 6%
⚠️ Important: Market conditions are Bad, Position size 25% per Trade. Protect Capital Always
⚠️ Important: Always Exit the trade before any Event.
⚠️ Important: Always maintain your Risk:Reward Ratio as 1:2, with this RR, you only need a 33% win rate to Breakeven.
✅Like and follow to never miss a new idea!✅
Disclaimer: I am not SEBI Registered Advisor. My posts are purely for training and educational purposes.
Eat🍜 Sleep😴 TradingView📈 Repeat 🔁
Happy learning with MMT. Cheers!🥂
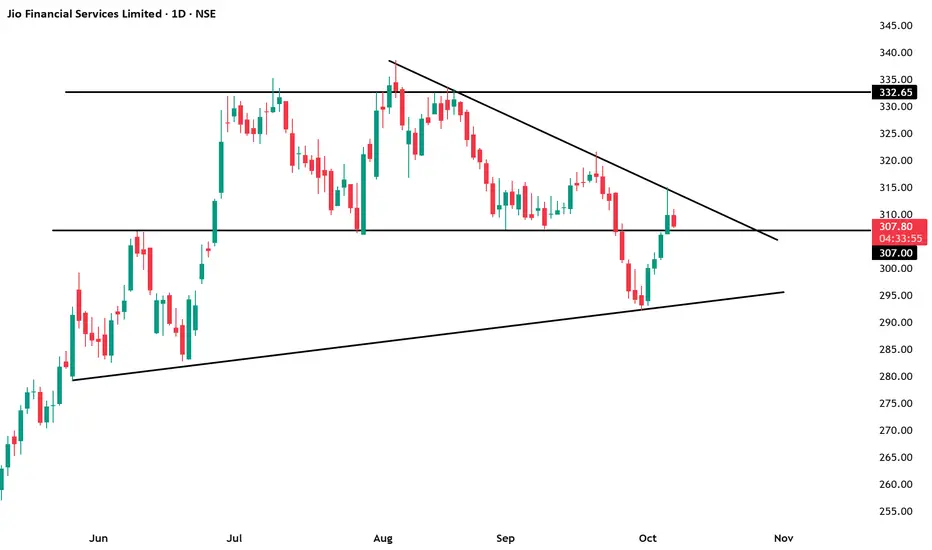
JIOFin Good to keep on RadarNSE:JIOFIN
JioFin has been Consolidating for long time; it's good to keep on radar as we are expecting BO soon
⚠️ Disclaimer:
This analysis is for educational and informational purposes only.
We are not SEBI-registered analysts or advisors.
This is our personal view based on available data and market trends.
Please consult your SEBI-registered investment advisor before making any investment or trading decisions.
You are solely responsible for any financial decisions you make based on this content.
========================
Trade Secrets By Pratik
========================
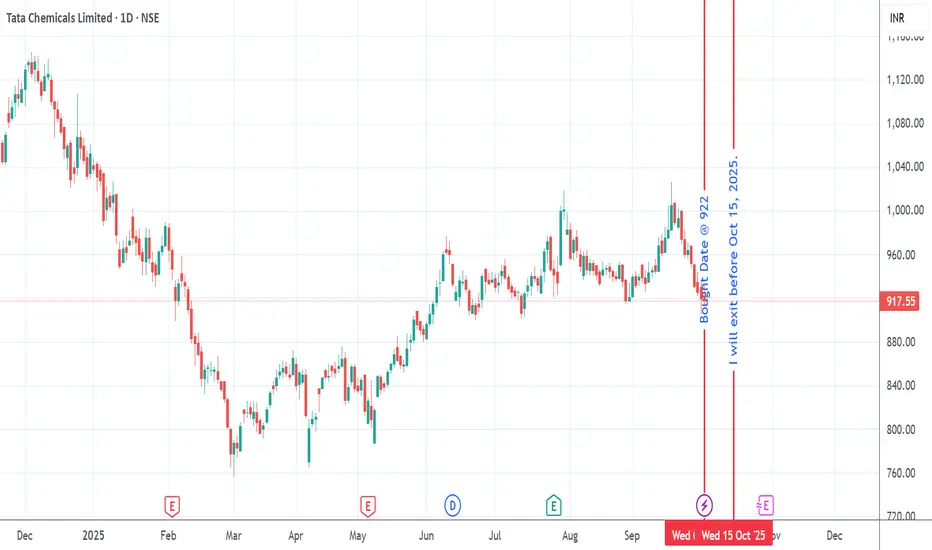
Demand Zone - TATACHEM | Swing Trading | Time Based Trading |🛒 Trade Snapshot: TATACHEM
Buy Date: 01-Oct-2025
Quantity: 922 shares
Entry Reason: Demand zone
Chart Context: Price reacted near historical support
Setup Type: Swing entry with zone validation
Confirmation: Volume support and price structure alignment
Exit Plan : I will exit this stock before Oct 15, 2025.
#TimeBasedTrading
#SwingTrading
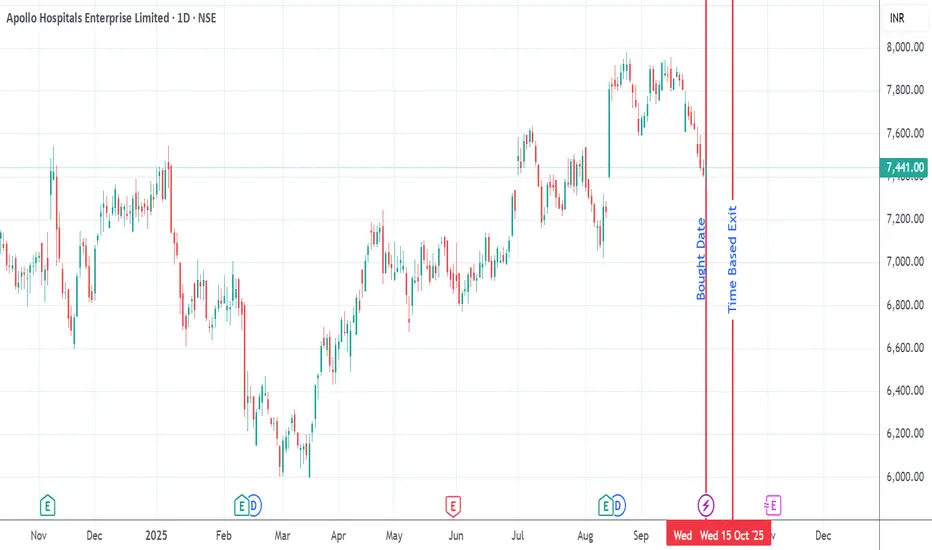
Demand Zone APOLLOHOSP | Swing Trading | Time Based Exit 🛒 Trade Snapshot: APOLLOHOSP
- Bought Date: 01-Oct-2025
- Quantity: 7 shares
- Buy Price: ₹7409.50
- Entry Reason: Demand zone validation
- Setup Type: Precision entry near institutional support
- Chart Context: Price held firm at a key demand area
- Confirmation: Tight spread and zone reaction
- Next Watch Level: Breakout above recent consolidation
Exit : I will exit this trade anytime before 14 days.
#TimeBasedTrading
#SwingTrading
PETRONET LONGAfter making a base and consolidating Petronet has given a breakout. One can look for entry here or at dips around 285 286 levels.
SL- 280
Target- 295, 300.
Disclaimer This is just for educational purpose.
Jai Shree ram.

Maruti SuzukiMaruti might touch around 16,250 tomorrow but beyond that a breakout is not expected much, as there has been a drop in the volume.

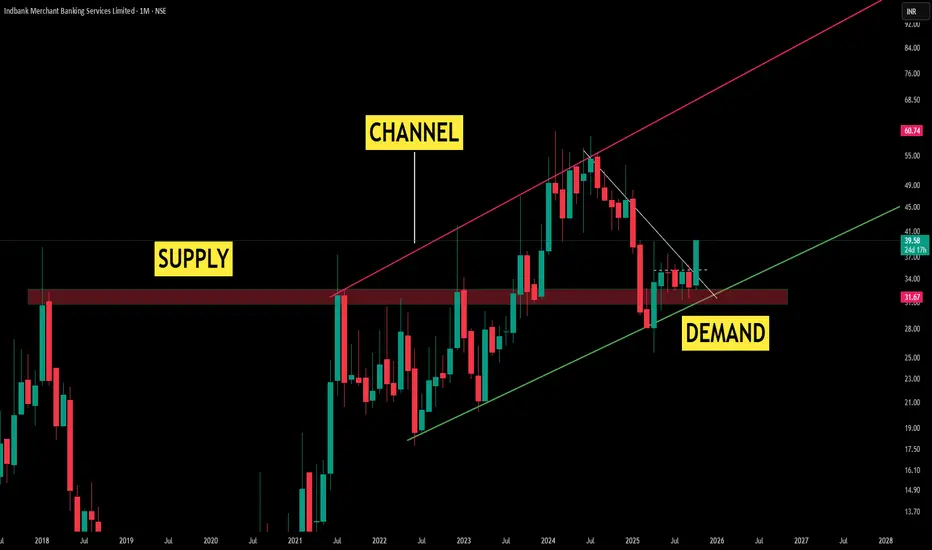
Monthly Market Regime: Supply-to-Demand Shift Framed by ParallelTheme 1: Regime Shift
A prior supply pocket has matured into a demand base as monthly closes repeatedly sustained above the zone
Theme 2: Channel Governance
A clean, supportive parallel channel has developed; price has been guided by its rails, offering objective context for expansion and contraction phases on the higher timeframe
Theme 3: Higher Highs, Higher Lows
Successive higher highs align with the channel’s upper boundary acting as dynamic headwinds, while higher lows respect the supportive green line, preserving trend health.
Theme 4: Counter Trendline (CT)
The white CT outlines the corrective path within the advance, visually separating pullback structure from primary momentum
Disclaimer: Technical analysis provides probability-based insights. Always implement proper risk management and consider multiple timeframe confirmations before executing trades.
Aster DM looking good for upsideAster DM looking good for upside targets are favourable for rr greater than 1 : 3
Fibonacci Tool: Why It’s NOT a Trading StrategyMost traders wrongly treat Fibonacci as a standalone strategy—it’s just a support tool, not a secret pattern for auto profits. Discover how real pros use it for bias, not blind buys, and avoid the retail trap

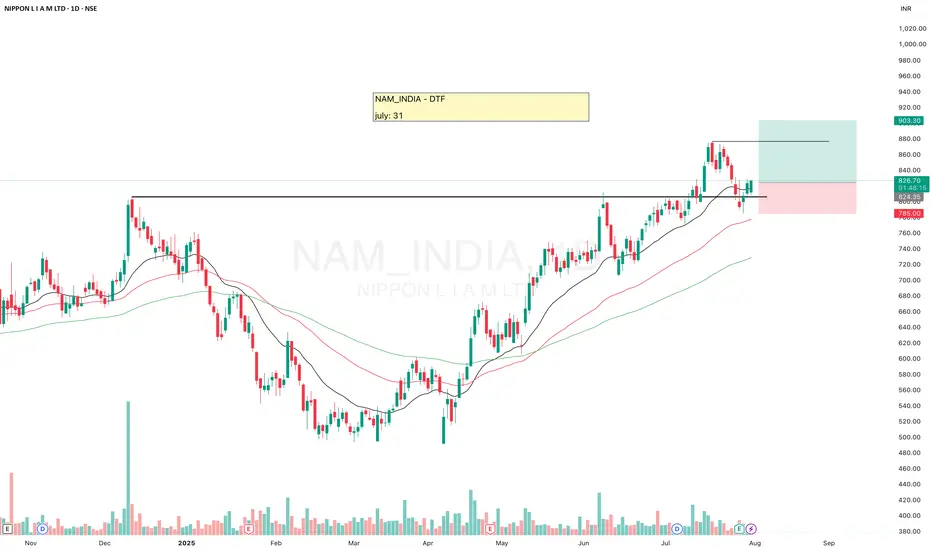
NAM_INDIA (NIPPON L I A M LTD)NAM_INDIA looks good.
It has re-tested the resistance, and seems to be ready for another upside move.
Must use the SL.
✅ If you like my analysis, please follow me here as a token of appreciation :)
in.tradingview.com/u/SatpalS/
📌 For learning and educational purposes only, not a recommendation. Please consult your financial advisor before investing.
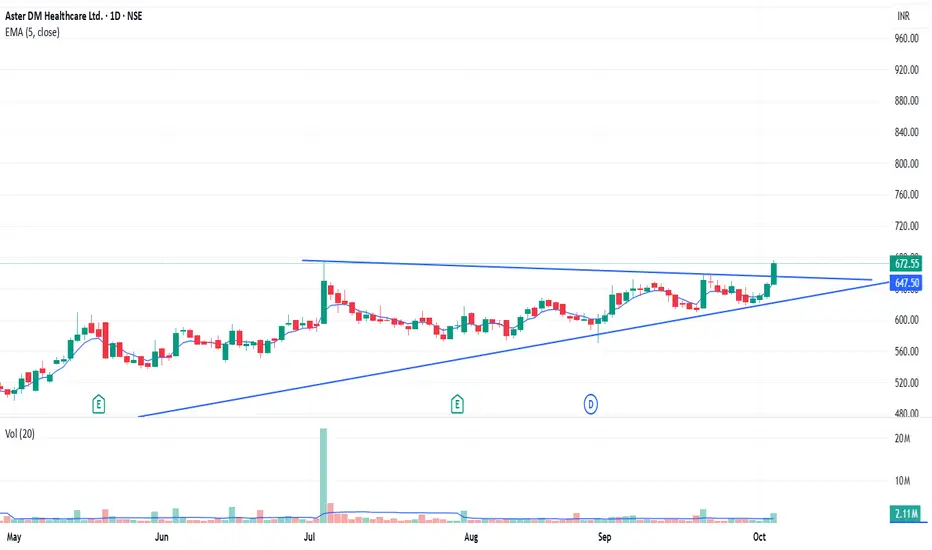
ASTER DM (Aster DM Healthcare)ASTER DM looks strong.
It faced resistance near 604–610, broke out on 3rd July, and then re-tested that level.
The stock is trading above all key EMAs (20, 50, 100, 200) and has been in a long-term uptrend for nearly 5 months.
With recent strong results, there’s a probability of an upside move. Keep it on your watchlist.
✅ If you like my analysis, please follow me as a token of appreciation :)
in.tradingview.com/u/SatpalS/
📌 For learning and educational purposes only, not a recommendation. Please consult your financial advisor before investing.

Buy TIINDIA | Swing Trading | Sep 1, 2025 Intraday Candle Spike🛒 Trade Snapshot: TIINDIA
- Buy Date: 30-Sep-2025
- Buy Price: ₹3125.00
- Quantity: 7
-Setup Reference: Sep 1, 2025 intraday candle spike
- Chart Context: Intraday spike from Aug 04 acted as hidden demand
- Confirmation: Price held above spike origin with strength
⏳ Exit Plan: Time-Based Strategy
- Exit Window: Within 14 calendar days from entry
- Exit Logic: Time-based, not price-based
- Core Belief: Time is the primary driver of my setups
- Why Time Matters:
- Price may fluctuate, but lifecycle setups mature within a defined time
- Avoids emotional bias tied to targets or stop-losses
- Keeps discipline intact across all trades
- Execution Rule: Trade will be closed regardless of price action once the time threshold is hit
🔍 Real Trades 💸 Real Capital 📘 Fully Journaled
Every setup shared here is executed live with my own funds—no simulations, no hindsight.
#TimeBasedTrading
#SwingTrading

Full Replay Breakdown! From Planning to Execution of a TradeWatch as I use the Bar Replay feature to walk you through the planning, execution, and post-trade phases of a real swing trade. Don’t miss these actionable insights, mindsets, and mistakes from start to finish for smarter trading decisions!
Chart used is older than 3 months for explanation

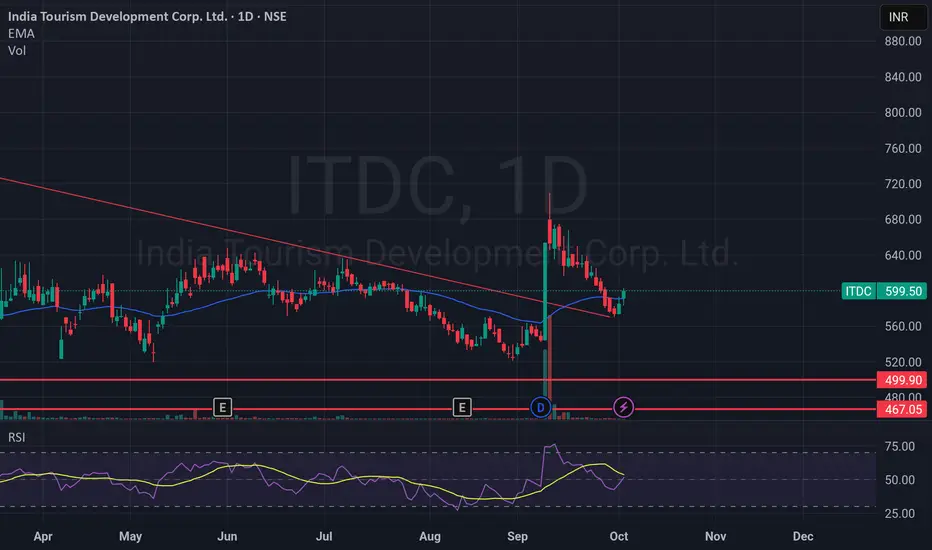
ITDC: Bullish Breakout Attempt After Strong UptrendChart & Instrument:** India Tourism Development Corp. Ltd. (ITDC) - NSE, 1D Timeframe
Analysis :
ITDC is exhibiting strength as it tests a key resistance level, poised for a potential continuation of its primary uptrend. Here's a breakdown of the technical picture:
Established Uptrend : The stock has been in a sustained uptrend since April 2025, rallying from a low of ₹467 to current levels near ₹600.
Bullish Momentum: price has closed at ₹599.50, comfortably above the key Exponential Moving Average (EMA) of ₹591.13, confirming near-term bullish momentum.
Neutral RSI: The RSI reading of ~53 is in neutral territory, indicating there is plenty of room for the stock to run before becoming overbought.
Key Resistance: The immediate and critical hurdle is the recent high of ₹603. A decisive break and close above this level are crucial for the next leg up.
Trade Idea & Prediction:
We anticipate a bullish breakout above the ₹603 resistance
Trigger: A confident break and daily close above ₹603.
Profit Target 1: ₹640 (Initial target based on previous swing highs).
Profit Target 2: ₹. 680 (Extended target, aligning with the upper boundary of the trend channel).
Stop Loss: ₹580 (A break below this key support level would invalidate the bullish setup and signal a short-term pullback).
Disclaimer :This is not financial advice. Always conduct your own research (DYOR) and manage your risk appropriately.
#ITDC #NSE #StockMarket #Trading #TechnicalAnalysis #Breakout #Investing
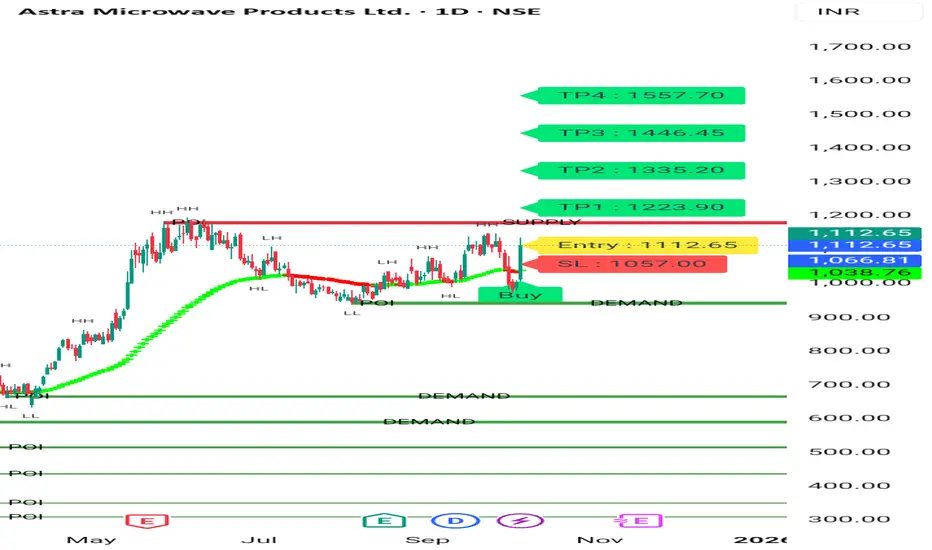
Astral micro System Bullish Astra micro wave given good sign for upmove after Goldman sachs upgrade. It's moving good.
We can get 5 -10% Easily from here in swing trading. 30 -40% in long run. Good stock.
Consult your financial advisor before making any position in stock market. For more information Visit my Tradingview Profile.
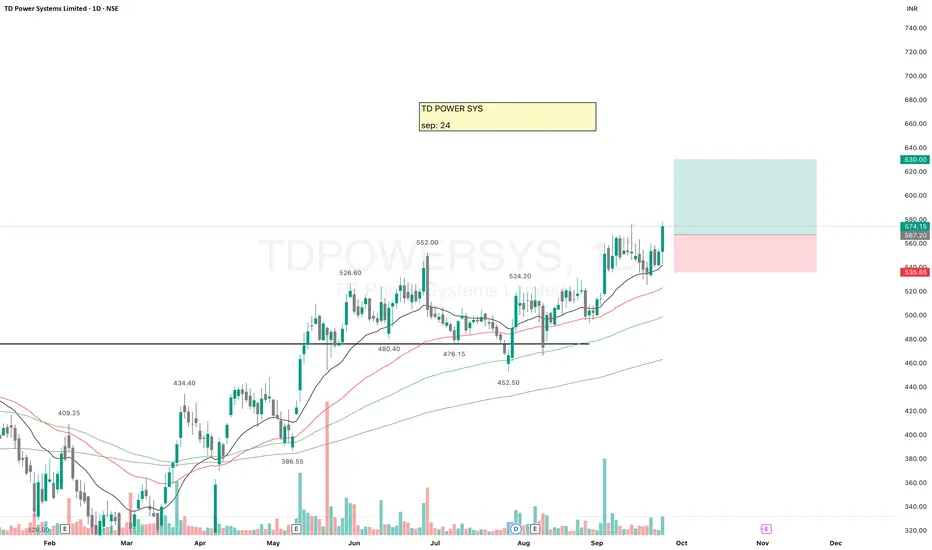
TDPOWERSYS (TD Power System)The stock is trading above all key EMAs, showing strong momentum.
After facing resistance near ₹475, it broke out in May, then briefly retested the ₹475–₹460 zone, which has now turned into solid support.
Now there is probability of another upside move.
✅ If you like my analysis, please follow me as a token of appreciation :)
in.tradingview.com/u/SatpalS/
📌 For learning and educational purposes only, not a recommendation. Please consult your financial advisor before investing.