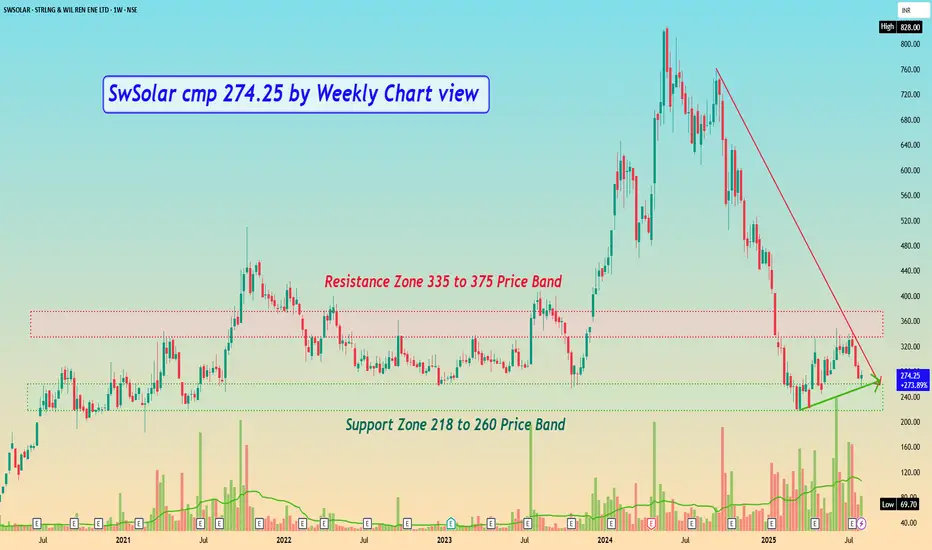
SwSolar cmp 274.25 by Weekly Chart viewSwSolar cmp 274.25 by Weekly Chart view
- Support Zone 218 to 260 Price Band
- Resistance Zone 335 to 375 Price Band
- Stock Price currently around Old Times Strong Support Zone
- Price reversal probability by past chart data seen basis Support Zone is sustained
- Price will need good incremental Volumes to breakout from fairly strong Resistance Zone
SWSOLAR
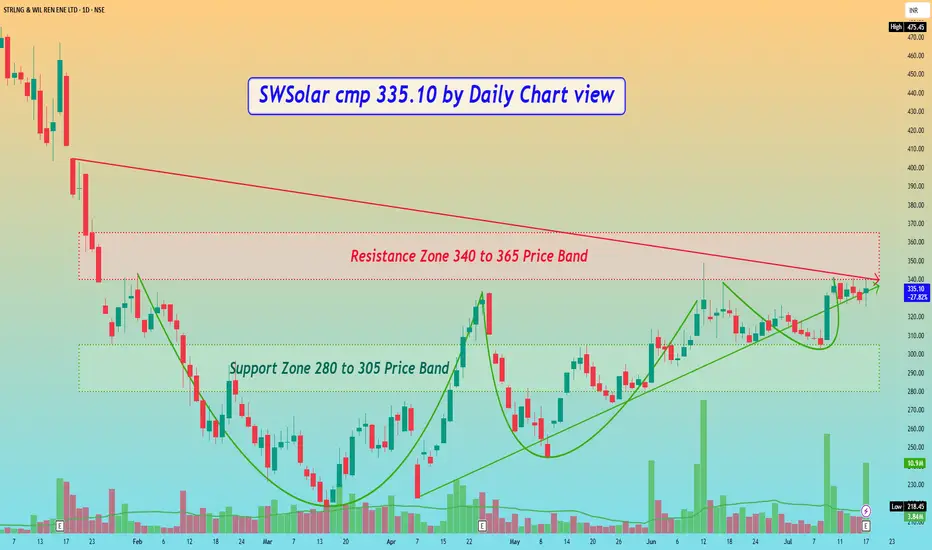
SWSolar Sterling & Wilson cmp 335.10 by Daily Chart viewSWSolar cmp 335.10 by Daily Chart view
- Support Zone 280 to 305 Price Band
- Resistance Zone 340 to 365 Price Band
- Bullish VCP Pattern completed on stock chart
- Volumes spiking heavily at regular intervals by demand based buying
- Resistance Zone Neckline Breakout maybe seen unfolding in the near future
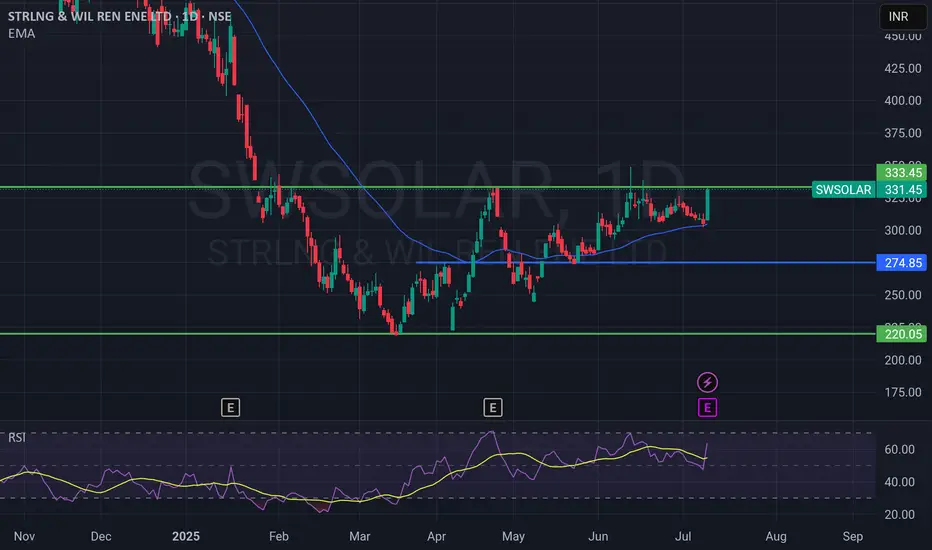
SWSOLAR Breaks Out of Key ResistanceSWSOLAR has given a strong breakout above ₹330 resistance zone with volume support and 8.5% upmove!
Here’s what’s notable:
📈 Breakout above ₹333.45 – a major resistance level.
📊 EMA Support – Price trading above the 50 EMA (~₹304).
💪 RSI at 63.77 – Showing strong bullish momentum but not overbought yet.
🔄 Previous consolidation range was between ₹275 – ₹330.
What to watch next:
Immediate resistance near ₹345–₹360 (if momentum continues).
Support now at breakout zone ~₹330 and strong base at ₹274.
RSI nearing 70 – could see some consolidation before next leg.
📍Possible trade idea:
Long on retest of ₹330 zone with SL below ₹304 EMA.
Target ₹360+ short-term, ₹400 medium-term if strength continues.
📝 What do you think? Is this the start of a fresh uptrend or a fake breakout?
---
🏷️ Tags:
#SWSOLAR #BreakoutStocks #NSEIndia #TechnicalAnalysis #SwingTrading #EMA50 #RSI #CleanEnergyStocks
SWSolar cmp 467.60 by Weekly Chart viewSWSolar cmp 467.60 by Weekly Chart view
- Price Band 414 to 441 Support Zone
- Price respecting Rising Support Trendline
- 2+ year's long timeframe Bullish Rounding Bottom
- Volumes seem steady but yet below avg traded quantity
- Weekly Support at 377 > 285 > 190 with Resistance at 541 > 638 > 732
- Stock Price seems testing retesting the Support Zone currently for probable upside movement

SWSOLAR - Start of Up-Leg in a triangle consolidation.NSE:SWSOLAR
Company Info:
Sterling & Wilson Renewable Energy Ltd. provides solar engineering, procurement and construction (EPC) solutions. The firm provides EPC services primarily for utility-scale solar power projects with a focus on project design and engineering and manage all aspects of project execution from conceptualizing to commissioning.
Technical Chart:
Day chart analysis. 🧐
🔹Trend: The stock is in a major up trend but recently it went into a triangle consolidation.
🔹Swing: It is recently forming a bear leg towards the support trendline with a very slow pace and low volume showing weakness in sellers and just a correction in the major trend.
👉the current price also has clusters of EMA.
🔹View: Breakout of the recent range from support area.
🟢Entry: Above 715+ On breakout some qty and remaining on confirmation of close of day candle.
♦️Risk:- 650 should be the level for the stop as it is below all major support clusters, including the price filter of day candle closing basis only.
🎯Target:- Levels mentioned on chart.
Detailed analysis on chart Study it and mark levels on your chart
Keep Learning,
Happy trading.

Sterling & Wilson Renewable Energy - Breakout Setup, Move is ON.#SWSOLAR trading above Resistance of 753
Next Resistance is at 1176
Support is at 492
Here are previous charts:
Chart is self explanatory. Levels of breakout, possible up-moves (where stock may find resistances) and support (close below which, setup will be invalidated) are clearly defined.
Disclaimer: This is for demonstration and educational purpose only. This is not buying or selling recommendations. I am not SEBI registered. Please consult your financial advisor before taking any trade.

Sterling Wilson Solar finally catching upNSE:SWSOLAR is finally catching up with its solar industry peers. A stop loss at 540 should hold well for this counter. Go long. I am very bullish on the solar theme and other shares in this industry have continued to outperform the market.

Potential Breakout Alert: SWSolar (Sterling and Wilson So LTD)🚀 Breakout Potential: SWSolar (Sterling and Wilson So LTD) 🚀
Technical Analysis: SWSolar appears to be on the brink of a significant breakout, with its current price action indicating strong momentum. The stock has been consolidating above the key resistance level of 560 for some time now, suggesting a potential bullish continuation pattern.
Key Levels to Watch:
Resistance: 560
Target: 650+
Why It Matters:
A sustained breakout above the 560 level could signal a bullish trend reversal for SWSolar.
The consolidation pattern suggests that buyers are accumulating shares, indicating potential upward pressure on the stock.
Volume analysis supports the breakout thesis, with increasing buying interest accompanying the recent price action.
Trade Idea:
Entry: Consider entering long positions if SWSolar sustains above 560.
Stop-Loss: Set a stop-loss below the breakout level to manage risk.
Target: Initial target at 650, with further upside potential as the breakout gains traction.
Risk Warning:
Trading involves risk, and it's essential to have a well-defined risk management strategy in place. Always consider your risk tolerance and adjust position sizes accordingly.
Disclaimer: This analysis is for educational purposes only and should not be construed as financial advice. Make sure to conduct your own research or consult with a qualified financial advisor before making any investment decisions.
Conclusion:
With the potential breakout above 560, SWSolar (Sterling and Wilson So LTD) could be setting up for a significant upward move. Traders should closely monitor price action and volume dynamics for confirmation of the breakout. A sustained move above 560 could open the door for a rally towards the 650+ levels and beyond.

Breakout in Sterling & Wilson Renewable Energy Ltd...Chart is self explanatory. Levels of breakout, possible up-moves (where stock may find resistances) and support (close below which, setup will be invalidated) are clearly defined.
Disclaimer: This is for demonstration and educational purpose only. This is not buying or selling recommendations. I am not SEBI registered. Please consult your financial advisor before taking any trade.

SWSOLAR - SWING TRADE - 11th January #stocksSWSOLAR (1D TF)
Swing Trade Analysis given on 11th Jan, 2024
Pattern: ASCENDING TRIANGLE
- Volume Buildup at Resistance - Done ✓
- Shakeout to Lower Trendline & Pullback - Done ✓
- Breakout of Resistance - In Progress
#stocks #swingtrade #chartanalysis #priceaction #traderyte #swsolar

SWSOLAR - LONG ENTRY -BREAKOUT STOCKSWSOLAR LOOKING VERY GOOF FOR SWING ABOVE 410
above MA
Increase in Volume
ADX,BB,Donchain Bullish
Weak below 380

Sterling and Wilson LongBuy Reasons:
1. RSI>50
2. MACD crossover
3. Channel Breakout
4. Above Fibonacci support level.
Buy only on the levels specified on the chart and maintain a strict SL


SWSOLAR - Ichimoku Bullish Breakout Stock Name - SWSOLAR
Ichimoku Cloud Setup :
1). Today's close is above the Conversion Line
2). Future Kumo is Turning Bullish
3). Chikou span is slanting upwards
All these parameters are showing bullishness at Current Market Price
and more bullishness AFTER crossing 327
#This is not Buy and Sell recommendation to any one. This is for education purpose and a helping hand to learn trading in Market.
# Cloud Trading
# Ichimoku Cloud
# Ichimoku Followers
I hope you all like my analysis.
Please do share your thoughts into comment section.
Please give a like, it motivates me to do analysis.

SWSSOLAR is nearing triangle breakoutNSE:SWSOLAR is in triangle consolidation
Entry : Conservative traders, wait for breakout with volume above average and then take position. For small SL, enter on bounce of the triangle's support line
Exit : When the setup is invalidated by false breakout, or strong close below the triangle's support line
Target : T1 400, T2 500 on strong breakout, giving around 30% or 60% returns from current price of 302.85.
Reducing revenue, income, asset, etc. for past 3 years is a concern. So this is not recommended for long term holding, but may be suitable for breakout gains.
Key note : Always follow proper risk management to avoid losing capital from false breakouts as this is common.
Caution : This is a knowledge sharing analysis, not a call.


Long Term Idea on SWSOLARNSE:SWSOLAR is aiming 90-100% Upside from today's levels.
The long term S&R, Targets and retracements mentioned in the chart.

SWSOLAR Cup & HandleNSE:SWSOLAR
#NSE:SWSOLAR formed beautiful cup and Handle pattern.
Good above 378.
Happy LEarning !!

IS THE CORRECTION IN SWSOLAR OVER ??TRADE OR INVEST wisely.
WE CAN JUST PREDICT.
Disclaimer: I am not a SEBI registered advisor , so before entering on my view plz ask your SEBI Registered Advisor . Profit is your and loss is your.
PLEASE LIKE AND SHARE IF YOU AGREE WITH THE IDEA


SwsolarSterling and Wilson solar has consolidated and showing it's journey with an upmove, lont term view very positive .


SW Solar Previous trend line resistance acting as supportClear support seen at previous Resistance trend line and conjunction of 21 day moving average acting as support as same level
Can go long around CMP of 434.45 with SL @ 385 (Weekly closing basis)
Do your own analysis before investing.
