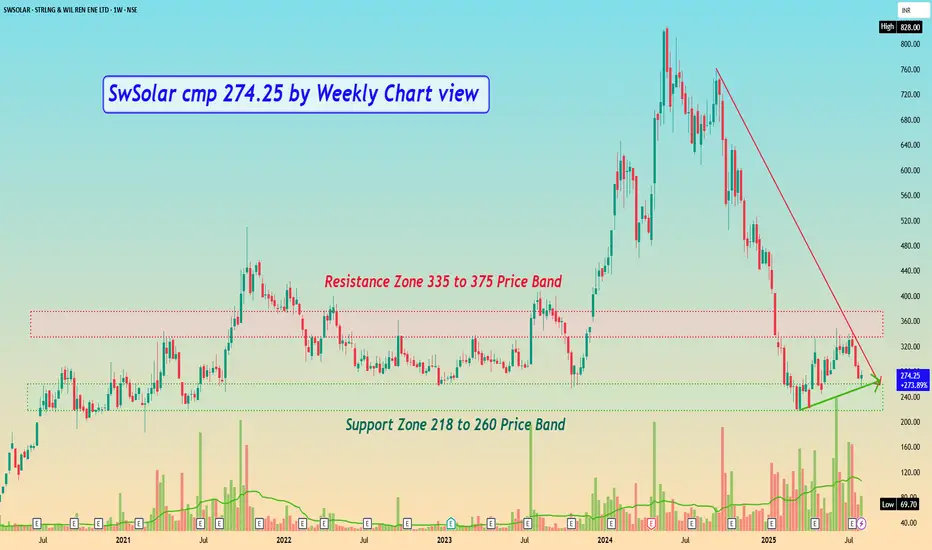
SwSolar cmp 274.25 by Weekly Chart viewSwSolar cmp 274.25 by Weekly Chart view
- Support Zone 218 to 260 Price Band
- Resistance Zone 335 to 375 Price Band
- Stock Price currently around Old Times Strong Support Zone
- Price reversal probability by past chart data seen basis Support Zone is sustained
- Price will need good incremental Volumes to breakout from fairly strong Resistance Zone
Swsolartechnicalanalysis
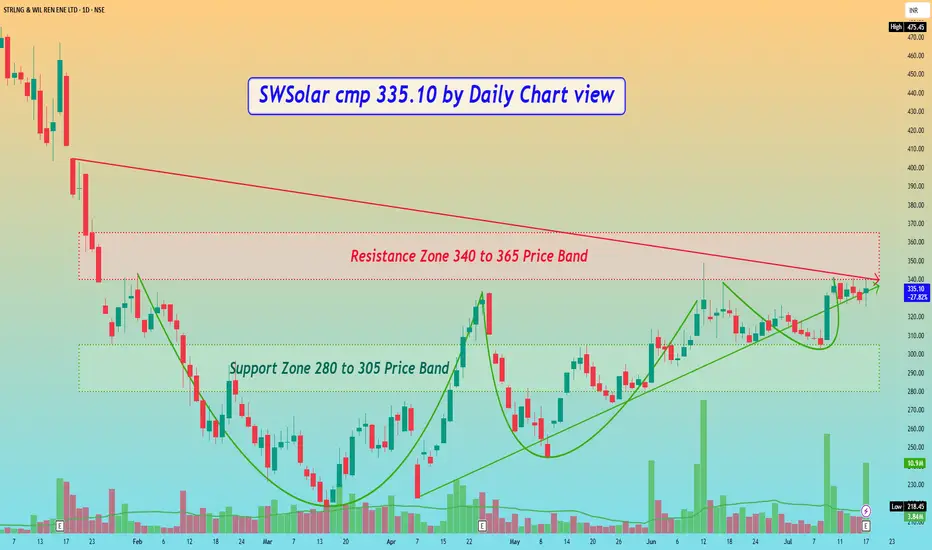
SWSolar Sterling & Wilson cmp 335.10 by Daily Chart viewSWSolar cmp 335.10 by Daily Chart view
- Support Zone 280 to 305 Price Band
- Resistance Zone 340 to 365 Price Band
- Bullish VCP Pattern completed on stock chart
- Volumes spiking heavily at regular intervals by demand based buying
- Resistance Zone Neckline Breakout maybe seen unfolding in the near future
SWSolar cmp 467.60 by Weekly Chart viewSWSolar cmp 467.60 by Weekly Chart view
- Price Band 414 to 441 Support Zone
- Price respecting Rising Support Trendline
- 2+ year's long timeframe Bullish Rounding Bottom
- Volumes seem steady but yet below avg traded quantity
- Weekly Support at 377 > 285 > 190 with Resistance at 541 > 638 > 732
- Stock Price seems testing retesting the Support Zone currently for probable upside movement
