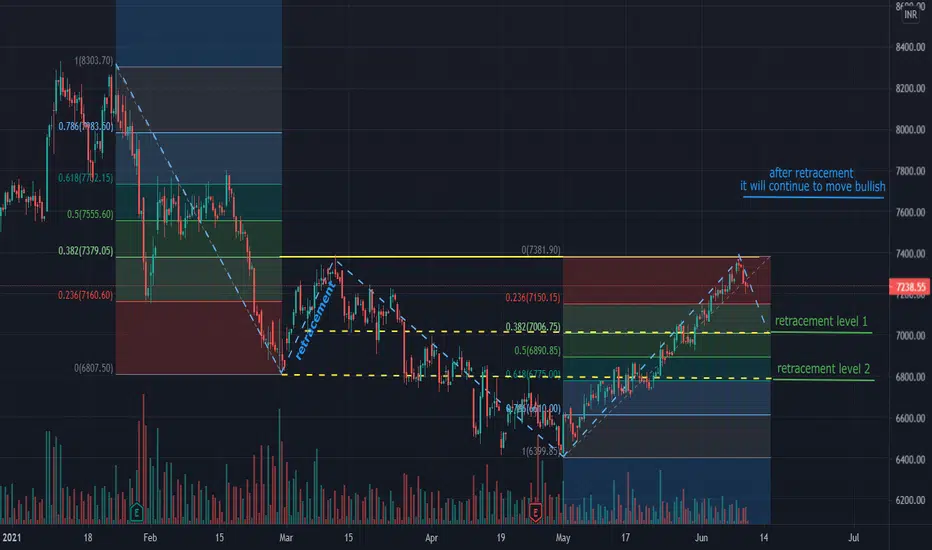
MARUTI retracement in bullish moveFibonacci is one of the important tool to predict and understand the retracement of the stock.
MARUTI SUZUKI was in down trend since mid of Feb started retracement on 26th of Feb around 8610 and retraced by 38.2% till 7372, which is also a price at the current date. after this retracement it continued the down trend.
A trend reversal is observed on 30th of April and stock moved bullish since then. Now, it has reached to the high of the symmetric level from past retracement (7372). It expected to retrace atleast by 38.2% or to max to the level of 61.8%.
pls keep an eye on it and pls comment your observations too.
Symmetrical
#Amber keep on watch, may take support.#Amber keep on watch, may take support.
Avg Volume increasing. ACCUMULATION GOING ON.
Symmetrical Triangle.
Lets See.

HDFC - Symmetric Triangle FormationSymmetric Triangle formed here can lead stock for an Up move to the 2617 as we can see Resistance line.
So If triangle breakout successfully we can get our first target for short term (1-2 weeks) at Price level 2617.
Next target can be 2765 & 2896 (For long term)
If pattern breaks down, stock can take support near 2364

INDUSTOWER symmetrical triangle The stock has been consolidating for more than a month (formation of the symmetrical triangle) wait for the breakout and take trade according to that
Note: Please consult your financial advisor,
Investment/Trading in the securities market is subject to market risk, We are not responsible for your profit or loss


SYMMETRIC TRIANGLE, SWING TRADE, INOXAll the multiplex theaters are consolidating for longtime. some places have already opened theaters with strict covid rules. I guess any proper vaccine news can move them up and giving a breakout.
Inox formed a symmetric triangle, which when breaks the resistance along with volume activity may be the indication of Long entry.
stop loss may be placed according to personal risk management.
NB: This is not a stock recommendation, just sharing my views only.


SBI CARDS This Analysis Is Done Only For Educational & Intelligence Purpose, Invest Or Trade At your Own Risk & Will.

Equitas holdingEquitas holding:--
Symmetrical Patterns breakout successfully done
buy around 55-56 and target upto 80rs with sl of 41-40 on clbs


BTC Symmetrical Triangle can Breakout or Breakdown ?BTC Symmetrical Triangle can Breakout or Breakdown ? It will move in either direction , but smart margin trader will earn very handsome income in either case. So this is my advise to take advance orders according to levels as per my opinion. This is not financial advise, profit and loss is yours.

CESC on radar for Short, Wait for breakout confirmation!Expecting downside breakout in CESC , Symmetrical triangle formed.
Short Below 680 with stop loss of 700
Target 1- 667
Target 2- 645
Target 3- 620+
Entering long in CESC if moves above 710 for target of 735 & 760+
*Recommended for positional trade!

Triangle Breakout - DishTVHello Traders,
Price has broken out from a symmetrical triangle on DishTV weekly chart. We should see price making a bullish move in coming days.
Target: 140
Stoploss: 90
Happy Trading!!!

Symmetrical Triangle breakout MRFBeautiful Symmetrical Triangle breakout offers an opportunity to buy the stock at current level.

