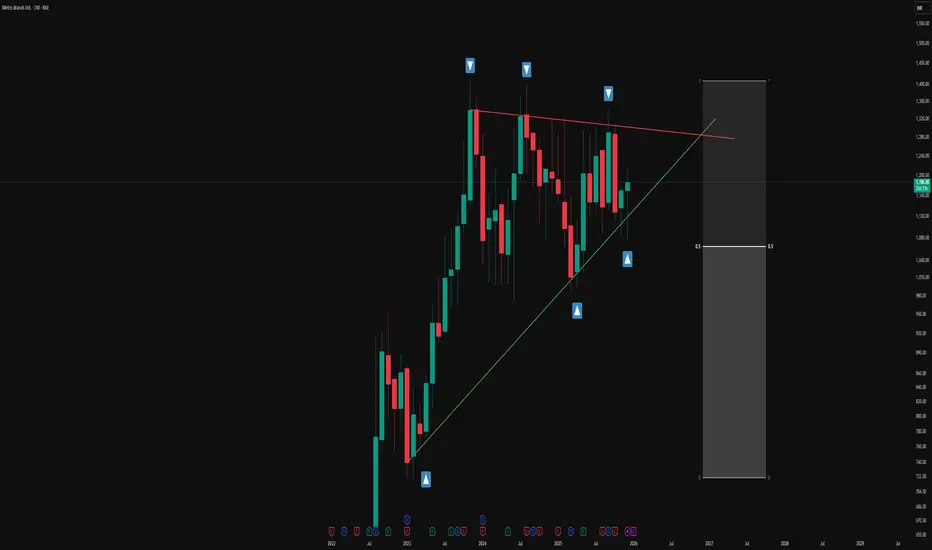
Symmetrical Triangle Masterpiece : Multi-Layout W,DtfStep into this dynamic multi-layout window opened right in front of you—a split-screen showcase of pure price action artistry.
Left Side: Weekly Timeframe
Here, a symmetrical triangle (a classic continuation or reversal pattern formed by two converging trendlines of equal slope) takes center stage. Framing it are a green uptrend line (connecting higher lows for bullish structure) and a red downtrend line (linking lower highs for bearish pressure), creating a tightening coil of market indecision. A subtle white counter-trend line (acting as dynamic support/resistance opposing the main trend) adds layers of geometric elegance, hinting at its heightened significance when viewed on lower timeframes.
Right Side: Daily Timeframe
Flipping to the daily chart reveals how this white line shines as a pivotal counter-trend barrier, interacting seamlessly with intraday swings. Multi-timeframe analysis (comparing higher timeframe structure with lower timeframe details for confluence) illustrates the fractal beauty......how weekly patterns cascade perfectly into daily price action without a single forecast or bias.
This is markets at their most poetic: old-school chart patterns and trendlines weaving symmetry across scales. No predictions, just appreciation for the elegance.
Disclaimer: This post is for educational and illustrative purposes only, highlighting historical price action and chart patterns. It does not constitute financial advice, trading recommendations, or predictions of future market movement. Always conduct your own research and consult a professional advisor
Symmetrical Triangle

BEL Triangle & Flag BreakoutBEL is attempting breakout from Triangle and Bull Flag Pattern on 1D timeframe. Watch for closing at End of the Day. Watch for Earnings because this stock carries earnings risk.

Triangle Contraction Symphony: Hidden Supports, Inverted H&SWitness the mesmerizing dance of price action in this chart masterpiece. A pristine triangle contraction pattern emerges, bounded by a supportive yellow trendline below and a red counter-trendline above, perfectly channeling price within tightening bounds.
Layered hidden dotted support/resistance lines add depth, illustrating how price meticulously respects each level—time and again.
Culminating in a textbook inverted head and shoulders formation, this setup showcases contraction elegance at its finest.
Purely educational: Reliving how these levels held in the past. No directional bias here—just the raw beauty of price action precision.
Disclaimer: This post is for educational purposes only, demonstrating historical price action behavior and level interactions. No directional bias or trading recommendations are implied. Past performance is not indicative of future results. Trade at your own risk.

NH - STWP Equity Snapshot________________________________________
📊 STWP Equity Snapshot – NH
(Educational | Chart-Based Interpretation)
________________________________________
📌 Intraday Reference Levels (Structure-based)
Reference Price Zone: 1950
Risk Reference (If price weakens): 1829
Observed Upside Zones: 2095 → 2192
These zones highlight where intraday price reaction, pause, or expansion may occur based on recent structure.
________________________________________
📌 Swing Reference Levels
(Hybrid Model | 2–5 days | Observational)
Reference Price Zone: 1950
Risk Reference (If structure breaks): 1779
Higher Range Zones (If strength sustains): 2292 → 2549
Swing levels reflect broader price acceptance and risk boundaries rather than short-term noise.
________________________________________
🔑 Key Levels – Daily Timeframe
Support Areas: 1896 | 1846 | 1819
Resistance Areas: 1973 | 2000 | 2050
These levels explain where price has historically reacted and where it may slow down, reject, or accelerate further.
________________________________________
🔺 STWP Chart Pattern Analysis
Stock: NH
Pattern: Symmetrical Triangle
Stage: Late formation (Mature)
________________________________________
⏱ Structure Timing Insight
Duration: Around 51 days
Maturity: Overextended
The longer a pattern compresses, the more cautious one needs to be about false breakouts.
________________________________________
📌 Why price is behaving this way
Price has been compressing between lower highs and higher lows
Buyers and sellers are both active, but neither side has clear control
Prolonged compression often reflects indecision rather than fresh accumulation
This explains the repeated pullbacks and recoveries near the same zones.
________________________________________
📐 Projection Logic (Educational)
Upside projection is calculated using the full height of the triangle
Downside projection remains equally valid due to neutral structure
Mature patterns tend to produce whipsaws before clean resolution
Patience becomes more important than prediction in such structures.
________________________________________
🎯 Pattern Targets & Invalidation
Upside Projection: 2103
Downside Projection: 1653
Pattern Validity Conditions:
Structure remains constructive only if price holds above 1959
Breakdown risk increases below 1797
________________________________________
🔍 STWP Market Read
NH has shown strong recovery momentum, supported by healthy indicators and active participation.
However, due to the late-stage triangle, strength must be confirmed through acceptance, not just temporary spikes.
This is a structure where discipline matters more than aggression.
________________________________________
📊 Chart Structure & Indicator Summary
Structure: Mature symmetrical triangle
Trend: Up
Momentum: Strong but stabilising
RSI: ~57 – healthy, not overextended
Volume: High – active participation
________________________________________
📈 Final Outlook (Condition-Based)
Momentum: Strong
Trend: Up
Risk: High (due to mature compression)
Volume: High
________________________________________
💡 STWP Learning Note
Strong charts do not always mean immediate opportunity.
Markets reward those who wait for clarity and manage risk, not those who chase excitement.
________________________________________
⚠️ Disclaimer
This post is shared only for educational and informational purposes.
It is not investment advice or a recommendation.
Please consult a SEBI-registered financial advisor before making any trading or investment decision.
________________________________________
📘 STWP Approach
Observe price. Respect risk.
Let structure guide decisions — not emotions.
🚀 Stay Calm. Stay Clean. Trade With Patience.
________________________________________
💬 Did this snapshot help you read the chart better?
🔼 Boost to support structured learning
✍️ Share your views in comments
🔁 Forward to someone learning price action
👉 Follow for clean, beginner-friendly STWP insights
🚀 Stay Calm. Stay Clean. Trade With Patience.
Trade Smart | Learn Zones | Be Self-Reliant 📊

BSE - STWP Equity Snapshot________________________________________
STWP Equity Snapshot – BSE Ltd
(Educational | Chart-Based Interpretation)
📌 Intraday Reference Levels (Structure-based)
Reference Price Zone: 2,800
Risk Reference (If price weakens): 2,609
Observed Upside Zones: 3,028 → 3,181
________________________________________
📌 Swing Reference Levels (Hybrid Model | 2–5 days | Observational)
Reference Price Zone: 2,800
Risk Reference (If support breaks): 2,514
Higher Range Zones (If strength continues): 3,372 → 3,801
________________________________________
🔑 Key Levels – Daily Timeframe
Support Areas: 2,717 | 2,643 | 2,602
Resistance Areas: 2,832 | 2,873 | 2,947
These levels explain where price has previously reacted and where it may pause, reverse, or accelerate again.
________________________________________
🔺 STWP Chart Pattern Analysis
Stock: BSE Ltd
Pattern: Symmetrical Triangle
Stage: Late formation (Mature)
⏱ Structure Timing Insight
Duration: Around 203 days
Maturity: Overextended
The pattern has taken a long time to form, which lowers the quality of a quick breakout.
________________________________________
📌 Why price is behaving this way
Price has been moving between lower highs and higher lows
Buyers and sellers are both active, but neither side is in control
Long compression usually shows confusion, not strong fresh buying
This explains why price moves up, pauses, and then reacts again.
________________________________________
📐 Projection Logic (Educational)
Upside projection is based on the full height of the triangle
Downside projection is equally possible due to neutral structure
Mature patterns often give false moves, so patience is important
________________________________________
🎯 Pattern Targets & Invalidation
Upside Projection: 3,349
Downside Projection: 2,180
Pattern Invalidation: Clear move beyond the opposite boundary
________________________________________
🔍 STWP Market Read
BSE Ltd has shown strong upward movement after a long period of sideways action.
However, because the pattern is old and stretched, price must hold above support zones to keep strength intact.
Strength is visible — but confirmation matters more than excitement here.
________________________________________
📊 Chart Structure & Indicator Summary
Structure: Mature triangle, partial resolution
Trend: Up
Momentum: Strong but controlled
RSI: Around 58 – healthy
Volume: High – active participation
________________________________________
📈 Final Outlook (Condition-Based)
Momentum: Strong
Trend: Up
Risk: High (due to mature structure)
Volume: High
________________________________________
💡 STWP Learning Note
Not every strong move needs chasing.
The market rewards those who wait for clarity and manage risk, not those who rush.
________________________________________
⚠️ Disclaimer
This post is shared only for educational and informational purposes. It is not investment advice or a recommendation. Please consult a SEBI-registered financial advisor before making any trading or investment decision.
________________________________________
📘 STWP Approach
Observe price. Respect risk.
Let structure guide decisions — not emotions.
🚀 Stay Calm. Stay Clean. Trade With Patience.
💬 Did this snapshot help you read the chart better?
🔼 Boost to support structured learning
✍️ Share your views in comments
🔁 Forward to someone learning price action
👉 Follow for clean, beginner-friendly STWP insights
🚀 Stay Calm. Stay Clean. Trade With Patience.
Trade Smart | Learn Zones | Be Self-Reliant 📊
________________________________________

Kalyan Jewellers – Symmetrical Triangle Breakout (1-Day)Kalyan Jewellers is currently forming a symmetrical triangle pattern on the daily chart, indicating a period of consolidation as buyers and sellers balance out. A confirmed breakout above the upper trendline could signal the start of a new upward move, while a break below support may lead to further weakness.
At the current market price (CMP) around ₹500,
The key levels to watch are:
• Support: ₹446, ₹393
• Resistance: ₹530, ₹575
Company Overview
Kalyan Jewellers is one of India’s leading organized jewelry retailers, known for its extensive network of showrooms across the country and strong brand presence. The company operates in the high-growth consumer discretionary segment, benefiting from rising income levels, wedding demand, and festive purchases. Its fundamentals are supported by a diversified geographic footprint, consistent same-store sales growth, and a focus on customer trust and quality assurance.
A sustained breakout with higher-than-average volume could confirm trend direction and attract further buying interest.
For analysis of any stock, feel free to comment the stock name below.
This analysis is for educational and informational purposes only. It does not constitute investment advice or a recommendation to buy or sell any security. Market investments are subject to risk, and past performance does not guarantee future results. Please consult a SEBI-registered financial advisor before making any investment decisions. The author is not responsible for any losses or gains arising from the use of this information.

ITC symmetrical triangle breakout Price has broken down from a contracting structure.
Next major support sits near ₹358 (prior demand + structure support).
The recent wide-range candle + volume expansion suggests distribution, not a healthy pullback.
What to watch
A reaction near ₹358 is likely.
If price stabilizes with shrinking volume, a mean-reversion bounce is possible.
If selling pressure persists with volume, the trend shift confirms, and downside can extend.

KPI Green (D): Aggressive Bullish, Promoter-Backed MomentumTimeframe: Daily | Scale: Linear
The stock is staging a violent recovery from the bottom of a Symmetrical Triangle. While it has surged +26% in two days, it is currently testing the critical angular resistance . The move is backed by "Insider Buying," which gives it high structural conviction.
🚀 1. The Fundamental Catalyst (The "Why")
The volume explosion is driven by two major factors:
> Promoter Buying: Reports confirm that Quyosh Energia (Promoter Group) purchased shares (approx. 11.2 Lakh shares) via bulk deals. When promoters buy at market prices, it signals they believe the stock is undervalued.
> SJVN Order: The recent execution of the 200MW Solar Project agreement with SJVN (worth ~₹696 Cr) has improved revenue visibility for 2026.
📈 2. The Chart Structure (The Triangle)
> The Setup: The stock has been consolidating in a Symmetrical Triangle since the ATH.
- Support: The bounce from ₹313 (and the recent higher low) was the launchpad.
- Resistance: The stock is now "Kissing" the downward-sloping trendline (around ₹510–₹515 levels).
> Current Status: Despite the +26% move, a daily close above this angular trendline is needed to confirm the end of the correction.
📊 3. Volume & Indicators
> Volume Spike: The volume of 77M+ (combined sessions/exchanges) is an "Institutional Stamp." This is not retail accumulation; this is big money entering.
> RSI: Rising sharply. Note that daily RSI is entering "Overbought" territory (>70) due to the sudden surge. In strong momentum trends (like Power/Energy), RSI can stay overbought for weeks.
🎯 4. Future Scenarios & Key Levels
The stock is at the "Make or Break" point at the trendline.
> 🐂 Bullish Breakout (The Continuation):
- Trigger: A decisive Daily Close above ₹515 .
- Target: ₹581 .
- Blue Sky: If ₹581 clears, the path opens to retest the ATH ( ₹743 adjusted/unadjusted depending on chart).
> 🛡️ Support (The "Pullback"):
- Immediate Support: ₹479 . Since the stock rose +26% in 2 days, a cooling-off pullback to ₹479 is healthy and should be used to add.
- Stop Loss: A close below ₹450 (mid-point of the surge candle) would signal that the momentum was a "flash in the pan."
Conclusion
This is a High-Octane Setup .
> Refinement: The Promoter Buying makes this a "Buy on Dips" candidate rather than a "Sell on Resistance" one.
> Strategy: Watch for the ₹515 breakout. If it clears, the momentum will likely carry it swiftly to ₹580 .

Seeing vs Believing: Multi-Pattern Structure vs Single-Line BOOn the left, the weekly chart is mapped as a full A+ type setup, where multiple structural elements work together instead of relying on a single, convenient line.
-A red counter trendline marks a series of lower-high rejection points, visually defining the “least liquidity” supply line that price has repeatedly respected.
-A dotted parallel channel outlines a broader multi-pattern context.
-A dashed hidden line adds another layer of structure, hinting at less obvious inflection zones that are not visible at first glance but often align with prior reactions.
-Finally, an orange line represents a higher time frame resistance level, bringing in a top-down perspective so that the current weekly price action is seen in relation to a dominant, bigger-picture barrier.
On the right, by contrast, the chart is reduced to a single white line drawn in a way that “forces” the candles to appear as if they are breaking out.
This is a great example of chart psychology in action: instead of objectively mapping all relevant patterns, many traders draw what they want to see—one clean breakout line—ignoring hidden structures, multi-timeframe confluence, and complex pattern overlap.
The intention of this post is purely observational and educational, not forecasting.
It aims to show how a professional, multi-pattern approach (CT lines, channels, hidden lines, and higher timeframe levels) can radically change the way a chart is interpreted compared to the simplistic, single-line breakout mindset that dominates retail thinking.
Disclaimer: This post is for educational and illustrative purposes only and does not constitute investment, trading, or financial advice. Always do your own research and consult a registered financial professional before making any trading decisions.

Simple Triangle Pattern on a Monthly Time FrameOverview -
This monthly chart illustrates a symmetrical triangle pattern defined by a series of higher lows and relatively stable swing highs, framed by a green ascending trendline and a red counter-trendline. The structure is presented in an observational manner to highlight how price has evolved within these converging boundaries over an extended period.
Triangle structure -
1.The green line represents the primary trendline, drawn from successive higher swing lows where price has repeatedly found support and turned back up. Each time price touches or approaches this green line, the contact is marked with a blue upward arrow box to emphasize how buyers have consistently responded around this rising level. Together, these points of contact visually document the stepping pattern of higher lows that contributes to the lower boundary of the triangle.
2.The red line acts as the counter-trendline, connecting multiple prominent swing highs where upward movement has stalled and reversed. Blue downward arrow boxes are placed at these touchpoints to highlight how price has respected this sloping resistance zone over time. The repeated interaction with the red line shows how sellers have been active around this upper boundary, creating a series of contained pushes to the upside.
Understanding -
The overall construction emphasizes how multiple touches on both the trendline (T) and counter-trendline (CT) are used to validate the presence of this symmetrical triangle. Rather than focusing on any single candle, the chart showcases the cumulative behaviour of price over many months, making it a useful visual example for studying how support and resistance can evolve into a geometric pattern on a higher time frame.
Disclaimer: This description is purely educational and observational, intended to explain chart structure and pattern formation. It does not constitute investment advice, trade recommendations, or any suggestion to buy, sell, or hold any financial instrument.
Gravita Triangle Breakout 1DGravita is attempting to breakout after forming a triangle pattern on 1D timeframe with high volumes. The stock is also trading above 200ema. Enter after bullish confirmation.

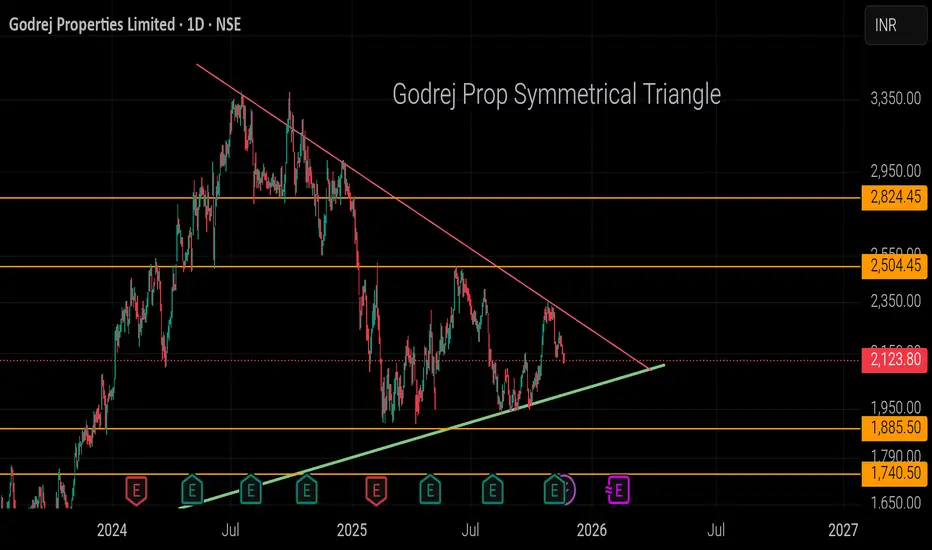
Godrej Properties Symmetrical TriangleGodrej Properties is forming a Symmetrical Triangle. The recent news signify that they have acquired land / property deal worth of 2400 Cr which can boost the stock. I've outlined 4 possible targets using the Fib Tool. Not sure if it's gonna go down or up. Let me know your opinion about it.
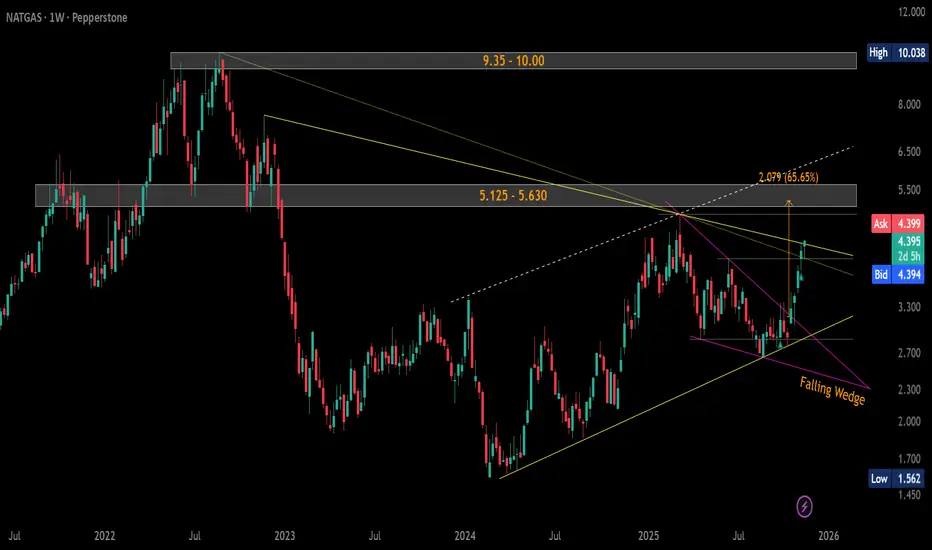
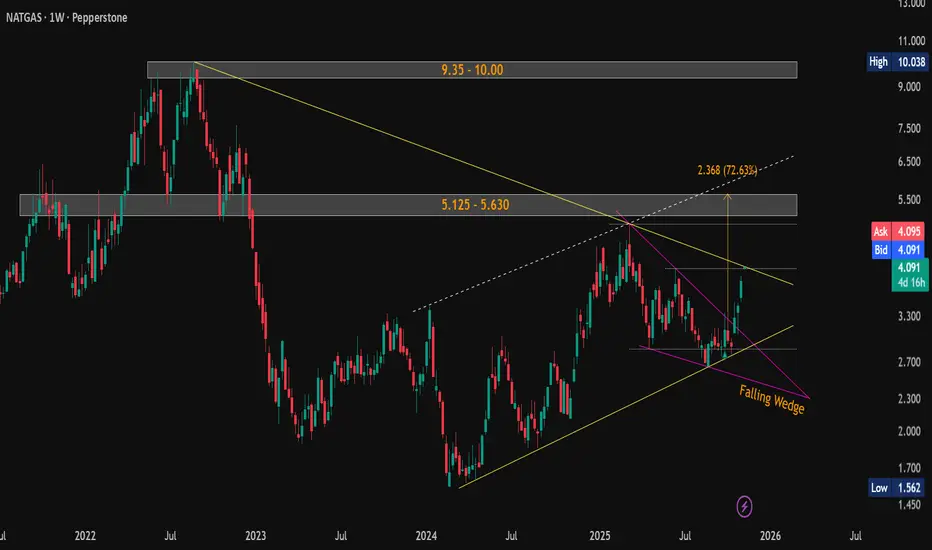
#NaturalGas ($NG) Weekly Update — Trading at Breakout ZoneCMP: $4.400
+54% from suggested levels and +58% from lows. 🚀
Price trading in the key resistance zone $4.339–4.417.
WCB > $4.417 = Symmetrical Triangle breakout → Falling Wedge target: $5.246 🎯
🛡 Supports: $4.067 / $3.803 / $3.625–$3.572
🚧 Major Resistances:
• ST: $5.125–$5.630
• LT: $9.35–$10.00
Tight structure… breakout looks close. 🔥
#NG VANTAGE:NG #NaturalGas #Commodities #PriceAction #SymmetricalTriangle #FallingWedge #ChartPatterns #Breakout
📌 #Disclaimer: This analysis is shared for educational purposes only. It is not a buy/sell recommendation. Please do your own research before making any trading decisions.
Symmetrical Triangle Formation with 50% EquilibriumVisual Structure and Pattern
-This chart illustrates a textbook symmetrical triangle pattern forming after a strong directional move.
-The red line represents the counter trendline (CT), connecting a series of lower highs.
-The green line marks the ascending trendline, connecting the sequence of higher lows.
-These converging lines encapsulate a contracting price structure, where volatility reduces over time, emphasizing indecision and consolidation among market participants.
-Symmetrical triangles predominantly represent phases where markets consolidate after an impulsive run, and both sides (bulls and bears) gradually reach a point of agreement before the next expansion.
-The 50% equilibrium level within triangles often acts as a magnet for price, attracting liquidity and providing reference for institutional flows, a concept vital for advanced swing trading and risk management.
This post is strictly for educational and analytical purposes, focusing only on chart structures and observable patterns. No content here should be taken as an indication of future price direction or as investment advice.
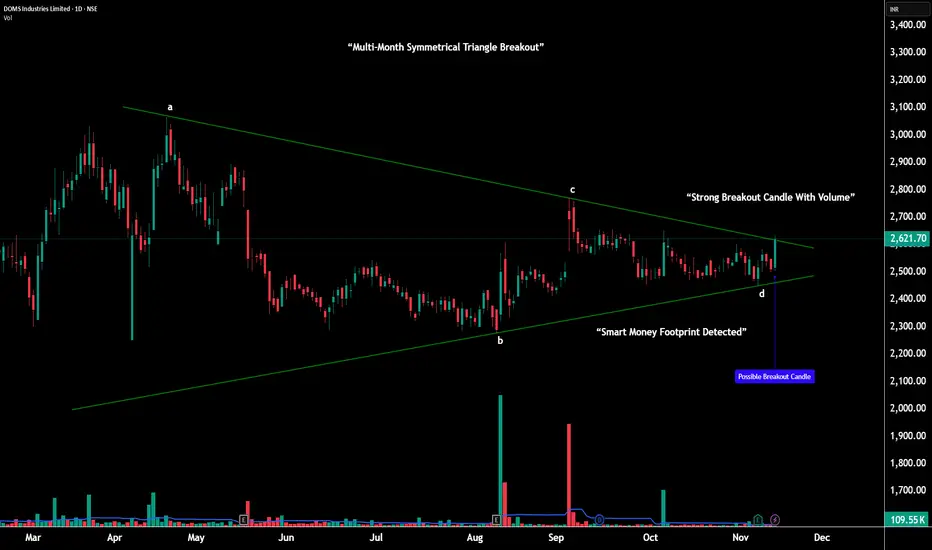
DOMS – Multi-Month Triangle Breakout |________________________________________
💹 DOMS Industries Ltd (NSE: DOMS)
Sector: Consumer & Stationery Products | CMP: 2621.70 |
View: Multi-Month Symmetrical Triangle Breakout With Expanding Momentum
________________________________________
📊 Price Action:
DOMS has spent the last five months forming a large symmetrical triangle — a volatility contraction structure marked by steady lower highs and higher lows from points A–B–C–D.
Throughout this period, buyers consistently defended the broader 2470–2500 demand belt, while sellers lost strength on every push lower.
This slow tightening shows how the market was preparing for a decisive move.
In the latest session, DOMS finally broke above the upper trendline, backed by a strong bullish range candle and a clear rise in volume, confirming the start of a fresh expansion phase.
________________________________________
📉 Chart Pattern Analysis – Large A–B–C–D Symmetrical Triangle:
This multi-month structure represents a major volatility compression following a previous uptrend — a classic continuation setup.
Point A: First major lower high
Point B: Deep anchor low
Point C: Lower high confirming supply weakening
Point D: Higher low showing demand strengthening
This clean A–B–C–D formation validates the symmetrical triangle perfectly.
As price approached the apex, volatility dried up, volume decreased, and the range narrowed — all ideal ingredients for a strong breakout.
The breakout candle now signals the end of compression and beginning of trend expansion.
________________________________________
📈 STWP Trading Analysis:
Bullish Breakout Zone: 2621.70 – 2633.20 | Stop Loss: 2498.60
The breakout candle shows high momentum and elevated volume, signaling institutional activity. Price has reclaimed all key moving averages with trend strength visible across 1H–1D–1W timeframes. As long as DOMS holds above the 2570–2590 structure zone, the bullish continuation bias remains active. Upside resistance levels can be used as potential levels of partial profit-taking, momentum checkpoints, and trend continuation targets.
________________________________________
🕯️ Candlestick Structure – Strong Bullish Breakout Candle:
The latest session printed a wide-range bullish candle, breaking through the upper triangle boundary decisively.
This type of candle — strong body, controlled wicks, clean range expansion — reflects conviction buying, not speculative spikes.
When this appears at the apex of a large compression pattern, it often marks the start of a new trending phase.
________________________________________
📏 Fibonacci Analysis:
Measured from swing low 2275.40 to swing high 2585.70:
38.2% @ 2393 → Secondary support
50% @ 2430 → Balanced support zone
61.8% @ 2467 → Strong golden zone (defended repeatedly)
The rebound from the 61.8% area aligns with the D-point of the triangle — reinforcing the structural validity and strengthening the breakout.
________________________________________
🧭 STWP Support & Resistance:
Resistances: 2667 | 2713 | 2794
Supports: 2540 | 2459 | 2413
The 2470–2500 region remains a major demand base, where the stock formed its higher lows at point D.
Immediate supply lies near 2667–2713, the first test zone after the breakout.
________________________________________
📊 STWP Volume & Technical Setup:
Volume climbed to 109.55K, significantly higher than recent averages — showing accumulation on the breakout.
RSI at 59 and Stochastic at 67 suggest healthy momentum with room for continuation.
MACD structure remains bullish, and multi-timeframe trend strength is intact.
Trend Direction: UPTREND | Volume Confirmation: Strong Buying Activity
________________________________________
🧩 STWP Summary View:
Momentum: Strong
Trend: Bullish
Risk: Moderate
Volume: High
DOMS has broken out of a large multi-month symmetrical triangle, a pattern known for initiating strong directional moves once volatility expands.
The structure remains bullish above 2570–2590, with continuation potential toward 2667 → 2713 → 2794 in the coming sessions.
________________________________________
⚠️ Disclosure & Disclaimer – Please Read Carefully
This analysis is for educational purposes only and should not be treated as investment advice.
I am not a SEBI-registered financial advisor.
Trading carries risk — use stop-loss, risk limits, and disciplined position sizing.
Please consult a SEBI-registered adviser before making trading decisions.
________________________________________
Position Status: No active position in (DOMS) at the time of this analysis.
Data Source: TradingView & NSE India
________________________________________
💬 Found this useful?
🔼 Boost this post to help more traders learn structured analysis
💭 Share your thoughts — does this breakout hold the strength for trend expansion?
🔁 Share with traders who study breakout structures
👉 Follow for more clean, price-action-driven institutional breakdowns
🚀 Stay Calm. Stay Clean. Trade With Patience.
Trade Smart | Learn Zones | Be Self-Reliant 📊
________________________________________
Symmetrical Triangle Structure & Key EquilibriumEditorial Insights
- Symmetrical triangles signal a balanced tug-of-war between buyers and sellers; this compression, as mapped here, often precedes significant expansions in volume and volatility.
- The triangular structure’s edges—CT (red) and trendline (green)—have been tested repeatedly over months, reflecting both supply absorption and demand resilience.
- The hidden white line adds a subtle layer of convergence, useful for traders identifying areas of potential liquidity concentration.
- The yellow 50% Fibonacci level frames the equilibrium for this market phase, offering a snapshot of price discovery dynamics within the triangle.
- Price positioning relative to all these lines is best seen as a way to monitor evolving order flow and market intent, without any explicit forecasting or directional bias.
Key Levels & Reference
- CT (Red): Major supply test points.
- Trendline (Green): Demand and higher low sequence.
- Hidden Line (White): Structural convergence not visibly obvious but influential.
- Fibonacci 50% (Yellow): Core equilibrium reflecting price agreement zone.
This post is for educational and analytical purposes, respecting the principle that all information is a visual observation—not a prediction or directional signal, but a live structure map to enrich your pattern playbook.
#NaturalGas ($NG) Weekly Update — Testing Critical Resistance!CMP: $4.092
💥 Up +38% from mentioned support ( $3.013–$2.956 ) and +46% from lows in a month . 🚀
The falling wedge breakout played out strongly, and price is now testing the critical resistance of the falling yellow trendline near the previous swing high $4.067 .
A weekly close above this trendline will confirm a major breakout , potentially triggering the next leg higher.
📊 Key Levels:
🛡 Supports: $4.067 / $3.013–$2.956 / $2.692–$2.643
🚧 Resistances / Targets: $5.125–$5.630 / $9.35–$10.00
Structure now forming a larger Symmetrical Triangle between rising and falling yellow trendlines — watch for breakout confirmation .
⚠️ Possible short-term pause/retest before continuation.
#NaturalGas #NG #Commodities #FallingWedge #RisingChannel #SymmetricalTriangle #ChartPattern #PriceAction
📌 #Disclaimer: This analysis is shared for educational purposes only. It is not a buy/sell recommendation. Please do your own research before making any trading decisions.
VCP Formation within Symmetrical Triangle above 200 EMAThis chart displays a Volatility Contraction Pattern (VCP) developing within a classic symmetrical triangle on the daily timeframe. Two sharply converging trendlines encapsulate the price action with the lower line connecting a series of higher lows (the trendline) and the upper line linking lower highs (counter trendline). Such convergence is characteristic of symmetrical triangles, which represent a period of price consolidation and equilibrium between buyers and sellers.
Volume tends to contract as the pattern matures, signaling market indecision and reduced volatility. Notably, this consolidation is taking place right around the 200-day moving average, which serves as an important reference point for longer-term market participants. The convergence of price and volume patterns here aligns with textbook VCP behaviour and highlights the potential for significant crowd psychology shifts.
This post’s intent is observational and educational, focusing on the visual behavior of price and volume embedded within technical patterns. Studying such symmetries can strengthen understanding of market structure and technical analysis skills, allowing for systematic review rather than speculative outlooks or trade signals.
MRPL Triangle BreakoutMRPL has given a Breakout after forming a Triangle Pattern on 1D timeframe with very high volumes. The stock is also trading above its 200EMA.

Supply-Demand Squeeze: Symmetrical Triangle at the Flip zoneWitness a textbook supply-demand play on the monthly chart of Bharat Wire Ropes Ltd. as price contracts above a major zone conversion! The chart highlights a high-probability symmetrical triangle pattern—marked with a red counter trendline (lower highs) and a green trendline (higher lows).
This powerful squeeze forms right at the intersection of key supply and demand zones.
- Both supply (resistance) and demand (support) have been mapped for clear zone analysis.
- The symmetrical triangle shows classic price contraction
- Red line: Counter trendline connecting lower highs.
- Green line: Trendline connecting higher lows.
Disclaimer:
This Observation / Post is for educational purposes only and does not constitute investment advice. Please do your own research and consult with a financial advisor before making any trading decisions.

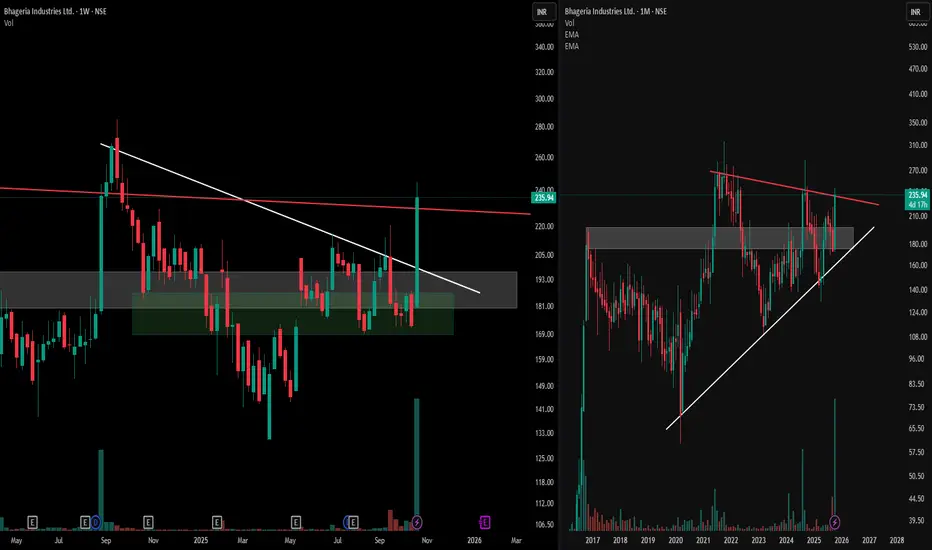
Mastering MTFA Charts : Symmetrical & Descending PatternsObserve the synergy of multiple time frames with this detailed analysis of Bhageria Industries Ltd.
Target Points -
1) The right panel displays a monthly chart, highlighting a broad symmetrical triangle formation within a prominent supply-demand zone—notice how the structure showcases the interplay of lower highs and higher lows, reflecting a period of equilibrium and market compression.
2) The left panel brings the focus to the weekly time frame, where a descending triangle pattern unfolds, providing additional insight into the ongoing price structure.
3) This multi-time frame approach emphasizes how patterns from broader time frames interact with shorter-term consolidations, enhancing our ability to spot critical decision areas on the charts.
4) Using both the monthly and weekly perspectives together, traders and learners can deepen their understanding of structural price action, pattern development, and the relevance of context provided by supply and demand zones. Dissecting these formations side by side promotes disciplined, informed chart reading without bias towards anticipating outcomes.
This analysis is for educational purposes only and does not constitute financial advice.
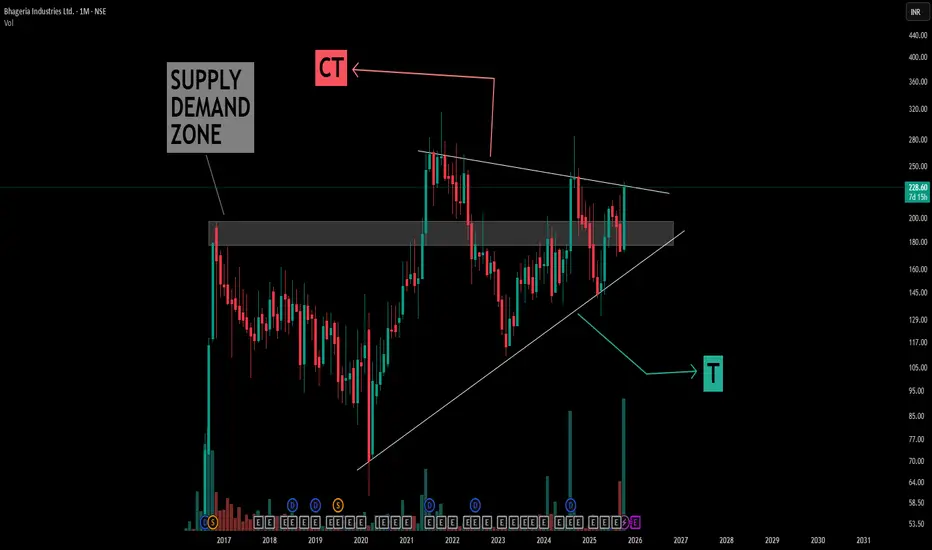
Understanding Symmetrical Triangle Patterns in depthThis chart illustrates a classic example of a symmetrical triangle pattern formed over several years, with simple compression trendline (CT) and trigger (T) lines drawn in white for clarity.
Key learning points from the structure:
- Symmetrical Triangle Formation: The pattern is defined by converging trendlines representing successive lower highs and higher lows, indicating a period of price consolidation and market indecision
- Supply Converts to Demand: The boxed area initially acted as supply, where price faced resistance repeatedly. Over time, after multiple interactions and a structural shift, this area began to act as demand, offering support to subsequent price movements. This showcases how prior resistance can evolve into a support zone as market dynamics shift.
- Pattern Context: A large symmetrical triangle is forming above this zone, highlighting sustained equilibrium between buyers and sellers, and price compressing within clearly defined boundaries.
- Educational Note: Patterns like these offer valuable case studies for understanding consolidation phases, the role of supply and demand flipping, and how market structure can evolve. They can be identified and studied without making directional assumptions, serving as an excellent foundation for technical analysis practice.
This post is aimed purely at technical education, emphasizing the process of chart marking, pattern recognition, and structural interpretation, without making market predictions or outcome forecasts.
Bharat Forge (BHARATFORG)Pattern: Symmetrical Triangle
Breakout Zone: Above ₹1,272
Structure: Higher-low formation inside triangle; RSI > 55, MACD crossover supportive
Volume: Expansion seen near breakout candle
Plan:
Buy Trigger: Close above ₹1,272
Stoploss: ATR-based (~₹1,230)
Targets: ₹1,380 → ₹1,450
View: Momentum-supported breakout; auto-ancillary sector showing rotation strength.
