Symmetrical Triangle Pattern Trading Strategy NSE:BERGEPAINT
When market break on upside or break the resistance line of this pattern, market was totally on bullish nature and we have to catch that bull run.
Symmetrical Triangle

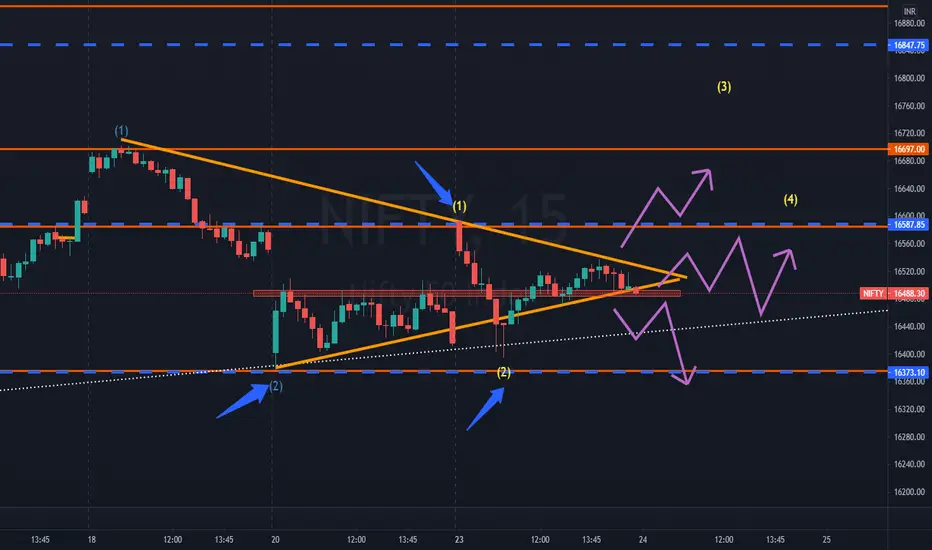
nifty prediction for the upcoming trading sessionsVolatile start for the week!
Gap up- downward trend in the first half - closing in positive.
Currently, we can see a symmetrical triangle and breakout/down can happen, with the immediate range of 16587 and 16373.
21 and 55ema are also closing in.
Option buyers should stick to buying ATM strikes and should maintain tight SL
3MINDIA RETESTING SYMMETRICAL TL BO3MINDIA is now at the urge of retesting the recent breakout from symmetrical triangle pattern at weekly timeframe
1.) Frist retest point is near 200MA
2.) Supported by RSI
3.) Volume expansion
Execute the trade onle if you see some good sign of bullishness at time of retesting
TARGETS ARE ALREADY MENTIONED IN THE CHART
KEEP STOPLOSS ACCORDING TO RISKPROFILE
ASK YOUR FINANCIAL ADVISOR BEFORE TAKING ANY TRADE
THIS IDEA IS PURELY FOR EDUCATIONAL PURPOSE

Symmetrical triangle pattern Butterfly is getting ready to fly in the sky so don't miss it...
this stock is consolidating since the month of April
the trendline is also valid because it touches more than two times
so if you get any opportunity in lower time frame catch it

HAPPIEST MINDS - SYMMETRICAL TRIANGLE PATTERNHappiest Minds stock formed Symmetrical Triangle Pattern which is a neutral pattern where the stock can be bullish or bearish. So, we can expect the stock may go long or short.
Please check the chart for details. Mentioned clearly about the support and resistance points (if applicable).
Chances for Long is high and short is low in my opinion.
I am learning as well. so please analyse the chart by yourselves before taking any decisions.
Criticism always welcome. Appreciation as well.
Thank you.

ZOMATO #Watchlist
#ZOMATO (30TF):- CMP 133.40, Trading into (Symmetrical Triangle pattern) and taking support keep Track :)
1) Wait for Breakout/Breakdown :)
2)RSI breakout now its taking support from breakout zone :)

#TLM/USDT CHART BREAKOUT COMING!!!Guys in this chart it is forming symmetrical triangle in 1D timeframe, if this breakout happens in upward direction than targets are $0.39 and $0.43 but if this breakout happens in downside than targets are $0.2272 and $0.1372. But guys according to me it will break upwards but for confirmation always wait for breakout.

Banknifty spot 60MinsJust for educational purpose!!! All about symmetrical triangle, upward channels and trendlines!!!

TITAN: Intraday AnalysisTitan is range-bound in a symmetrical triangle formation which is now narrowing down. a breakout/breakdown of this range can occur tomorrow and can give us a good movement on either of the sides.

HCL Technologies: Intraday AnalysisHCL Technologies forming a symmetrical triangle on 15 Minute chart and simultaneously taking support from the Demand and Supply Zone which was previously acting as resistance but now turned into support on multiple occasions.

ZEEL POSITIONAL TRADE SETUP As you see in the charts, Zee Entertainment Ltd is making symmetrical triangle.
.
If it's given breakout we can see the targets of 230.
.
Our stoploss would be 179

IndusInd Bank- A stock that can fly HIGHIndusind bank is making great chart patterns. One of them is already posted as symmetrical triangle where stock now has no area left to move so sooner or later it will breakout either way.
Let me show something in monthly chart:-
Above chart shows how beautifully this stock respects 20 SMA .Earlier when it was trading above 20 SMA it was always coming back to average itself and started new journey. and when it was trading below that it came back and fell again.
Its been a while now that it is trading above 20 SMA and has been consolidating for several months.
Another chart with Long term targets:-
Hope this will help investors and traders in some way.
Keep an eye ladies and gentleman.
Fingers crossed. Happy Trading.

VOLTAS LONG [Symettrical Triangle]Voltas taking support at the bottom of the traingle, can go long for swing trade above 1040 with stop loss of 1004 and aim for a target of 1111

CANBK SYMMETRICAL TRIANGLE PATTERNPOSSIBLE BREAKOUT
Disclaimer: Please consult your financial advisor,
Investment/Trading in the securities market is subject to market risk, We are not responsible for your profit or loss

Maruti Suzuki: Intraday analysisMaruti Suzuki formed a Symmetrical Triangle on an hourly chart. Supply and Demand Zone will act as a strong resistance and will try to push it further down.

Hcl Technologies: Symmetrical Triangle breakoutHCL Technologies broke out of a Symmetrical Triangle formation on the 15-minute chart.
Has already retested the Symmetrical Triangle and simultaneously taking support from a Parallel Channel trendline.

ZOMATO'S breakuut possible - SYMMETRICAL TRIANGLE PATTERN Zomato listed on 23/5/21 and then creating life time high of 148 and now it has created a SYMMETRICAL TRIANGLE PATTERN on 2H chart . Now zomato can give either side breakout. for upside it can create a new lifetime high or can break its low of 116. A very impressive either side breakout can happen with huge volume.

Symmetrical triangle formation - Tata SteelTata steel is converging and has a possibility to breakout either ways in shorter timeframe, however looking at the trend of the stock the possibility is higher on the upper side.

Hdfc ltd conditional trade...Hdfc Ltd spot cmp 2500
Time frame :- Daily
Study : Elliot wave
Wave 1 :- Wave 1 is first impulse wave of impulse phase,, in this case study first wave consist of 470 points in terms of points and 32% in terms of percentage,, first wave is generally of no confidence movement,, buyers still dont have confidence that the trend will change and the upside impulse move will start,, so it spends time in that reversal zone.
Wave 2 :- wave 2 is first corrective wave of impulse phase, in this case study second wave consist of 325 points and have retraced around 78.6% of wave 1,, general rule as per theory is wave 2 retraces around 50 to 88.6% of wave 1,, the retracement of wave 2 is sharp in nature and are of very short period,, and wave 2 low can not be below the low point of the start of the impulse phase..
Wave 3 :- wave 3 is second impulse wave of impulse phase,, in this case study third wave consist of 1268 points in terms of points and 78% in terms of percentage,, 3rd wave is longest and strongest wave of impulse phase,, once price breaks out above high price of wave 1 traders jumps into the trade and wave 3 is extended wave of wave one,, it can extend from 1.618% to 3.618% of wave 1 in both terms of points and in terms of percentage,, in this case wave 3 have extended around 2.618% of wave 1 in terms of price and percentage.. wave 3 also consist of minor impulse phase which is shown as part wave of 1-2-3-4-5 of wave 3.
Wave 4 :- wave 4 is second corrective wave of impulse phase, in this case study forth wave consist of 542 points and have retraced around 38.2% of wave 3,, general rule as per theory is wave 4 retraces around 23.6% to 50% of wave 3,, the retracement of wave is slow and in zig zag manner,, generally triangles and flats,, and are time consuming,, and wave 4 can not go below the peak levels of wave 1,, in this case study wave 4 is in form of symmetrical triangle,, descending triangle and on smaller time frame last leg have bullish wolf wave formation,,
Wave 5 :- Wave 5 is third and final impulse wave of impulse phase, in this case study we are pre assuming the wave 4 have matured and wave 5 will unfold from this levels,, reason for the same is breakout from symmetrical triangle formation of wave 4 , breakout from wolf wave on smaller internal wave formed in wave 4,,bullish divergence in RSI indicator,, MACD on verge to give positive cross over and breakout from falling trend line,, this all are consideration for wave 5 to unfold,, now wave 5 are ephoric in nature, move are in form of parabolic steep and in rising wedge formation,, wave 5 are equivalent to wave one and are 61.8% of wave 3,, if we go as per this calculation wave 5 can end around 3110 to 3190,, as per price action breakout of symmetrical triangle gives same amount of move after breakout that will lead to 3110,, now as per wave 1 in terms of points wave 5 will be of 480 points than counter may head towards 2840 levels,, and as per % terms of wave 1 move of 32% would lead counter to levels of 3190,, which also coincides with 61.8% of wave 3,,
Much more can be included in this but will not be able to do so,,
Note :- personally holding this counter from 2400 levels..
Good bullish formation..

Symmetrical Triangle Breakout | PFC ⚡PFC Daily: CMP looks good for more upside
1) Symmetrical Triangle Breakout
2) Power stocks catching momentum

Kotak Bank (symmetrical triangle pattern) LONGAs you all can see there is a symmetrical triangle pattern forming in Kotak bank which can lead to a break out on either side but as you can see that 1626 recently acted as a strong support and it has taken support on the trend lines down side 4 times and upside trend line it has acted as restitance 4 times , so if it break above 1730 we can see a strong breakout in Kotak Bank in august expiry , else if it acts as resistance again it will retest the support of the trendlines again , so keeping stop loss as 1625 and first target as 1730 and if it breaks we can again test the ATH ;).
Hope it was helpful for some of you :)
Note: The above is strictly my view and not a trade recommendation. Consult your financial advisor before making any trade. This is completely for educational purpose

LONG TRADE OPPURTUNITY (POSITIONAL TRADE SETUP)Clearly Showing a Symmetric Triangle Pattern
Breakout and Retest Should be Traded
.
.
.
.
.
If u Like The Idea Hit the Like Button
Leave a Comment

Nifty auto spot good long candidateNifty auto spot cmp 10000.
Study :- Time Cycle, Wolf wave, Harmonic , Chart Pattern.
Time Frame :- Daily.
Time Cycle :- Bottom to bottom cycle of 74 TD indicate index is making bottom at interval of 74 TD and at the moment index is at 74 TD so if this cycle is matured and the next cycle unfolds we may see a change in trend from now onwards as per this cyclic nature,,, as per peak to peak cycle index might see upmove till first week of october..
Wolf wave :- At the moment index is trading in 5th wave of wolf wave formtation,, if wave 5 mature around this levels and reversal is seen in index from current levels,, than new bull run can be seen in this index and may give out performance now onwards,,,
Hidden bullish divergence in RSI indicator gives support for reversal in trend,,
Harmonic study :- Deep crab formation is observed as per retracement of last 2 swing ,, this can be pre assumption for the harmonic pattern ,, but if index manage to reverse from this levels , than would lead to formation of deep crab which have maturity point at much higher levels..
Chart Pattern :- Symmetrical triangle pattern,, index is trading around demand zone of triangle formation,, with divergence in indicators,, if managed to sustain above the demand line can give good reversal from current levels,, main trend can only be predicted once index gives breakout on either side of the triangel formation..
Good bullish formation observed in this index,, can start a fresh bull run....
