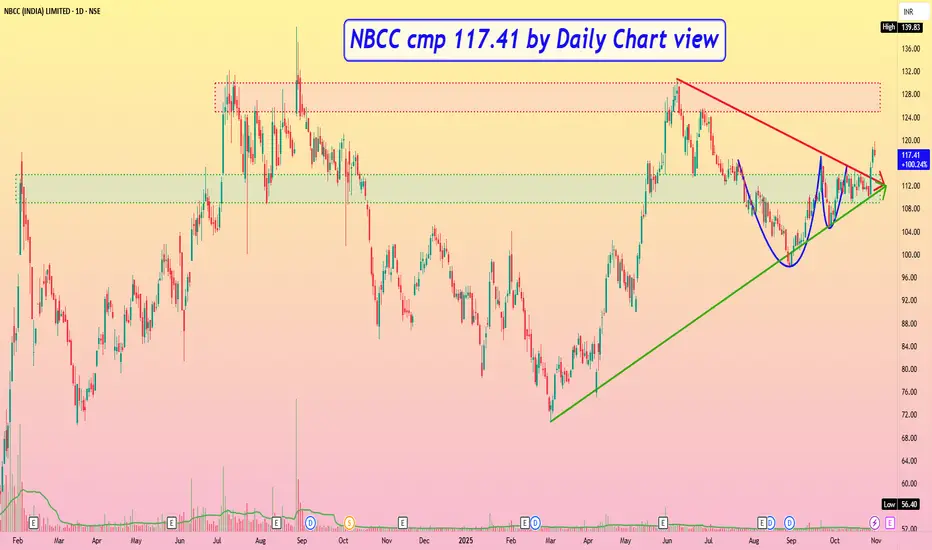
NBCC cmp 117.41 by Daily Chart viewNBCC cmp 117.41 by Daily Chart view
* Support Zone 109 to 114 Price Band
* Resistance Zone 125 to 130 Price Band then 137 to ATH 139.83
* Bullish Cup and Handle pattern is made around the Support Zone
* Symmetrical Triangle pattern breakout seems to be in making process
* Volumes in good sync with avg traded quantity and spiking above it too
* Falling Resistance Trendline Breakout with Rising Support Trendline well respected
Symmetricaltrianglebreakout
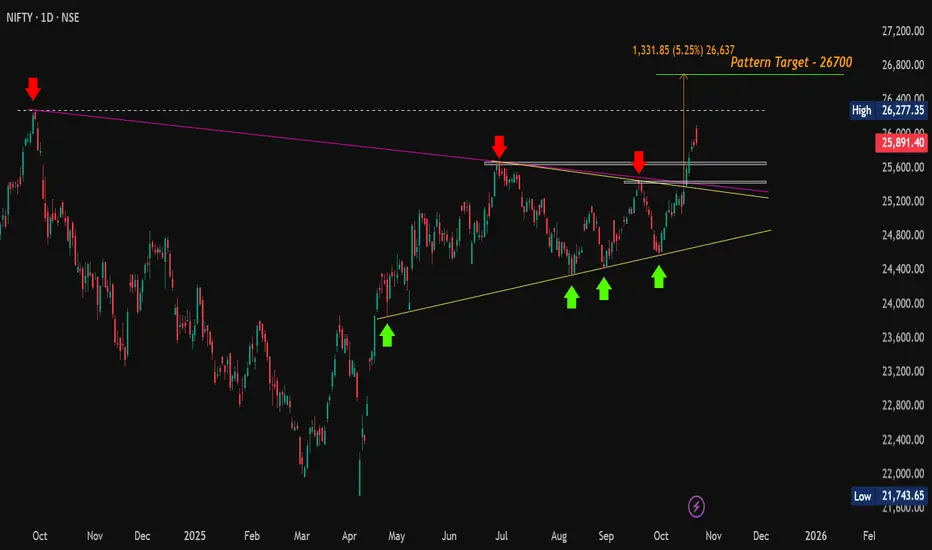
#Nifty | Breakout Confirmed, Now Eyes on Support for Next Move#Nifty Update (Daily):
CMP: 25,891.40
Following our previous update at 25,285, Nifty has decisively broken out above the Symmetrical Triangle pattern and surged to a high of 26,104 today. Price action formed a bearish candle but managed to close positively on the daily chart.
🔄 What to expect next?
A potential retest of breakout levels is likely as profit booking is expected after a strong rally of over 1,500 points from the swing low. Watch the key support zones closely for a possible bounce.
🔽 Support Zones to watch :
25,669 - 25,638
25,449 - 25,424
⚡️ If Nifty holds these levels and reverses, it could set the stage for a renewed upmove aimed at surpassing the all-time high (ATH) at 26,277.
🔼 Resistance Zones to watch :
26,104 (recent high)
26,216 - 26,277 (ATH)
📈 A sustained break above the ATH will confirm continuation toward the symmetrical triangle’s ultimate target near 26,700 .
#Nifty | #Nifty50 | #BreakOutRetest | #SymmetricalTriangle | #ChartPatterns | #SwingTrading | #PriceAction
📌 Disclaimer: This analysis is shared for educational purposes only. It is not a buy/sell recommendation. Please do your own research before making any trading decisions.
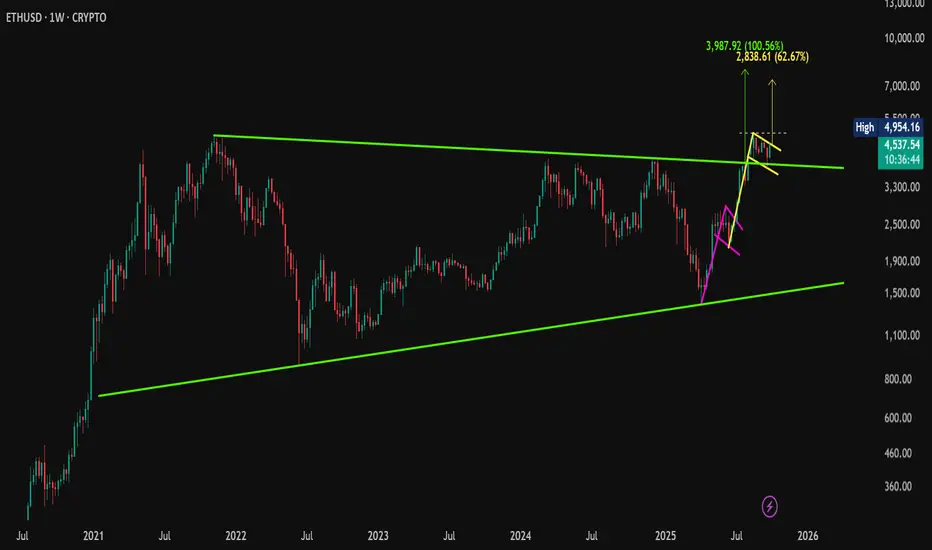
ETH Triangle Breakout + Bull Flag Setup – Is $8K Next?CMP: $4,540
Ethereum has broken out of a long-term symmetrical triangle , retested the trendline, and is now moving higher — signaling strong bullish momentum.
🔹 Breakout Retest Done – ETH completed a clean breakout and retest of the triangle resistance.
🔹 Bull Flags – Two bullish continuation flags have formed. The second flag is on the verge of breaking out , hinting at another potential leg up.
🔹 Pattern Targets –
• Bull Flag target: $7,365 +, if breakout confirms.
• Symmetrical Triangle target: $7,950 , which is over 62% above current price.
🟢 Key Level to Watch: A weekly close above $4,954.16 (previous ATH) would further validate the bullish structure.
#ETH | #Ethereum | #Crypto | #Breakout | #ChartPatterns | #SymmetricalTriangle | #BullFlag | #PriceAction
📌 Disclaimer: This analysis is shared for educational purposes only. It is not a buy/sell recommendation. Please do your own research before making any trading decisions.
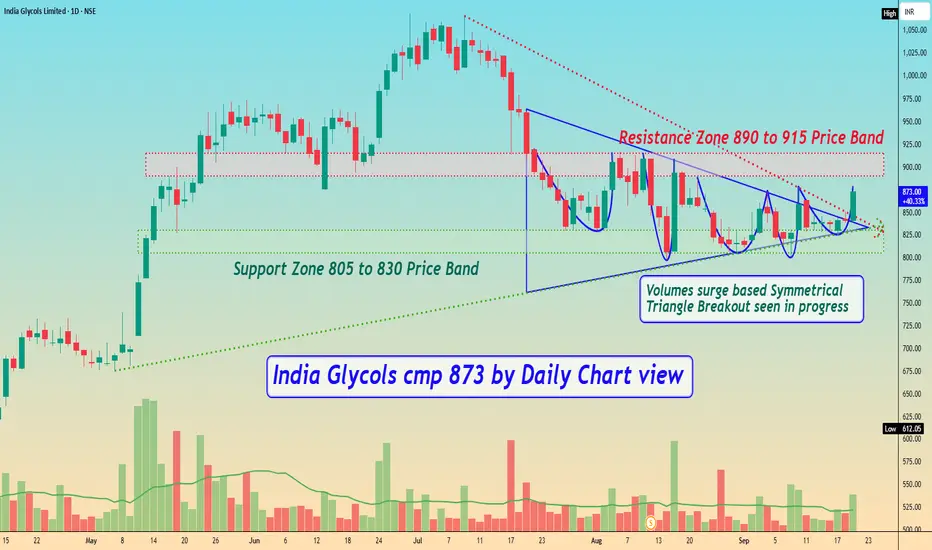
India Glycols cmp 873 by Daily Chart viewIndia Glycols cmp 873 by Daily Chart view
- Support Zone 805 to 830 Price Band
- Resistance Zone 890 to 915 Price Band
- Volumes surge based Symmetrical Triangle Breakout seen in progress
- Volumes in close sync with the average traded quantity over past few days
- Multiple Bullish Rounding Bottoms made around Support Zone for probable breakout
- Resistance Zone playing strongly since mid of July 2025 basis repeated price rise rejection
Shakti Pumps cmp 856.65 by Daily Chart viewShakti Pumps cmp 856.65 by Daily Chart view
- Support Zone 775 to 805 Price Band
- Resistance Zone 885 to 920 Price Band
- Symmetrical Triangle Breakout attempted
- Intermittent Heavy Volumes surge seen by demand based buying
- Rising Price Trendline and Channel indicating slow and steady upside momentum
- Fresh upside may be foreseen, post Resistance Zone Breakout and sustained closure above it for few days

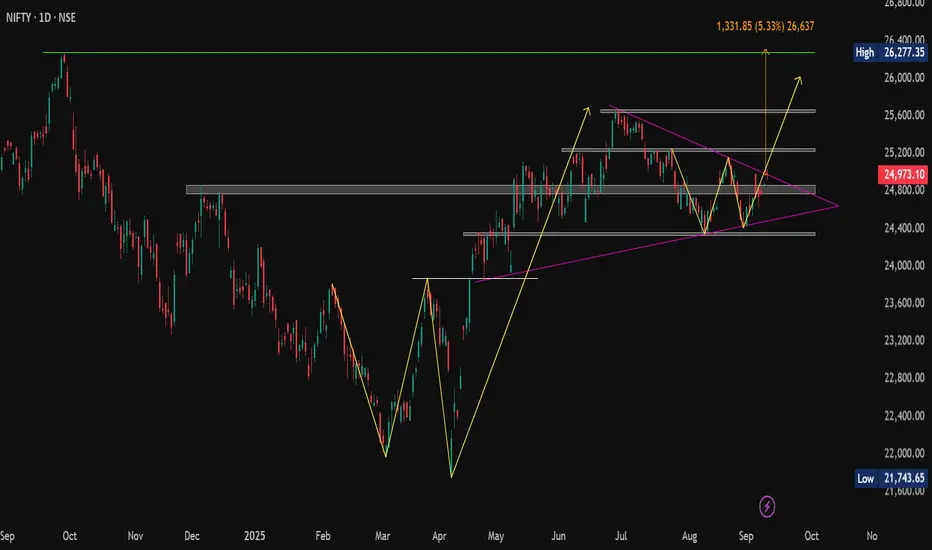
NIFTY: Ascending Triangle Breakout In PlayTechnical Outlook:
CMP: 24,973
📍 Immediate Support Zone: 24,858 – 24,768
📍 Strong Support Zone: 24,363 – 24,329
📍 Immediate Resistance Zone: 25,083 – 25,255 (Clustered zone)
📍 Strong Resistance Zones:
• 25,638 – 25,669
• 26,216 – 26,277 (All-Time High vicinity)
📈 Breakout Alerts:
✅ W-Pattern Breakout above 25,154 (Daily Candle Basis)
🎯 Target: 26,000
✅ Ascending Triangle Breakout above 24,972.50 ( Confirmed on Closing Basis today )
🎯 Target: 26,304 – aligning closely with the ATH of 26,277.35
Conclusion:
With two bullish patterns triggering nearly simultaneously, momentum is building. A sustained move above the immediate resistance cluster could fuel a rally towards uncharted territory.
Watch 25,154 and 25,255 – a clean move above could be the gateway to new all-time highs.
#BreakoutAlert | #TechnicalAnalysis | #ChartPatterns | #PriceAction
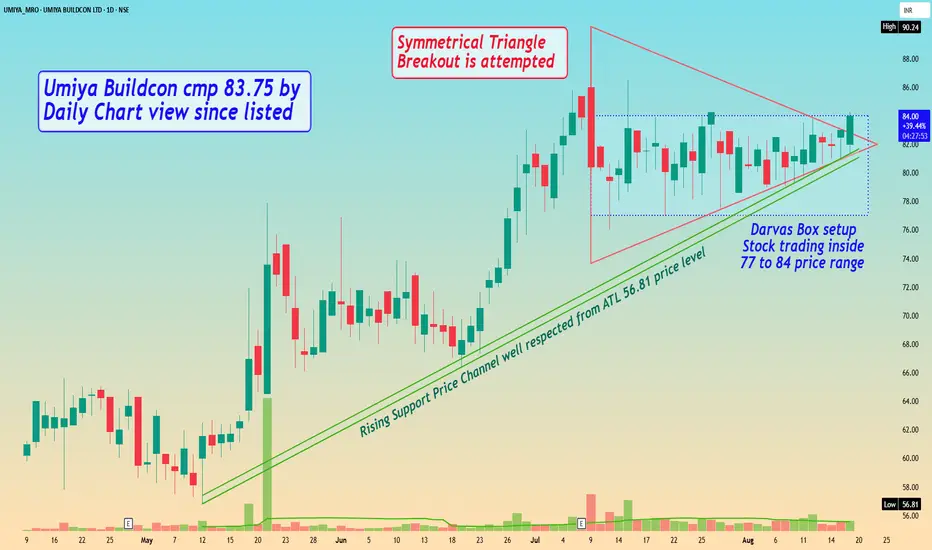
Umiya Buildcon cmp 83.75 by Daily Chart view since listedUmiya Buildcon cmp 83.75 by Daily Chart view since listed
- Support Zone 79 to 81 Price Band
- Resistance Zone 85 to 87 then ATH 90.24
- Symmetrical Triangle Breakout is attempted
- Volumes are in close sync with average traded quantity
- Darvas Box setup Stock trading inside 77 to 84 price range
- Rising Support Price Channel well respected from ATL 56.81 price level
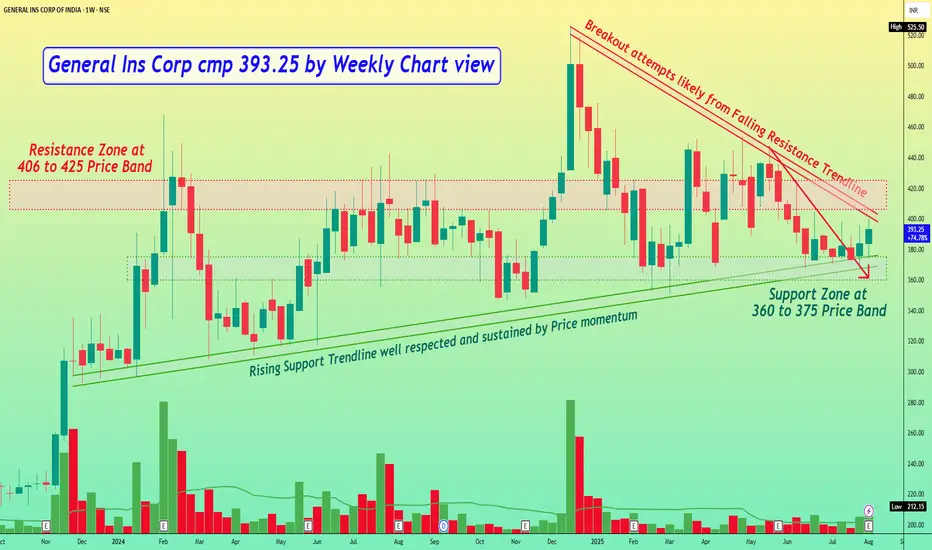
GICRE General Ins Corp cmp 393.25 by Weekly Chart viewGeneral Ins Corp cmp 393.25 by Weekly Chart view
- Support Zone at 360 to 375 Price Band
- Resistance Zone at 406 to 425 Price Band
- Breakout attempts likely from Falling Resistance Trendline
- Rising Support Trendline well respected and sustained by Price momentum
- Volumes seem well in sync with average traded quantity over the past few weeks
- *Subject to Strong Resistance Zone Breakout happens, it would a good hurdle to crossover*
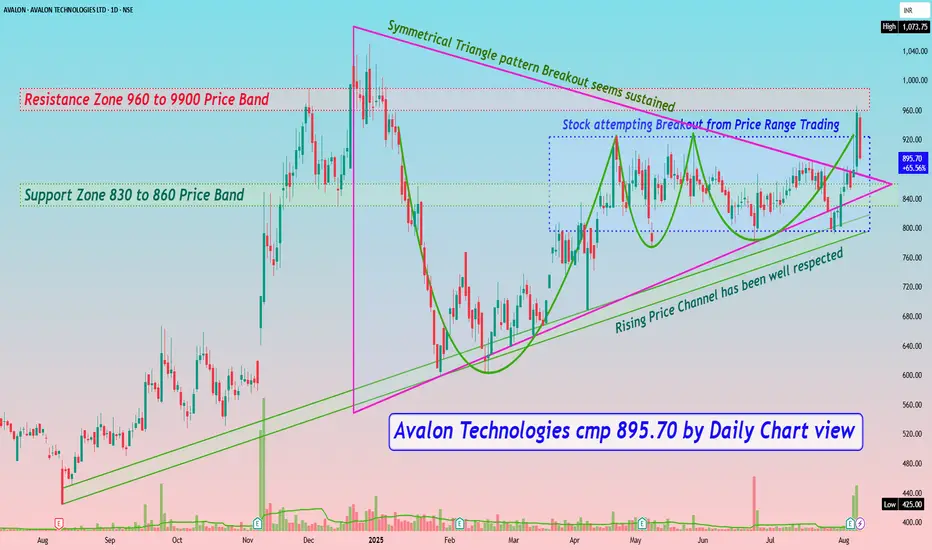
Avalon Technologies cmp 895.70 by Daily Chart viewAvalon Technologies cmp 895.70 by Daily Chart view
- Support Zone 830 to 860 Price Band
- Resistance Zone 960 to 9900 Price Band
- Rising Price Channel has been well respected
- Stock attempting Breakout from Price Range Trading
- Symmetrical Triangle pattern Breakout seems sustained
- Repeated Bullish Rounding Bottoms under Resistance Zone neckline
- Volumes spiked heavily at end of week and above average traded quantity
- Positively trending Technical Indicators BB, EMA, MACD, RSI,SAR, SuperTrend
BAJAJFINSV - Symmetrical Triangle Breakout🔊 BAJAJFINSV- Symmetrical Triangle Breakout
BAJAJFINSV- BAJAJ FINSERV LTD.
⌛Duration - Short Term (4 month to 8 month)
📊📈 Trade Logic - Symmetrical Triangle Breakout
CMP - 1783
Time Frame - Weekly
🎯Target 1 : 1950
🎯Target 2 : 2200
🎯Target 3 : 2475
🎯Target 4 : 2750
🛑 Stop : 1500
🏆 Risk/Reward Ratio (1: 3.3)
Disclaimer: The stock information shared above is not a recommendation to buy, sell, or hold. It reflects my own analysis and is intended solely for educational purposes. Any actions you take based on this information are your responsibility, and the admin of this channel is not liable for any financial gains or losses. Please consult a financial advisor before making any investment decisions. I am not a SEBI-registered advisor.

LTIM - SYMMETRICAL TRIANGLE BREAKOUT🔊 LTIM - LTIMINDTREE LTD.
⌛Duration - Long Term (8 month to 15 month)
📊📈 Trade Logic - Symmetrical triangle breakout
CMP - 6127
Time Frame - Weekly
🎯Target 1 : 6500
🎯Target 2 : 7580
🎯Target 3 : 8600
🎯Target 4 : 9200
🎯Target 5 : 10000
🛑 Stop : 5500
🏆 Risk/Reward Ratio (1:6)
Disclaimer: The stock information shared above is not a recommendation to buy, sell, or hold. It reflects my own analysis and is intended solely for educational purposes. Any actions you take based on this information are your responsibility, and the admin of this channel is not liable for any financial gains or losses. Please consult a financial advisor before making any investment decisions. I am not a SEBI-registered advisor.

Swan Energy - Breakout Soon#swanenergy #Swingtrade #breakouttrade #patterntrading #Symmetricaltrianglepattern
Swan Energy (swing trade)
>> Breakout candidate
>> Symmetrical Triangle pattern
>> Risk Reward favorable
>> Good strength in stock
Swing Traders can lock 10% profit & keep trailing
Please give a Boost or comment if u r Liking the analysis & Learning from it. Keep showing ur Love by following
Disclaimer : This is not a Trade Recommendations & Charts/ stocks Mentioned are for Learning/Educational Purpose. Do your Own Analysis before Taking positions.

BREAKOUT IN HIKAL 📌SWING TRADE FOR NEXT WEEK🚀
Hello Traders⚡
I am a Swing Trader by Passion i only trade on Momentum Stock's.
📌I Post Daily SWING CHARTS Analysis on My Trading view profile..
So let's Start
📌TRADE ANALYSIS OF HIKAL
• Potential Breakout Chart
• Symmetrical Triangle Pattern
• Short Range Consolidation
• Price Can Take Retest from support Line
• Overall The Price Is Moving In HH-HL Formation
• Volume Buildup Near BO Zone
• Looks Good For 10-20% Upside Levels After The Breakout
📌 If you have any questions about any stock you can comment on post 📱
📌Disclaimer:-
This all chatrs analysis are only for educational purposes only
I do not provide any CALL or Tips

BREAKOUT IN ELIN 📌SWING TRADE FOR NEXT WEEK🚀
Hello Traders⚡
I am a Swing Trader by Passion i only trade on Momentum Stock's.
📌I Post Daily SWING CHARTS Analysis on My Trading view profile..
So let's Start
📌TRADE ANALYSIS OF ELIN
• Potential Breakout Chart
• Symmetrical Triangle Pattern
• Short Range Consolidation
• Price Can Take Retest from support Line
• Overall The Price Is Moving In HH-HL Formation
• Volume Buildup Near BO Zone
• Looks Good For 10-20% Upside Levels After The Breakout
📌 If you have any questions about any stock you can comment on post 📱
📌Disclaimer:-
This all chatrs analysis are only for educational purposes only
I do not provide any CALL or Tips

BREAKOUT IN SUPARJIT 📌SWING TRADE FOR NEXT WEEK🚀
Hello Traders⚡
I am a Swing Trader by Passion i only trade on Momentum Stock's.
📌I Post Daily SWING CHARTS Analysis on My Trading view profile..
So let's Start
📌TRADE ANALYSIS OF Suprajit
• Potential Breakout Chart
• Symmetrical Triangle Pattern
• Long Range Consolidation
• Price Can Take Retest from support Line
• Overall The Price Is Moving In HH-HL Formation
• Volume Buildup Near BO Zone
• Looks Good For 10-20% Upside Levels After The Breakout
📌 If you have any questions about any stock you can comment on post 📱
📌Disclaimer:-
This all chatrs analysis are only for educational purposes only
I do not provide any CALL or Tips

BREAKOUT IN CMSINFO 📌SWING TRADE FOR NEXT WEEK🚀
Hello Traders⚡
I am a Swing Trader by Passion i only trade on Momentum Stock's.
📌I Post Daily SWING CHARTS Analysis on My Trading view profile..
So let's Start
📌TRADE ANALYSIS OF CMSINFO :-
• Potential Breakout Chart
• Symmetrical Triangle Pattern
• Short Range Consolidation
• Price Can Take Retest from support Line
• Overall The Price Is Moving In HH-HL Formation
• Volume Buildup Near BO Zone
• Looks Good For 10-20% Upside Levels After The Breakout
📌 If you have any questions about any stock you can comment on post 📱
📌Disclaimer:-
This all chatrs analysis are only for educational purposes only
I do not provide any CALL or Tips

Amar Raja Energy & Mob Ltd Analysis!NSE:ARE_M Daily Analysis!
Symmetrical Triangle Pattern formed in $NSE:ARE_M!
Symmetrical Triangle Pattern breakout in $NSE:ARE_M!
RSI Bounced Back from 50 Level
NSE:ARE_M formed a Symmetrical Triangle Pattern on the Daily time-frame. The stock is being in the uptrend by taking support on 50EMA. We can clearly see the breakout to the resistance trend-line with sufficient volume. RSI also bounced back from 50 Level. We can ride the rally with strict stop loss. Last candle has given a breakout we can enter either in the upcoming trading session or after retest. The important levels are on the chart itself, please have a look on it.
Trade Psychology and Setup:
Entry = Current price level is good to enter(865-870)
Target = 1052.15
Stop Loss = 809.90
Disclaimer = All my analysis is for Educational Purposes only.
Before entering into any trade -
1) Educate Yourself
2) Do your research and analysis
3) Define your Risk to Reward ratio
4) Don't trade with full capital

GP Petroleums LTD Analysis!NSE:GULFPETRO Weekly Analysis!
Symmetric Triangle Pattern in NSE:GULFPETRO
Symmetric Triangle Pattern breakout in NSE:GULFPETRO
Golden Crossover in NSE:GULFPETRO
Analysis:
NSE:GULFPETRO has made a clear Symmetric Triangle pattern on weekly time-frame. It is in consolidation since long and gave a breakout with high volume on 29jan. You can also see the golden crossover on the chart where 50 period EMA crossed 200 period EMA from below. Golden crossover is the indication of starting the uptrend . After the breakout price is now retesting the support. If price establishes the support zone between 63-68, it will act like a strong support.
Trade Psychology and Setup:
Entry = Current levels are good for buying(65-70)
Target = Long Term Target 224
Stop Loss = Strict Stop Loss 48.20
Disclaimer = All my analysis is for Educational Purposes only.
Before entering into any trade -
1) Educate Yourself
2) Do your research and analysis
3) Define your Risk to Reward ratio
4) Don't trade with full capital

BREAKOUT IN RAMA STEEL📌SWING TRADE FOR NEXT WEEK🚀
Hello guys,
I am a swing trader by passion i only trade on swing stocks.
📌I post daily SWING CHARTS analysis on my trading view profile..
so let's start
📌TRADE ANALYSIS OF CYIENT DLM :-
•Breakout of symetrical pattern on DTF
•Break counter trend line and hidden lines
•Volume increases last few weeks high
•Bullish trend/ make good structure also
•Made good price action
•Make higher highs/higher lows
📌 If you have any questions about any stock you can comment on post 📱
📌Disclaimer:-
This all chatrs analysis are only for educational purposes only
I do not provide any CALL or Tips

BREAKOUT IN MIDHANI 📌SWING TRADE FOR NEXT WEEK🚀
Hello guys,
I am a swing trader by passion i only trade on swing stocks.
📌I post daily SWING CHARTS analysis on my trading view profile..
so let's start
📌TRADE ANALYSIS OF MIDHANI :-
•Breakout of symetrical pattern on WTF with strong candle
•Break counter trend line and hidden lines
•Volume increases last few weeks high
•Bullish trend/ make good structure also
•Made good price action
•Make higher highs/higher lows
📌 If you have any questions about any stock you can comment on post 📱
📌Disclaimer:-
This all chatrs analysis are only for educational purposes only
I do not provide any CALL or Tips

BREAKOUT IN CYIENT DLM 📌SWING TRADE FOR NEXT WEEK🚀
Hello guys,
I am a swing trader by passion i only trade on swing stocks.
📌I post daily SWING CHARTS analysis on my trading view profile..
so let's start
📌TRADE ANALYSIS OF CYIENT DLM :-
•Breakout of symetrical pattern on DTF
•Break counter trend line and hidden lines
•Volume increases last few weeks high
•Bullish trend/ make good structure also
•Made good price action
•Make higher highs/higher lows
📌 If you have any questions about any stock you can comment on post 📱
📌Disclaimer:-
This all chatrs analysis are only for educational purposes only
I do not provide any CALL or Tips

BREAKOUT IN VINYAL CHEMICAL 📌SWING TRADE FOR NEXT WEEK🚀
Hello guys,
I am a swing trader by passion i only trade on swing stocks.
📌I post daily SWING CHARTS analysis on my trading view profile..
so let's start
📌TRADE ANALYSIS OF VINYL CHEMICALS :-
•Breakout of symetrical pattern on DTF
•Break counter trend line and hidden lines
•Volume increases last few Day's high
•Bullish trend/ make good structure also
•Made good price action
•Make higher highs/higher lows
📌 If you have any questions about any stock you can comment on post 📱
📌Disclaimer:-
This all chatrs analysis are only for educational purposes only
I do not provide any CALL or Tips

BREAKOUT IN CYIENT LTD📌SWING TRADE FOR NEXT WEEK🚀
Hello guys,
I am a swing trader by passion i only trade on swing stocks.
📌I post daily SWING CHARTS analysis on my trading view profile..
so let's start
📌TRADE ANALYSIS OF CYIENT LTD :-
•Breakout of symetrical pattern on DTF with strong candle
•Break counter trend line
•Volume Can Increased
•Bullish trend/ make good structure also
•Made good price action
•Make higher highs/higher lows
📌 If you have any questions about any stock you can comment on post 📱
📌Disclaimer:-
This all chatrs analysis are only for educational purposes only
I do not provide any CALL or Tips
