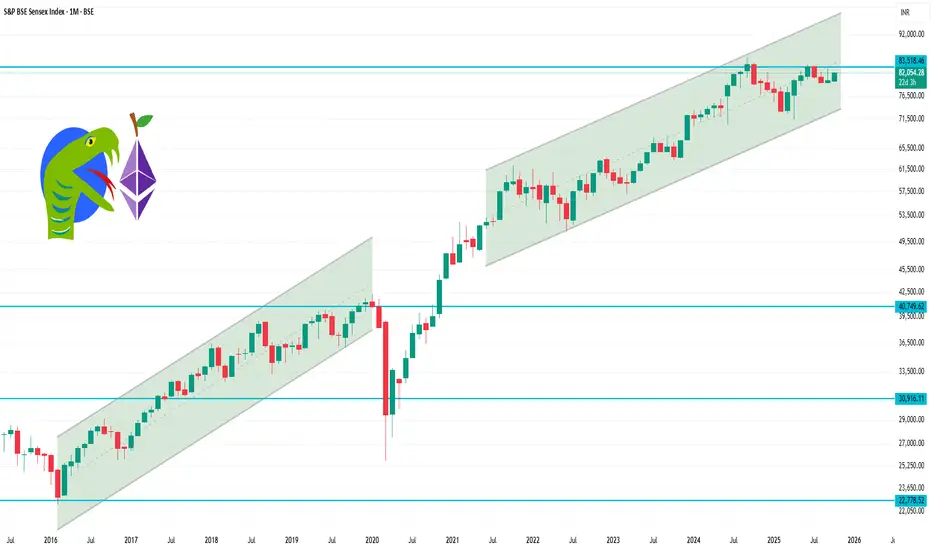
Sensex 1 Month Time Frame 1-Month Performance:
Closing Level: 81,773.66
Change: +1.22%
High: 82,257.74
Low: 81,646.08
52-Week High: 84,099.53
52-Week Low: 71,425.01
Over the past month, the Sensex has experienced a modest upward trend, reaching a high of 82,257.74 and a low of 81,646.08
Tarder
Part 2 Candle Stick Pattern 1. Introduction to Option Trading
In the world of financial markets, traders and investors are constantly looking for ways to maximize returns while managing risks. Beyond the conventional buying and selling of stocks, bonds, or commodities lies the fascinating arena of derivatives. Among derivatives, options stand out as one of the most versatile and widely used financial instruments.
An option is essentially a contract that gives the holder the right, but not the obligation, to buy or sell an underlying asset at a predetermined price before or at a specified expiration date. This flexibility allows traders to hedge risks, speculate on market movements, or design complex strategies to suit different risk appetites.
Option trading is a double-edged sword: it can generate extraordinary profits in a short span but also result in significant losses if misunderstood. Hence, before stepping into this market, it is essential to understand the fundamentals, mechanics, and strategies behind option trading.
2. Basics of Options
To understand option trading, let us first dissect the essential components.
2.1 Call Options
A call option gives the buyer the right, but not the obligation, to buy the underlying asset at a predetermined price (strike price) within a specific period.
If the asset’s price rises above the strike price, the call option holder can buy at a lower price and profit.
If the price falls below the strike, the buyer may let the option expire worthless, losing only the premium paid.
Example: If you buy a call option on Stock A at ₹100 strike and the stock rises to ₹120, you profit by exercising the option or selling it in the market.
2.2 Put Options
A put option gives the buyer the right, but not the obligation, to sell the underlying asset at the strike price before or at expiration.
If the asset price falls below the strike, the put holder benefits.
If it rises above the strike, the option may expire worthless.
Example: If you buy a put option on Stock A at ₹100 and the stock falls to ₹80, you can sell it at ₹100, making a profit.
2.3 Strike Price
The pre-agreed price at which the underlying asset can be bought or sold.
2.4 Premium
The price paid by the option buyer to the seller (writer) for acquiring the option contract. It represents the upfront cost and is influenced by time, volatility, and underlying asset price.
2.5 Expiration Date
Options have a finite life and must be exercised or left to expire on a specific date.
3. Types of Options
Options vary based on style, market, and underlying assets.
American Options – Can be exercised anytime before expiration.
European Options – Can only be exercised on the expiration date.
Equity Options – Based on shares of companies.
Index Options – Based on stock indices like Nifty, S&P 500, etc.
Commodity Options – Based on gold, silver, crude oil, etc.
Currency Options – Based on forex pairs like USD/INR.
4. Participants in Option Trading
Every option trade involves two primary parties:
Option Buyer – Pays the premium, enjoys the right but no obligation.
Option Seller (Writer) – Receives the premium but carries the obligation if the buyer exercises the contract.
The buyer has limited risk (premium paid), but the seller has theoretically unlimited risk and limited profit (premium received).
5. Why Trade Options?
Traders and investors use options for multiple reasons:
Hedging – Protecting existing investments from adverse price moves.
Speculation – Betting on market directions with limited risk.
Income Generation – Writing options to collect premiums.
Leverage – Controlling a large position with a relatively small investment.

Advanced Smart Liquidity Concepts1. Introduction to Smart Liquidity
1.1 Definition of Smart Liquidity
Smart liquidity refers to the portion of market liquidity that is not just available but is efficiently utilized by market participants to execute trades with minimal market impact. Unlike raw liquidity, which measures just the number of shares or contracts available, smart liquidity evaluates:
Accessibility: Can orders be executed efficiently without adverse price movement?
Quality: How stable and reliable is the liquidity at various price levels?
Speed: How quickly can liquidity be accessed and replenished?
1.2 Evolution from Traditional Liquidity Concepts
Traditional liquidity focuses on measurable quantities: order book depth, bid-ask spreads, and trading volume. Smart liquidity incorporates behavioral and strategic aspects of market participants:
Algorithmic awareness: Machines identify and exploit inefficiencies, adjusting liquidity dynamically.
Hidden liquidity: Orders concealed in dark pools or iceberg orders that influence market balance without being visible.
Latency arbitrage impact: The speed advantage of HFT affects liquidity availability and reliability.
2. Drivers of Advanced Smart Liquidity
Smart liquidity is influenced by a complex interplay of market structure, participant behavior, and technological factors:
2.1 Market Microstructure
Order book dynamics: Depth, shape, and resilience of the order book impact how liquidity is absorbed.
Spread dynamics: Tight spreads suggest high-quality liquidity, but may hide fragility if large orders create slippage.
Order flow imbalance: The ratio of aggressive to passive orders indicates how liquidity will move under pressure.
2.2 High-Frequency and Algorithmic Trading
Liquidity provision by HFTs: HFTs continuously place and cancel orders, creating dynamic liquidity pockets.
Quote stuffing and spoofing: Some algorithms distort perceived liquidity temporarily, affecting smart liquidity perception.
Latency arbitrage: Access to faster data feeds allows participants to extract liquidity before it is visible to slower traders.
2.3 Dark Pools and Hidden Liquidity
Iceberg orders: Large orders split into smaller visible slices to reduce market impact.
Alternative trading systems (ATS): These venues offer substantial liquidity without displaying it on public exchanges, contributing to overall market efficiency.
Liquidity fragmentation: The same asset may be available in multiple venues, requiring smart routing to access efficiently.
2.4 Market Sentiment and Behavior
Trader psychology: Fear or greed can amplify or withdraw liquidity, especially during volatility spikes.
News and macro events: Smart liquidity shifts rapidly around earnings, central bank announcements, or geopolitical shocks.
3. Measuring Smart Liquidity
Traditional liquidity measures are insufficient for modern market analysis. Advanced metrics capture both quality and accessibility:
3.1 Market Impact Models
Price impact per trade size: How much the price moves for a given order quantity.
Resilience measurement: How quickly the market recovers after a large trade absorbs liquidity.
3.2 Order Book Metrics
Depth at multiple levels: Not just best bid and ask but the full ladder of price levels.
Order flow toxicity: Probability that incoming orders are informed or likely to move the market against liquidity providers.
3.3 Smart Liquidity Indicators
Liquidity-adjusted volatility: Adjusting volatility estimates based on available liquidity.
Effective spread: Spread accounting for market impact and hidden liquidity.
Liquidity heatmaps: Visual tools highlighting concentration and availability of smart liquidity across price levels and venues.
3.4 Machine Learning for Liquidity Analysis
Predicting liquidity shifts using historical order book data.
Clustering trades by behavior to identify hidden liquidity patterns.
Algorithmic routing optimization to access the most favorable liquidity pools.
4. Strategies Leveraging Smart Liquidity
Advanced smart liquidity concepts are not just analytical—they inform trading strategy, risk management, and execution efficiency.
4.1 Optimal Order Execution
VWAP and TWAP algorithms: Spread large trades over time to minimize market impact.
Liquidity-seeking algorithms: Dynamically route orders to venues with the highest smart liquidity.
Iceberg order strategies: Hide large orders to reduce signaling risk.
4.2 Risk Management Applications
Dynamic hedging: Adjust hedge positions based on real-time smart liquidity availability.
Liquidity-adjusted VaR: Incorporates potential liquidity constraints into risk calculations.
Stress testing: Simulating low liquidity scenarios to measure portfolio vulnerability.
4.3 Arbitrage and Market-Making
Exploiting temporary liquidity imbalances across venues or assets.
Providing liquidity strategically during periods of high spreads to capture rebates and mitigate inventory risk.
Utilizing smart liquidity signals to identify emerging inefficiencies.
5. Smart Liquidity in Volatile Markets
5.1 Liquidity Crises and Flash Events
Flash crashes often occur when apparent liquidity evaporates under stress.
Smart liquidity analysis identifies resilient liquidity versus superficial depth that may disappear under pressure.
5.2 Adaptive Strategies for High Volatility
Dynamic adjustment of execution algorithms.
Use of limit orders versus market orders depending on liquidity conditions.
Monitoring order flow toxicity and liquidity concentration to avoid adverse selection.
6. Technological Innovations Impacting Smart Liquidity
6.1 AI and Machine Learning
Predictive models for liquidity shifts.
Reinforcement learning for adaptive execution strategies.
6.2 Blockchain and Decentralized Finance (DeFi)
Automated market makers (AMMs) provide liquidity continuously with programmable rules.
Smart liquidity pools that dynamically adjust pricing and depth.
6.3 High-Frequency Infrastructure
Co-location and low-latency networking enhance the ability to access liquidity before competitors.
Real-time analytics of fragmented markets for smart routing.
7. Regulatory Considerations
Advanced liquidity management intersects with regulation:
Market manipulation risks: Spoofing, layering, and quote stuffing can misrepresent liquidity.
Best execution obligations: Brokers must seek the highest-quality liquidity for clients.
Transparency vs. privacy: Balancing visible liquidity with hidden orders in regulated venues.
8. Future Directions of Smart Liquidity
Integration of multi-asset liquidity analysis: Evaluating cross-asset and cross-venue liquidity to optimize execution.
AI-driven market-making: Fully autonomous systems that dynamically adjust liquidity provision.
Global liquidity networks: Real-time global liquidity mapping for cross-border trading.
Impact of quantum computing: Potentially enabling instant liquidity analysis at unprecedented speeds.
9. Conclusion
Advanced smart liquidity goes far beyond simple bid-ask spreads or volume metrics. It encompasses quality, accessibility, adaptability, and strategic use of liquidity. In a market dominated by algorithms, high-frequency trading, and fragmented venues, understanding smart liquidity is essential for:
Efficient trade execution
Risk mitigation and stress management
Market-making and arbitrage strategies
Anticipating market behavior in volatile conditions
Future financial markets will increasingly rely on AI-driven liquidity analytics, real-time monitoring, and predictive modeling. Traders and institutions that master smart liquidity will gain a competitive edge in both execution efficiency and risk management.
Part 2 Ride The Big Moves 1. Option Pricing and Valuation
Option prices are determined by two main components:
1.1 Intrinsic Value
The difference between the current price of the underlying asset and the option’s strike price.
1.2 Time Value
The remaining portion of the premium, reflecting time until expiration and volatility. Options with longer time to expiration usually have higher time value.
1.3 Factors Affecting Option Prices
Underlying Asset Price: Movement in the underlying asset directly affects the option’s value.
Strike Price: Determines whether the option is ITM, ATM, or OTM.
Time to Expiration: Longer expiration provides higher flexibility and premium.
Volatility: Higher volatility increases option premiums.
Interest Rates: Rising interest rates can increase call option values and decrease put option values.
Dividends: Expected dividends reduce the value of call options.
1.4 Option Pricing Models
Black-Scholes Model: Widely used for European options, factoring in asset price, strike price, time, volatility, and risk-free rate.
Binomial Model: Flexible and suitable for American options, where early exercise is possible.
2. Risk and Reward in Options Trading
2.1 Risk for Option Buyers
The maximum risk for buyers is limited to the premium paid. If the market moves unfavorably, the option can expire worthless, but the loss cannot exceed the initial investment.
2.2 Risk for Option Sellers (Writers)
Sellers face potentially unlimited risk:
For a call writer without owning the underlying asset (naked call), losses can be infinite if the asset price rises sharply.
For put writers, losses occur if the asset price falls significantly below the strike price.
2.3 Reward Potential
Buyers have unlimited profit potential for calls and substantial profit for puts if the market moves favorably.
Sellers earn the premium as maximum profit, regardless of market movement, assuming they manage positions correctly.
3. Hedging and Speculation Using Options
3.1 Hedging
Options are a powerful tool for risk management. For instance:
Investors holding a stock can buy put options to protect against downside risk.
Traders can use options to lock in profit targets or minimize losses.
3.2 Speculation
Speculators use options to capitalize on market movements with limited capital. Examples:
Buying calls to profit from an anticipated rise.
Buying puts to profit from an anticipated fall.
Using complex strategies to exploit volatility or time decay.
4. Options in Different Markets
4.1 Stock Options
Options on individual stocks are most popular and widely traded. They provide leverage and hedging opportunities.
4.2 Index Options
Options on market indices like Nifty or S&P 500 allow traders to speculate on broader market trends.
4.3 Commodity Options
Used in commodities markets like gold, crude oil, and agricultural products for hedging or speculation.
4.4 Currency Options
Provide protection or speculation opportunities in the forex market against currency fluctuations.

Part 1 Ride The Big MovesWhat is an Option?
An option is a financial contract that gives the buyer the right, but not the obligation, to buy or sell an underlying asset at a predetermined price (called the strike price) on or before a specific date (called the expiry date).
There are two main types of options:
Call Option – Gives the buyer the right to buy the underlying asset.
Put Option – Gives the buyer the right to sell the underlying asset.
Example:
If you buy a call option on stock XYZ with a strike price of ₹500, you can buy the stock at ₹500 even if the market price rises to ₹600.
If you buy a put option on stock XYZ at ₹500, you can sell it at ₹500 even if the market price falls to ₹400.
How Options Work
Call Option Buyer: Expects the price to rise. Pays a premium upfront. Profit = Unlimited (price can rise indefinitely) – Premium paid. Loss = Premium paid (if price falls below strike).
Put Option Buyer: Expects the price to fall. Pays a premium upfront. Profit = Strike – Price (max is strike – 0) – Premium paid. Loss = Premium paid.
Option Seller (Writer): Receives the premium. Takes obligation to buy/sell if the buyer exercises. Risk = Can be unlimited for call sellers.
Factors Affecting Option Prices (Option Greeks)
Option price is influenced by:
Delta (Δ) – How much the option price moves with a 1-point move in underlying.
Gamma (Γ) – How fast delta changes with underlying price.
Theta (Θ) – Time decay; how much value the option loses each day.
Vega (V) – Sensitivity to volatility in the underlying asset.
Rho (ρ) – Sensitivity to interest rates.
Tip: Time decay is crucial – options lose value as expiry approaches if the underlying doesn’t move favorably.

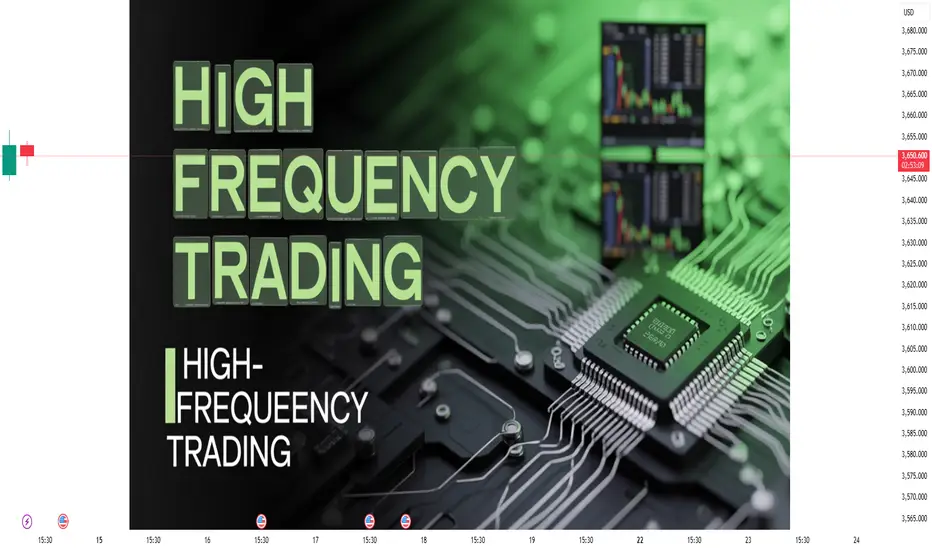
High-Frequency Trading (HFT)1. Introduction to High-Frequency Trading
High-Frequency Trading, commonly known as HFT, is one of the most fascinating and controversial developments in modern financial markets. It refers to the use of advanced algorithms, ultra-fast computers, and high-speed data networks to execute thousands of trades in fractions of a second. Unlike traditional traders who might hold a stock for days, weeks, or months, HFT firms often hold positions for mere milliseconds to seconds before closing them.
The goal is simple yet complex: exploit tiny price inefficiencies across markets repeatedly, so that the small profits from each trade accumulate into large gains. HFT thrives on speed, volume, and precision.
In the 21st century, HFT has transformed how global markets function. Estimates suggest that 50–60% of equity trading volume in the US and nearly 40% in Europe is driven by HFT. It has created a financial arms race where firms spend millions to shave microseconds off trade execution time.
But while some argue HFT improves liquidity and efficiency, others see it as an unfair advantage that destabilizes markets. To understand this debate, we must first trace how HFT evolved.
2. Historical Evolution of HFT
a) Early Trading Days
Before computers, trading was conducted by human brokers shouting orders on exchange floors. Trades took minutes, sometimes hours, to process. Speed wasn’t the focus; information and relationships were.
b) Rise of Electronic Trading (1970s–1990s)
The introduction of NASDAQ in 1971, the first electronic stock exchange, was the seed for automated trading.
By the late 1980s, program trading became popular: computer systems executed pre-defined buy/sell orders.
Regulatory changes like SEC’s Regulation ATS (1998) enabled Alternative Trading Systems (ATS), such as electronic communication networks (ECNs).
c) Birth of High-Frequency Trading (2000s)
With the spread of broadband internet and decimalization (2001) of stock quotes (moving from 1/16th to 1 cent spreads), markets became tighter and more suitable for HFT.
By mid-2000s, firms like Citadel, Jump Trading, and Renaissance Technologies began developing advanced algorithms.
In 2005, Regulation NMS in the US required brokers to offer clients the best available prices, which fueled arbitrage-based HFT.
d) The HFT Boom (2007–2010)
Ultra-low latency networks allowed HFT firms to trade in microseconds.
During this period, HFT profits peaked at $5 billion annually in the US.
e) Modern Era (2010–Present)
Post the 2010 Flash Crash, regulators imposed stricter monitoring.
Now, HFT is more competitive, with shrinking spreads and lower profitability. Only the largest firms with cutting-edge infrastructure dominate.
3. Core Principles and Mechanics of HFT
At its core, HFT relies on three fundamental pillars:
Speed – Faster data processing and trade execution than competitors.
Volume – Executing thousands to millions of trades daily.
Automation – Fully algorithm-driven, with minimal human intervention.
How HFT Works Step by Step:
Market Data Collection – Systems capture live market feeds from multiple exchanges.
Signal Processing – Algorithms identify potential opportunities (like arbitrage or momentum).
Order Placement – Orders are executed within microseconds.
Risk Control – Automated systems constantly monitor exposure.
Order Cancellation – A hallmark of HFT is rapid order cancellation; more than 90% of orders are canceled before execution.
In short, HFT is about being faster and smarter than everyone else in spotting and exploiting price inefficiencies.
4. Technology & Infrastructure Behind HFT
HFT is as much about technology as finance.
Colocation: HFT firms place their servers next to exchange servers to minimize latency.
Microwave & Laser Networks: Some firms use microwave towers or laser beams (instead of fiber optic cables) to send signals faster between cities like Chicago and New York.
Custom Hardware: Use of Field-Programmable Gate Arrays (FPGAs) and specialized chips for ultra-fast execution.
Algorithms: Written in low-level programming languages (C++, Java, Python) optimized for speed.
Data Feeds: Direct market data feeds from exchanges, often costing millions annually.
Without such infrastructure, competing in HFT is impossible.
5. Types of HFT Strategies
HFT isn’t a single strategy—it’s a family of approaches.
a) Market Making
Continuously posting buy and sell quotes.
Profit from the bid-ask spread.
Provides liquidity but withdraws during stress, creating volatility.
b) Arbitrage Strategies
Statistical Arbitrage: Exploiting short-term mispricings between correlated assets.
Index Arbitrage: Spotting mismatches between index futures and constituent stocks.
Cross-Exchange Arbitrage: Exploiting price differences across exchanges.
c) Momentum Ignition
Algorithms try to trigger price moves by quickly buying/selling and then profiting from the resulting momentum.
d) Event Arbitrage
Trading news or events (earnings releases, economic data) milliseconds after release.
e) Latency Arbitrage
Profiting from speed advantage when market data is updated at different times across venues.
f) Quote Stuffing (controversial)
Sending massive orders to overload competitors’ systems, then exploiting the delay.
6. Benefits of HFT
Despite criticisms, HFT provides several market benefits:
Liquidity Provision – Ensures continuous buy/sell availability.
Tighter Spreads – Reduced transaction costs for investors.
Market Efficiency – Prices reflect information faster.
Arbitrage Reductions – Eliminates mispricings across markets.
Automation & Innovation – Pushes markets toward modernization.
7. Risks, Criticisms, and Controversies
HFT has a darker side.
Market Volatility – Sudden liquidity withdrawals can trigger flash crashes.
Unfair Advantage – Retail and institutional investors can’t compete on speed.
Order Spoofing & Manipulation – Some HFT tactics border on illegal.
Systemic Risk – Reliance on algorithms may cause chain reactions.
Resource Arms Race – Billions spent on infrastructure only benefit a few.
The 2010 Flash Crash
On May 6, 2010, the Dow Jones plunged nearly 1,000 points in minutes, partly due to HFT feedback loops. Although the market recovered quickly, it exposed the fragility of algorithm-driven markets.
8. Regulation & Global Perspectives
Regulators worldwide are struggling to balance innovation with fairness.
US: SEC and CFTC monitor HFT. Rules like Reg NMS and circuit breakers have been introduced.
Europe: MiFID II (2018) tightened reporting, increased transparency, and mandated testing of algorithms.
India: SEBI regulates algo trading; discussions about limiting co-location privileges exist.
China: More restrictive, cautious approach.
Overall, regulators want to prevent manipulation while preserving liquidity benefits.
Conclusion
High-Frequency Trading is both a marvel of technology and a challenge for market fairness. It epitomizes the arms race between human ingenuity and machine speed. While HFT undoubtedly improves liquidity and market efficiency, it also introduces systemic risks that cannot be ignored.
As markets evolve, so will HFT—pushed forward by AI, quantum computing, and global competition. For traders, investors, and policymakers, understanding HFT isn’t just about finance—it’s about the intersection of technology, economics, and ethics in the digital age of markets.
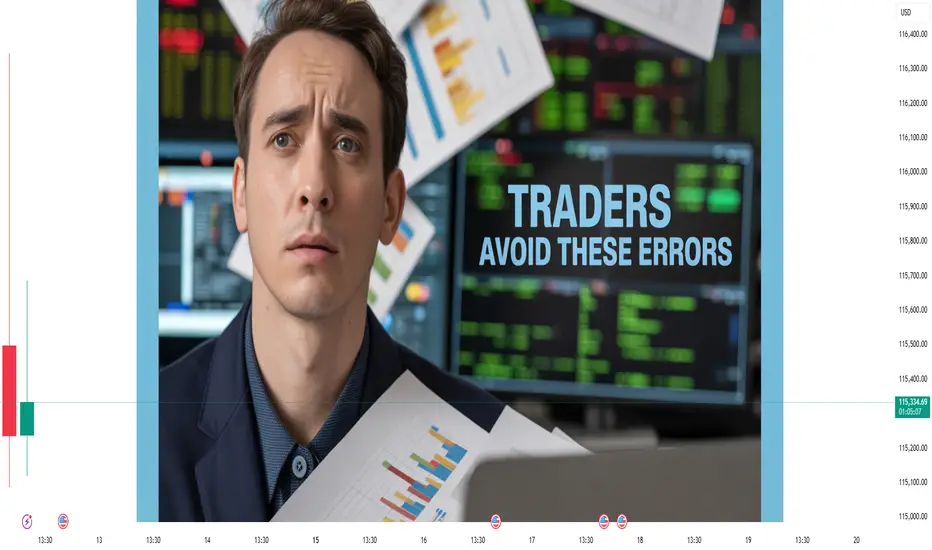
Trading Errors That Separate Winners from Losers1. Lack of a Trading Plan
One of the most glaring differences between winning and losing traders is the presence—or absence—of a clear trading plan.
Winners: Enter the market with a plan that covers entry criteria, exit points, risk tolerance, and position sizing. They know exactly why they are entering a trade and under what conditions they will exit, win or lose.
Losers: Trade impulsively, often chasing tips, reacting to news, or “winging it” based on emotions. Without predefined rules, they rely on hope and gut feelings, which are inconsistent and unreliable.
Think of it like driving without a destination or map—you may move, but you’re likely to get lost. Trading without a plan is essentially gambling.
2. Ignoring Risk Management
Risk management is often called the “holy grail” of trading. It is not glamorous, but it determines survival.
Winners: Risk only a small portion of their capital on each trade (often 1–2%). They use stop-loss orders, hedge positions, and understand the risk-reward ratio before entering a trade. They think in probabilities and know that protecting capital is more important than chasing quick gains.
Losers: Risk far too much on a single trade, sometimes even their entire account. They move stop-loss levels farther to avoid taking a small loss, only to suffer a devastating one later. A few bad trades can wipe out months or years of effort.
A classic rule says: “Take care of the downside, and the upside will take care of itself.” Winners live by this; losers ignore it.
3. Overtrading
Overtrading is one of the most common traps for beginners.
Winners: Understand that patience pays. They wait for high-probability setups, sometimes taking just a handful of trades in a week or month. They trade less, but smarter.
Losers: Feel the need to be in the market constantly. They confuse activity with productivity, opening positions based on boredom, fear of missing out (FOMO), or the illusion that “more trades = more profit.”
Overtrading not only increases transaction costs but also magnifies exposure to emotional mistakes.
4. Emotional Decision-Making
Markets are emotional arenas, and controlling psychology is as important as technical skill.
Winners: Maintain discipline and detach emotionally from trades. They accept losses as part of the business and move on without revenge-trading.
Losers: Allow fear, greed, hope, or frustration to dictate their moves. A small loss triggers panic. A big win creates overconfidence, leading to reckless bets. They chase losses, double down, or refuse to cut losers, turning manageable mistakes into disasters.
The famous trader Paul Tudor Jones once said: “Losers average losers.” This reflects the emotional trap of holding on to bad trades instead of accepting defeat.
5. Lack of Education and Preparation
Trading looks deceptively simple. Charts, news, and platforms are accessible to anyone. But without a strong foundation, losses are inevitable.
Winners: Invest time in education, study market structure, read books, analyze charts, and even backtest strategies. They treat trading as a profession, not a hobby.
Losers: Jump into markets unprepared, lured by promises of quick riches. They copy strategies without understanding them, rely on social media tips, or trade based on rumors.
In any competitive field—sports, medicine, law—training is essential. Trading is no different. Lack of preparation ensures failure.
6. Failure to Adapt
Markets are dynamic. What works today may not work tomorrow.
Winners: Adapt strategies to evolving conditions. If volatility rises, they adjust position sizing. If market structure changes, they reevaluate systems. They are flexible, constantly learning and evolving.
Losers: Stick rigidly to outdated methods or strategies, even when evidence shows they no longer work. They resist change, hoping markets will return to conditions where their strategy worked.
Adaptability is survival. Dinosaurs didn’t adapt and went extinct. Traders who fail to adapt face the same fate.
7. Neglecting the Importance of Psychology
Many traders focus only on technical indicators or news but ignore the psychology of trading.
Winners: Develop strong mental frameworks—discipline, patience, resilience. They understand cognitive biases like loss aversion, confirmation bias, and recency bias, and work to minimize their impact.
Losers: Are controlled by psychological traps. They believe they’re always right, seek only confirming evidence, and fear taking losses. This mindset sabotages even good strategies.
Trading is 80% psychology and 20% technique. Those who underestimate this imbalance often lose.
8. Unrealistic Expectations
Another error that separates losers from winners is expectation management.
Winners: Aim for consistent returns, not overnight riches. They understand compounding and set achievable goals. For them, trading is a marathon, not a sprint.
Losers: Expect to double their money every week, quit jobs overnight, or become millionaires in months. Such expectations lead to overleveraging, impulsive trades, and eventual ruin.
The harsh truth: trading is not a get-rich-quick scheme. Those who see it that way rarely last.
9. Ignoring Journal Keeping and Review
One of the simplest but most powerful tools in trading is a trading journal.
Winners: Keep detailed records of trades, including entry/exit, reasoning, emotions, and outcomes. They review mistakes, identify patterns, and refine strategies.
Losers: Don’t track trades. They forget mistakes, repeat them, and fail to see patterns of error.
Reviewing a journal is like a coach analyzing a game replay—it highlights strengths and weaknesses that cannot be seen in the heat of the moment.
10. Misuse of Leverage
Leverage magnifies both gains and losses.
Winners: Use leverage cautiously, only when setups are highly favorable. They ensure their accounts can handle drawdowns without panic.
Losers: Abuse leverage, turning small moves against them into catastrophic losses. They view leverage as a shortcut to quick profits, forgetting it’s a double-edged sword.
Many traders don’t fail because they are wrong, but because they are overleveraged when wrong.
11. Blindly Following Others
In today’s world, tips, social media, and chat groups flood traders with “advice.”
Winners: May listen to others but always do their own research before acting. They know that ultimately, their money is their responsibility.
Losers: Follow every tip or influencer without analysis. They jump on hype-driven moves, often buying at tops and selling at bottoms.
The herd mentality is strong in markets, but as Warren Buffett says: “Be fearful when others are greedy, and greedy when others are fearful.”
12. Lack of Patience and Discipline
Trading rewards patience and punishes impatience.
Winners: Can wait days or weeks for a setup that matches their rules. They avoid shortcuts and stick to discipline.
Losers: Want instant results. They break rules, enter trades prematurely, and exit too early out of fear.
Impatience turns strategy into chaos. Discipline turns chaos into consistency.
Conclusion: Turning Errors into Edges
The line between winning and losing traders isn’t about intelligence, luck, or even access to capital. It’s about behavior, discipline, and error management. Winners aren’t error-free—they simply make fewer critical mistakes and learn from every one. Losers repeat the same destructive errors until their capital or confidence runs out.
To move from losing to winning:
Create and follow a trading plan.
Prioritize risk management over profit.
Develop patience, discipline, and emotional control.
Treat trading as a profession—study, practice, and adapt.
Journal and review trades consistently.
The markets will always test you. But by avoiding these errors, you’ll stand among the minority who consistently extract profits rather than donate them.
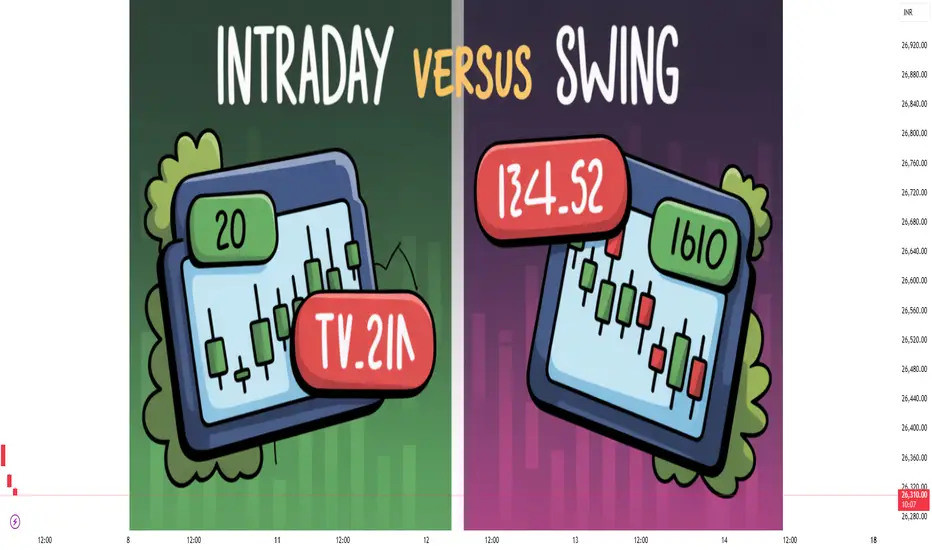
Intraday vs Swing1. Introduction
In the world of trading, there are various styles and timeframes that traders use to profit from market movements. Two of the most popular methods are Intraday Trading and Swing Trading. Each has its unique characteristics, advantages, disadvantages, and psychological demands. Understanding the difference between these two styles is essential for new and experienced traders alike.
2. What is Intraday Trading?
Intraday Trading, also known as Day Trading, involves buying and selling financial instruments within the same trading day. Traders do not carry positions overnight. The goal is to capitalize on small price movements during the trading session.
Key Characteristics:
Positions are opened and closed on the same day.
High frequency of trades.
Focus on liquidity and volatility.
Typically uses 1-minute to 15-minute charts.
Heavy reliance on technical analysis.
3. What is Swing Trading?
Swing Trading is a medium-term trading strategy where traders hold positions for several days to weeks. The aim is to capture “swings” or trends in the market.
Key Characteristics:
Trades last from a few days to several weeks.
Lower frequency of trades.
Emphasizes trend and pattern analysis.
Uses 4-hour to daily or weekly charts.
Combination of technical and fundamental analysis.
4. Tools and Indicators Used
Intraday Trading Tools:
Timeframes: 1-min, 5-min, 15-min, 30-min.
Indicators:
Moving Averages (9, 20, 50 EMA)
VWAP (Volume Weighted Average Price)
RSI, MACD, Stochastic Oscillator
Bollinger Bands
Pivot Points
Scanners: For volume spikes, breakouts.
Level 2 Data, Order Flow, Volume Profile
Swing Trading Tools:
Timeframes: 4-hour, Daily, Weekly
Indicators:
Moving Averages (50, 100, 200 SMA)
RSI, MACD
Fibonacci Retracement
Trendlines and Channels
Candlestick Patterns
News & Fundamentals: Earnings, macro data, interest rates, etc.
5. Strategy Types
Intraday Trading Strategies:
Scalping: Dozens of trades for small profits.
Momentum Trading: Riding strong intraday moves.
Breakout Trading: Entering when price breaks key levels.
Reversal Trading: Betting on pullbacks or trend reversals.
VWAP Strategy: Buying near VWAP on bullish days.
Swing Trading Strategies:
Trend Following: Entering in the direction of the main trend.
Pullback Trading: Buying dips in an uptrend.
Breakout Swing: Holding after breakout of key levels.
Range Trading: Buying at support, selling at resistance.
Fibonacci or EMA Bounce: Waiting for retracements.
6. Time Commitment
Intraday Trading:
Requires full-time focus.
Traders monitor markets from open to close.
Not suitable for people with day jobs or time constraints.
Swing Trading:
Requires less screen time.
Can be done part-time.
Suitable for people with other commitments.
7. Risk and Reward
Intraday Trading:
High potential reward but also high risk.
Requires tight stop-loss.
Leverage often used, magnifying gains/losses.
Small profits per trade, but frequent trades.
Swing Trading:
Lower stress, less noise.
Wider stop-loss but higher per-trade reward.
Leverage optional.
Focus on bigger market moves.
8. Capital Requirements
Intraday Trading:
In India, brokers often require minimum margin for intraday trades.
High leverage is common, increasing capital efficiency.
But strict SEBI regulations limit retail leverage.
Swing Trading:
Requires full margin or delivery-based capital.
No leverage or overnight positions allowed for small traders without risk.
9. Psychological Factors
Intraday Trading:
Emotionally intense.
Traders need to make split-second decisions.
Stressful due to fast movements and high stakes.
Risk of overtrading, revenge trading, and burnout.
Swing Trading:
Less stress, more time to think and plan.
Can handle drawdowns and fluctuations better.
Still requires discipline and emotional control.
10. Pros and Cons
Intraday Trading:
Pros:
No overnight risk (gap-up or gap-down).
Daily income potential.
Rapid compounding for skilled traders.
More trading opportunities.
Cons:
Requires constant attention.
High emotional and mental pressure.
Brokerage, slippage, and taxes eat into profit.
Difficult for beginners.
Swing Trading:
Pros:
Less time-consuming.
Allows thorough analysis.
Potential for higher risk-reward trades.
Suitable for people with jobs or businesses.
Cons:
Overnight risk.
Slower capital turnover.
Requires patience.
May miss out on short-term opportunities.
Conclusion
The choice between Intraday Trading and Swing Trading depends on your:
Time availability
Risk appetite
Capital
Psychological strength
Market experience
Neither is "better"—each has its pros and cons. The best traders understand their own personality and choose (or combine) styles that fit their strengths.
NIFTY AND BANK NIFTY LEVELS FOR 8th NOVThis channel provides Nifty and Bank Nifty analysis and provides swing trades for equity.
The channel is also a provider of technical knowledge on technical analysis.
This is merely a recommendation channel, so please do your own analysis as I am not a SEBI registered analyst.
Please support the channel by liking, sharing and subscribing.
Regards
Maverick Trader
#maverick #trader #mavericktrader #india #nse #bse #stock #markets #stockmarkets #trading #investment #nifty #banknifty #bank

Channel Breakout - MothersumiChannel breakout in Mothersumi. Looks good at cmp for swing trade SL : 218

MANAPPURAM trading levels for 01.02.201levels mentioned in the chart.
postive result published.expecting result based movements.
watch it this weeek.
