Part 7 Trading Master Class Why Traders Use Options
1. Hedging
Investors use options to protect their portfolios from downside risk.
Example: Buying a put option acts like insurance.
2. Speculation
Options allow traders to take directional bets with limited capital.
3. Income Generation
Selling options (covered calls, cash-secured puts) generates regular income through premium collection.
4. Leverage
Options enable traders to control large positions with small capital.
Tarders

Part 11 Trading Master ClassOptions in the Indian Market Context
In India, options trading primarily occurs on the NSE (National Stock Exchange) and BSE (Bombay Stock Exchange), with indices like Nifty and Bank Nifty being the most traded. Contracts have standardized expiry dates—usually the last Thursday of every month. SEBI regulates the derivatives market to ensure transparency and investor protection. Retail participation has surged due to increased awareness and technology-driven platforms. However, many new traders underestimate risks, leading to losses. Understanding margin requirements, taxation rules, and market psychology is essential for long-term success in the Indian derivatives landscape.

Part 7 Trading Master Class Understanding Option Premium and Its Factors
The option premium is the price a trader pays to buy an option. It consists of two parts — intrinsic value and time value.
Intrinsic Value is the difference between the current price of the underlying asset and the strike price. For example, if a stock trades at ₹110 and the call strike is ₹100, the intrinsic value is ₹10.
Time Value reflects the potential for the option to gain more value before expiry. The longer the time to expiry and the higher the volatility, the greater the time value.
As expiry nears, time value decreases — a phenomenon known as time decay (theta). Understanding how premium behaves helps traders make better entry and exit decisions.

Advanced Trading Methods: Mastering Modern Market Strategies1. The Foundation of Advanced Trading
Before diving into the methods, it’s essential to understand what makes a trading approach “advanced.” Advanced trading involves:
Complex analytical frameworks: Using mathematical and statistical models to identify opportunities.
Data-driven decision-making: Reliance on historical and real-time market data.
Algorithmic execution: Automating trades for efficiency and precision.
Risk-adjusted performance: Focusing on consistent, sustainable returns rather than speculative profits.
Behavioral mastery: Understanding and managing human emotions and biases.
An advanced trader combines multiple dimensions — strategy, analysis, risk management, and psychology — into a cohesive trading system.
2. Algorithmic and Quantitative Trading
a. Algorithmic Trading
Algorithmic trading (or “algo trading”) uses computer programs to automatically execute trades based on predefined criteria such as price, volume, and timing. Algorithms help eliminate emotional bias and execute trades faster than human capability.
Key types of algorithmic strategies:
Trend-following algorithms: Identify momentum patterns using moving averages or breakouts.
Mean reversion algorithms: Assume prices will revert to historical averages after deviations.
Arbitrage strategies: Exploit temporary price differences between related instruments.
Market-making algorithms: Provide liquidity by continuously quoting buy and sell prices.
Statistical arbitrage: Use statistical models to detect short-term mispricings between correlated assets.
Algorithmic trading dominates global market volumes, with institutions using complex systems that analyze thousands of data points in milliseconds.
b. Quantitative Trading
Quantitative (quant) trading relies on mathematical modeling and statistical analysis to forecast price movements. Quant traders design models that identify high-probability trade setups.
Quantitative models include:
Factor models: Evaluate stocks based on fundamental factors like earnings, growth, or volatility.
Machine learning models: Use AI to detect nonlinear relationships in large datasets.
Time-series models: Predict future price movements from historical trends using ARIMA, GARCH, or Kalman filters.
Quantitative trading requires programming knowledge (Python, R, MATLAB) and a strong grasp of probability, calculus, and econometrics.
3. Technical Mastery: Advanced Charting and Indicators
a. Multi-Time Frame Analysis
Professional traders analyze price behavior across multiple time frames to align long-term trends with short-term setups. For instance, a trader may confirm an uptrend on the weekly chart and then enter trades on the 1-hour chart to optimize timing.
b. Advanced Indicators
Ichimoku Cloud: Combines support, resistance, and momentum in one view.
Volume Profile: Analyzes traded volume at each price level to identify high-liquidity zones.
Fibonacci Extensions: Predict potential price targets during strong trends.
Bollinger Band Width: Measures volatility expansion or contraction phases.
Average True Range (ATR): Quantifies market volatility for dynamic stop-loss placement.
c. Harmonic Patterns and Elliott Wave Theory
Advanced traders often use harmonic patterns (like Gartley, Bat, and Butterfly) to identify high-probability reversal zones based on Fibonacci ratios. Similarly, Elliott Wave Theory interprets market psychology through wave structures, forecasting long-term cycles of optimism and pessimism.
4. Price Action and Market Structure
While indicators are helpful, many professional traders rely heavily on price action — pure price movement without lagging indicators.
Key components include:
Supply and Demand Zones: Identify institutional order blocks where price reacts strongly.
Liquidity Pools: Areas where stop-losses cluster, often targeted by large players.
Break of Structure (BOS): A shift in market trend confirmed by price breaking a significant high or low.
Order Flow Analysis: Uses volume and bid-ask data to visualize market participant behavior.
By mastering market structure, traders can anticipate institutional activity instead of reacting to it.
5. Derivative-Based Trading Methods
Advanced traders frequently use derivatives — such as options, futures, and swaps — to manage risk and enhance returns.
a. Options Trading
Options offer strategic flexibility through structures like:
Delta-neutral strategies: Profiting from volatility (e.g., straddles, strangles).
Spreads: Combining multiple options to manage directional exposure and cost.
Covered Calls and Protective Puts: Hedging long-term investments.
b. Futures and Hedging
Futures allow traders to speculate on or hedge against price movements in commodities, indices, and currencies. Advanced traders manage leverage, margin requirements, and roll-over costs to maintain efficient positions.
c. Volatility Trading
Volatility is an asset in itself. Advanced traders use instruments like the VIX index, volatility ETFs, or implied volatility analysis to construct trades that profit from market uncertainty.
6. Statistical and Probabilistic Methods
Trading success depends on probability, not certainty. Advanced traders apply statistical techniques to quantify and manage uncertainty.
Core techniques include:
Monte Carlo simulations: Model potential trade outcomes over thousands of iterations.
Backtesting: Testing strategies on historical data to evaluate robustness.
Optimization and curve fitting: Fine-tuning parameters without overfitting.
Risk-reward ratio and expectancy: Measuring expected profit per trade over time.
Sharpe and Sortino ratios: Evaluating risk-adjusted returns.
Probability-based thinking helps traders focus on edge and consistency rather than outcome-driven emotions.
7. Automated Trading and Artificial Intelligence
AI-driven trading is the frontier of modern finance. Machine learning models can adapt and learn from new data, identifying patterns human traders might miss.
Applications of AI in trading:
Natural Language Processing (NLP): Analyzing news sentiment and social media for market signals.
Reinforcement learning: Algorithms that self-improve through simulated environments.
Neural networks: Detecting nonlinear price relationships and predicting future volatility.
Robo-advisors: Automated portfolio management systems optimizing asset allocation.
AI allows for dynamic, adaptive systems that continuously refine themselves based on performance metrics.
8. Risk Management and Position Sizing
Even the best strategy fails without proper risk control. Advanced traders use sophisticated models to preserve capital.
Risk control techniques include:
Value at Risk (VaR): Estimates potential loss under normal conditions.
Kelly Criterion: Determines optimal bet size to maximize long-term growth.
Drawdown control: Limiting capital losses through daily, weekly, or cumulative limits.
Diversification and correlation analysis: Reducing systemic risk by balancing asset exposure.
Position sizing based on volatility, confidence level, and account equity ensures consistent performance and psychological stability.
9. Behavioral Finance and Trading Psychology
Human emotions — fear, greed, overconfidence, and loss aversion — are the greatest obstacles to advanced trading success.
Advanced traders master:
Cognitive discipline: Following systems regardless of emotional impulses.
Journaling: Tracking trades to analyze patterns and improve decision-making.
Mindfulness and focus: Maintaining calm under market pressure.
Probabilistic mindset: Accepting uncertainty as part of the process.
Professional performance depends not only on technical skill but also on emotional intelligence and mental resilience.
10. Global and Macro Trading Approaches
Global markets are interconnected — interest rates, currency movements, and geopolitical events all impact prices. Advanced traders use macro trading strategies to exploit these relationships.
Examples include:
Interest rate arbitrage: Trading based on central bank policy differentials.
Currency carry trade: Borrowing in low-interest currencies to invest in high-yield ones.
Commodities and inflation plays: Using gold or oil to hedge against inflationary trends.
Intermarket analysis: Studying how equities, bonds, and commodities influence each other.
A strong understanding of macroeconomics enhances timing, positioning, and portfolio management across global markets.
11. Portfolio Construction and Risk Parity
Advanced traders think beyond individual trades — they manage portfolios as integrated ecosystems.
Modern portfolio techniques include:
Risk parity models: Allocating capital based on volatility rather than nominal value.
Dynamic rebalancing: Adjusting exposure as market conditions evolve.
Correlation clustering: Ensuring diversification across uncorrelated assets.
Performance attribution: Measuring which strategies contribute most to returns.
This systematic approach maximizes risk-adjusted growth over the long term.
12. The Role of Technology and Infrastructure
Modern trading success depends on robust infrastructure.
Advanced tools include:
Low-latency servers for high-frequency execution.
API integrations for data feeds and brokerage automation.
Backtesting platforms such as QuantConnect or MetaTrader.
Data visualization tools like Tableau or Python dashboards.
Access to real-time data, high-quality execution, and cloud-based analytics transforms strategy into actionable performance.
13. Continuous Learning and Strategy Evolution
Markets evolve — and so must traders. The best professionals constantly refine their systems.
Steps to long-term mastery:
Research: Stay updated with financial innovation and emerging technologies.
Experimentation: Test new strategies under controlled environments.
Mentorship and community: Learn from experienced traders and data scientists.
Performance review: Regularly evaluate metrics and adapt.
Trading is a lifelong pursuit of improvement and adaptation.
Conclusion
Advanced trading is not about complexity for its own sake — it’s about building a structured, data-driven, risk-managed, and psychologically stable approach to the markets. The journey from intermediate to advanced trader involves mastering the synergy between technology, analysis, and human behavior.
By combining algorithmic precision, quantitative modeling, disciplined psychology, and continuous learning, traders can transform their craft into a professional, scalable, and sustainable enterprise.
In the modern financial landscape, knowledge truly is the most powerful form of capital — and advanced trading methods are the foundation upon which lasting success is built.
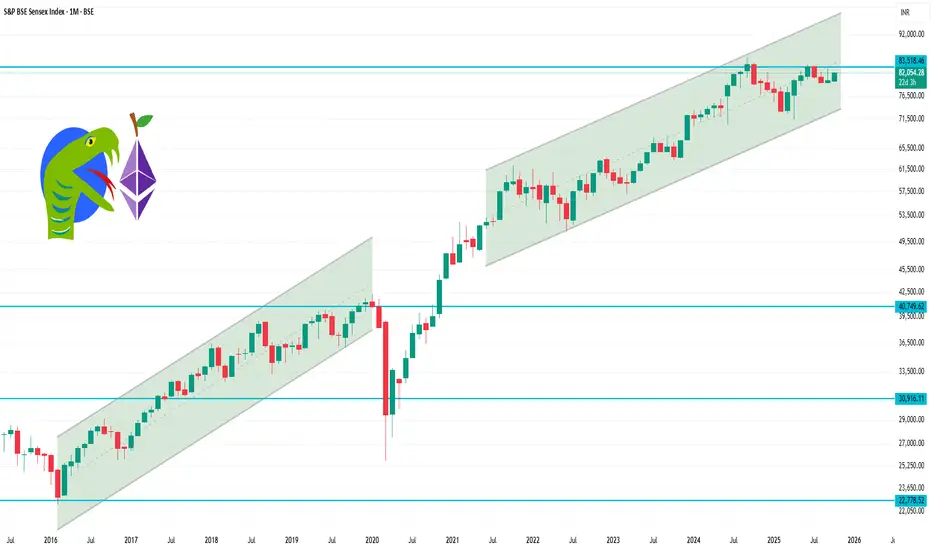
Sensex 1 Month Time Frame 1-Month Performance:
Closing Level: 81,773.66
Change: +1.22%
High: 82,257.74
Low: 81,646.08
52-Week High: 84,099.53
52-Week Low: 71,425.01
Over the past month, the Sensex has experienced a modest upward trend, reaching a high of 82,257.74 and a low of 81,646.08
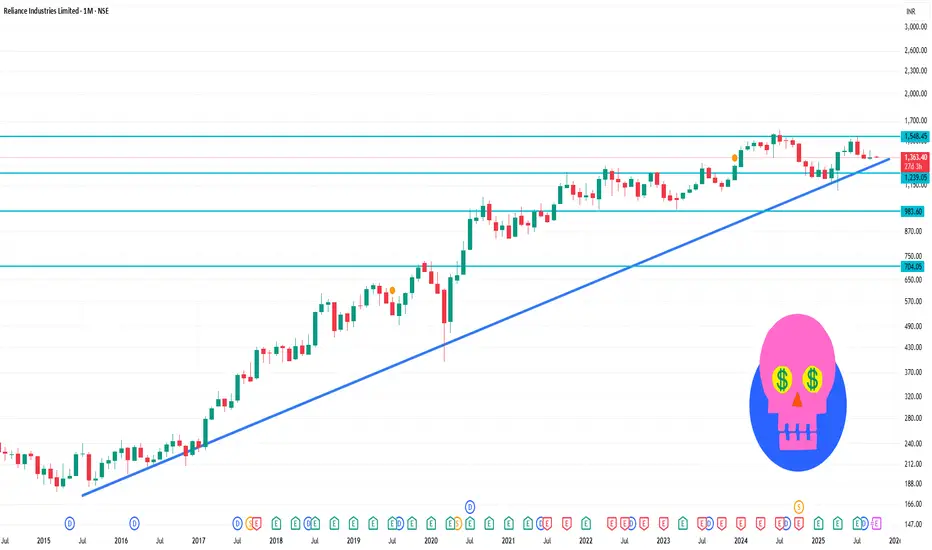
RELIANCE 1 Month Time Frame 📊 Monthly Pivot Levels (Standard)
Pivot Point: ₹1,375.53
Support Levels:
S1: ₹1,329.07
S2: ₹1,294.13
S3: ₹1,247.67
Resistance Levels:
R1: ₹1,410.47
R2: ₹1,456.93
R3: ₹1,491.87
These levels are derived from standard pivot point calculations, which are commonly used to identify potential support and resistance zones.
🔄 Technical Indicators Overview
Relative Strength Index (RSI): Approximately 41.5, indicating a neutral to slightly bearish condition.
Moving Averages: The stock is trading below its 50-day and 200-day moving averages, suggesting a bearish trend.
MACD: Currently negative, reinforcing the bearish momentum.
Trading Master Class With ExpertsPart 1: Introduction to Option Trading
Options are financial derivatives that derive their value from an underlying asset such as stocks, indices, commodities, or currencies. Unlike shares, buying an option doesn’t mean you own the asset—it gives you the right but not the obligation to buy or sell the asset at a pre-agreed price within a set period. This flexibility makes options a powerful tool for hedging, speculation, and income generation.
Part 2: What is a Derivative?
A derivative is a financial contract whose value depends on another asset. Futures and options are the two most popular derivatives. While futures require you to buy/sell at expiry, options give you the choice. This “choice” is what makes them unique—and sometimes tricky.
Part 3: The Two Types of Options
Call Option – Gives the buyer the right to buy an asset at a fixed price (strike price).
Example: If you buy a call option of Reliance at ₹2500, and the stock moves to ₹2600, you can still buy it at ₹2500.
Put Option – Gives the buyer the right to sell an asset at a fixed price.
Example: If you buy a put option at ₹2500 and the stock falls to ₹2400, you can still sell it at ₹2500.
Part 4: Key Terminologies
Strike Price – The pre-decided price of buying/selling.
Premium – The cost paid to buy the option.
Expiry Date – The last date till which the option is valid.
In-the-Money (ITM) – Option has intrinsic value.
Out-of-the-Money (OTM) – Option has no intrinsic value.
At-the-Money (ATM) – Strike price is close to market price.
Part 5: Call Option in Detail
A call option is ideal if you expect the price of an asset to rise. Buyers risk only the premium paid, while sellers (writers) can face unlimited losses if prices rise sharply. Traders often buy calls for bullish bets and sell calls to earn premium income.
Part 6: Put Option in Detail
A put option is profitable when asset prices fall. Buyers of puts use them for protection against a market crash, while sellers hope prices won’t fall so they can pocket the premium. Investors holding stocks often buy puts as insurance against downside risk.
Part 7: How Option Premium is Priced
Option premium = Intrinsic Value + Time Value
Intrinsic Value: Actual value (e.g., if Reliance is ₹2600 and strike is ₹2500, intrinsic = ₹100).
Time Value: Extra cost traders pay for the possibility of favorable movement before expiry.
Pricing is also influenced by volatility, interest rates, and dividends.
Part 8: The Greeks in Options
The Greeks measure option sensitivity:
Delta – Measures how much option price moves for a ₹1 move in stock.
Gamma – Measures how delta changes with stock movement.
Theta – Measures time decay (options lose value as expiry approaches).
Vega – Measures sensitivity to volatility.
Rho – Measures sensitivity to interest rates.
Part 9: Why Traders Use Options
Options are versatile. Traders use them to:
Speculate on price movements with limited risk.
Hedge against adverse market moves.
Generate Income by selling options (collecting premiums).
Leverage positions with less capital compared to buying shares directly.
Part 10: Buying vs Selling Options
Buying Options: Limited risk (premium), unlimited profit potential.
Selling Options: Limited profit (premium), unlimited risk.
Example: Selling a naked call when markets rise aggressively can cause heavy losses.

Part 7 Trading Master Class1. Option Pricing Models
One of the most complex yet fascinating aspects of option trading is how option premiums are determined. Unlike stocks, whose value is based on company fundamentals, or commodities, whose prices are driven by supply-demand, an option’s price depends on several variables.
The two key components of an option’s price are:
Intrinsic Value (real economic worth if exercised today).
Time Value (the added premium based on time left and expected volatility).
Factors Affecting Option Prices
Underlying Price: The closer the stock/index moves in favor of the option, the higher the premium.
Strike Price: Options closer to current market price (ATM) carry more time value.
Time to Expiry: Longer-dated options are more expensive since they allow more time for the move to happen.
Volatility: Higher volatility means higher premiums, as chances of significant movement increase.
Interest Rates & Dividends: These play smaller roles but matter for advanced valuation.
Option Pricing Models
The most famous is the Black-Scholes Model (BSM), developed in 1973, which provides a theoretical value of options using inputs like underlying price, strike, time, interest rate, and volatility. While not perfect, it revolutionized modern finance.
Another important concept is the Greeks—risk measures that tell traders how sensitive option prices are to different factors:
Delta: Measures how much the option price changes with a ₹1 change in the underlying.
Gamma: Measures the rate of change of Delta, indicating risk of large moves.
Theta: Time decay, showing how much premium erodes daily as expiry nears.
Vega: Sensitivity to volatility changes.
Rho: Impact of interest rate changes.
Professional traders use these Greeks to balance portfolios and create hedged positions. For example, a trader selling options must watch Theta (benefits from time decay) but also Vega (losses if volatility spikes).
In short, option pricing is a multi-dimensional game, not just about guessing direction. Understanding these models helps traders evaluate whether an option is overpriced or underpriced, and to design strategies accordingly.
2. Strategies for Beginners
New traders often get attracted to cheap OTM options for quick profits, but this approach usually leads to consistent losses due to time decay. Beginners are better off starting with simple, defined-risk strategies.
Basic Option Strategies:
Covered Call: Holding a stock and selling a call option on it. Generates steady income while holding the stock. Ideal for investors.
Protective Put: Buying a put option while holding a stock. Works like insurance against price falls.
Bull Call Spread: Buying one call and selling another at a higher strike. Limits both profit and loss but reduces cost.
Bear Put Spread: Buying a put and selling a lower strike put. A safer way to bet on downside.
Long Straddle: Buying both a call and put at the same strike. Profits from big moves in either direction.
Long Strangle: Similar to straddle but using different strikes (cheaper).
For beginners, spreads are particularly useful because they balance risk and reward, and also reduce the impact of time decay. For example, instead of just buying a call, a bull call spread ensures you don’t lose the entire premium if the move is slower than expected.
The goal for a beginner is not to chase high returns immediately, but to learn how different market factors impact option prices. Small, risk-controlled strategies give that experience without blowing up accounts.
3. Advanced Strategies & Hedging
Once traders understand basics, they can move on to multi-leg strategies that cater to more complex views on volatility and market direction.
Popular Advanced Strategies
Iron Condor: Combining bull put spread and bear call spread. Profits when market stays within a range. Excellent for low-volatility conditions.
Butterfly Spread: Using three strikes (buy 1, sell 2, buy 1). Profits when the market closes near the middle strike.
Calendar Spread: Selling near-term option and buying long-term option at same strike. Benefits from time decay differences.
Ratio Spreads: Selling more options than you buy, often to take advantage of skewed volatility.
Straddles and Strangles (Short): Selling both call and put to profit from low volatility, though risky without hedges.
Hedging with Options
Institutions and even individual investors use options as risk management tools. For instance, a fund manager holding ₹100 crore worth of stocks can buy index puts to protect against market crashes. Similarly, exporters use currency options to hedge against forex fluctuations.
Advanced option trading is less about speculation and more about risk-neutral positioning—making money regardless of direction, as long as volatility and timing behave as expected. This is where understanding Greeks and volatility becomes critical.
4. Risks in Option Trading
Options provide opportunities, but they are not risk-free. In fact, most beginners lose money because they underestimate risks.
Key Risks Include:
Leverage Risk: Options allow big exposure with small capital, but this magnifies losses if the view is wrong.
Time Decay (Theta): Options lose value daily. Even if you’re directionally correct, being late can mean losses.
Volatility Risk (Vega): Sudden spikes/drops in volatility can make or break option trades.
Liquidity Risk: Illiquid options have wide bid-ask spreads, making it hard to enter or exit efficiently.
Unlimited Loss for Sellers: Option writers can lose unlimited amounts, especially in naked positions.
Overtrading: The fast-moving nature of weekly options tempts traders to overtrade, often leading to poor discipline.
Professional traders always assess risk-reward ratios before taking trades. They know that preserving capital is more important than chasing quick profits. Beginners must internalize this lesson early to survive long-term.

TITAN Breakout - ATH -Swing tradeTITAN break out of TL on CLB. looks good RR setup for posotional traders. Plan you risk first.

BTC on consolidation BTC in healy consolidation from yesterday morning. Dont take any big bets until breakouts on either side. wait for confirmation .

SBI Card - IntradaySBI card above 1055. Resistance and TL BO will be confirmed. Keep under radar for this week.

Transport Corporation Of India short term analysis🌿SHORT + LONG TERM🌿
buy & hold🤝
buy between 235-40 range🔰
Strict sl 230 (just 10 points)🧨
trgt range 290-300🕺
315-330🕺
long 350++🔥
why I shared it for short term ? 🎁
Postive q3 published.🍁
looks like an accumulation.🍁
postive indication from delivery volume.🍁
something cooking in the chart.🍁

AMARARAJA BATTERY trading levels for the daywatch it for short term and intraday
levels mentioned in the chart
Also u can go with a short entry ,with the target of 1000+
period 1-2 months
study then invest.
A

Total Transport Systems short+long Term analysiRisky guys🙏🍁
short + long term🥰
enter if possible ! because uc hitting stock😑
risky players please avoid🙏
but chance to give good retun in long term😍❤😍
cmp 55.5
strict sl 47🙏
trgt 60-69-76.5🔥
long 100+🔥
postive thing to watch 🍁🍁
postive q3 published 🌿🔰
chart shows something postive 🌿🔰


INDUSIND BANK for the daywatch it guys...........
simple but very very powerfull
book decent profits then exit.

MANAPPURAM trading levels for 01.02.201levels mentioned in the chart.
postive result published.expecting result based movements.
watch it this weeek.


Asian paints buy for target of 2300I am not SEBI registered. this is just for your education purpose, not a recommendation.
