Part 7 Trading Master Class Why Traders Use Options
1. Hedging
Investors use options to protect their portfolios from downside risk.
Example: Buying a put option acts like insurance.
2. Speculation
Options allow traders to take directional bets with limited capital.
3. Income Generation
Selling options (covered calls, cash-secured puts) generates regular income through premium collection.
4. Leverage
Options enable traders to control large positions with small capital.
Tardingview

Part 4 Learn Institutional TradingOption Premium and Its Components
The premium is the price paid to acquire an option contract. It consists of two parts: intrinsic value and time value. Intrinsic value reflects the actual profitability if exercised immediately, while time value represents the potential for further profit before expiry. Several factors influence premiums—especially implied volatility (IV), time to expiration, and interest rates. Higher volatility generally increases premiums since potential price swings make the option more valuable. Traders analyze these components using models like Black-Scholes to determine fair value. Understanding premium behavior helps in selecting the right option strategy, whether to buy undervalued options or sell overvalued ones.

Part 11 Trading Master ClassOptions in the Indian Market Context
In India, options trading primarily occurs on the NSE (National Stock Exchange) and BSE (Bombay Stock Exchange), with indices like Nifty and Bank Nifty being the most traded. Contracts have standardized expiry dates—usually the last Thursday of every month. SEBI regulates the derivatives market to ensure transparency and investor protection. Retail participation has surged due to increased awareness and technology-driven platforms. However, many new traders underestimate risks, leading to losses. Understanding margin requirements, taxation rules, and market psychology is essential for long-term success in the Indian derivatives landscape.

PCR Trading Strategies The Role of the Strike Price and Expiry Date
Each option contract includes a strike price and an expiry date. The strike price determines the level at which the asset can be bought or sold, while the expiry date sets the time limit. The relationship between the strike price and the market price determines whether an option is in-the-money (ITM), at-the-money (ATM), or out-of-the-money (OTM). As expiry nears, the option’s time value decreases—a concept known as time decay. Short-term options lose value faster, while long-dated ones retain time premium longer. Successful option traders always monitor how close prices are to the strike and how much time remains to expiry before making or exiting trades.

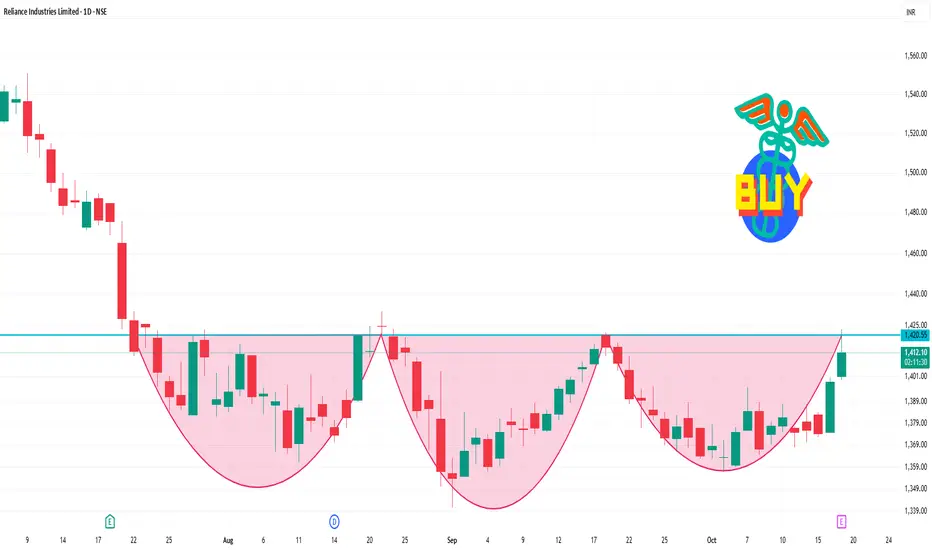
RELIANCE 1 Day Time Frame 📈 Daily Support & Resistance Levels
Immediate Support: ₹1,399.10
Key Resistance: ₹1,417.80
Pivot Point: ₹1,407.53
These levels are based on standard pivot point calculations and indicate that the stock is trading just below the immediate resistance level, suggesting potential for upward movement.
🔧 Technical Indicators
RSI (14-day): 62.51 — Neutral to slightly bullish
MACD: 0.730 — Positive momentum
Moving Averages:
5-day SMA: ₹1,373.00 — Buy signal
50-day SMA: ₹1,350.00 — Buy signal
200-day SMA: ₹1,300.00 — Buy signal
Stochastic Oscillator: 75.00 — Overbought, indicating potential for a pullback
Supertrend: ₹1,414.07 — Mildly bearish
Parabolic SAR: ₹1,357.52 — Mildly bullish
These indicators suggest a generally positive trend, with some caution due to overbought conditions.
Part 7 Trading Master Class Understanding Option Premium and Its Factors
The option premium is the price a trader pays to buy an option. It consists of two parts — intrinsic value and time value.
Intrinsic Value is the difference between the current price of the underlying asset and the strike price. For example, if a stock trades at ₹110 and the call strike is ₹100, the intrinsic value is ₹10.
Time Value reflects the potential for the option to gain more value before expiry. The longer the time to expiry and the higher the volatility, the greater the time value.
As expiry nears, time value decreases — a phenomenon known as time decay (theta). Understanding how premium behaves helps traders make better entry and exit decisions.

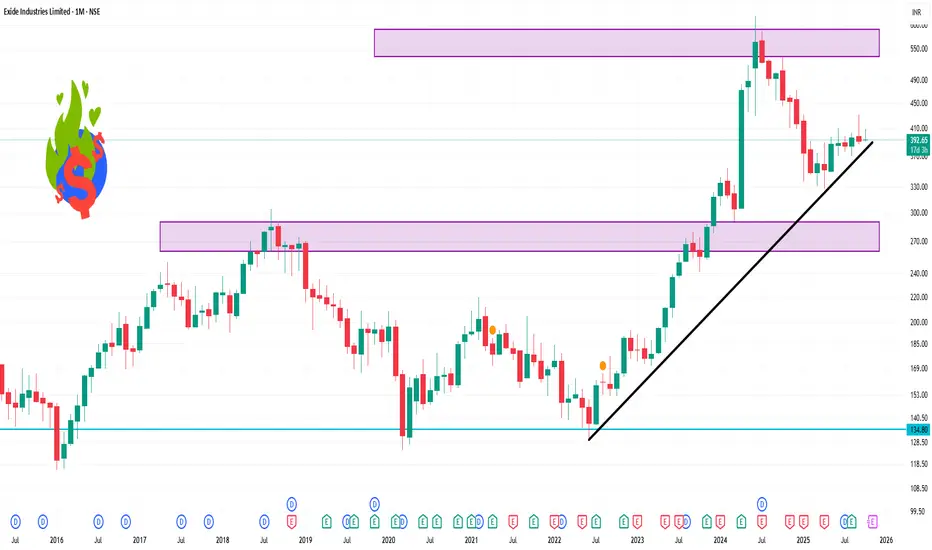
EXIDEIND 1 Month Time Frame 📊 1-Month Technical Overview
Price Performance:
Current Price: ₹393.15
1-Month Change: -5.73%
52-Week Range: ₹328.00 – ₹534.40
Technical Indicators:
RSI (14): 49.30 — Neutral
MACD: -1.72 — Buy Signal
ADX (14): 18.63 — Weak Trend
Pivot Points: Support at ₹385.58; Resistance at ₹409.28
Moving Averages:
5-Day EMA: ₹399.86 — Buy
20-Day EMA: ₹401.20 — Sell
50-Day EMA: ₹399.24 — Buy
100-Day EMA: ₹395.07 — Buy
200-Day EMA: ₹396.66 — Buy
Part 1 Support and Resistance Option Pricing – The Greeks
Option pricing is influenced by several factors such as the underlying price, time to expiry, volatility, and interest rates. These factors are represented by “Greeks,” which measure the sensitivity of an option’s price to different variables:
Delta (Δ): Measures how much the option price changes with a ₹1 move in the underlying asset.
Gamma (Γ): Measures the rate of change of Delta — i.e., how stable Delta is.
Theta (Θ): Measures time decay — how much value the option loses each day as expiry nears.
Vega (ν): Measures sensitivity to volatility — how much the option price changes with changes in market volatility.
Rho (ρ): Measures sensitivity to interest rates.
Understanding these helps traders build strategies that match their risk tolerance and market view.

Part 12 Trading Master ClassMastering the Art of Option Trading
Option trading blends mathematics, psychology, and market logic. It’s not just about predicting direction but understanding probabilities, risk management, and timing. Successful traders treat options as tools for strategic advantage — not gambling tickets.
In essence:
Options = Flexibility + Leverage + Protection.
They empower traders to define risk, hedge intelligently, and profit across market cycles.
But to master them, one must study pricing models, volatility behavior, and trade discipline.
Whether you’re a hedger protecting a portfolio or a speculator chasing momentum, options are the bridge between risk and opportunity — making them one of the most powerful innovations in modern financial markets.

Part 11 Trading Master ClassWhat Is Option Trading?
Option trading is a form of derivatives trading, where investors buy or sell contracts that give them the right but not the obligation to buy or sell an underlying asset (such as stocks, indices, or commodities) at a predetermined price before or on a specific date.
Unlike stocks, which represent ownership in a company, options represent a financial contract derived from the price movement of another asset — hence, they are part of the derivatives market.
There are two main types of options:
Call Options: Give the holder the right to buy an asset at a set price.
Put Options: Give the holder the right to sell an asset at a set price.
Each option contract involves:
Strike Price: The agreed-upon price for buying/selling the asset.
Expiry Date: The last date the option can be exercised.
Premium: The price paid to buy the option.

Part 11 Trading Master Class Strike Price
The strike price is the pre-decided price at which the option buyer can buy (call) or sell (put) the underlying asset.
Expiry Date
Options have a limited life. The expiry date is the last day the option can be exercised—after this, it becomes worthless.
Premium
The premium is the cost paid by the buyer to purchase the option. It’s determined by factors like time left to expiry, volatility, and distance from the strike price.
Leverage
Options provide high leverage—you can control large positions with a small amount of money. However, this also increases potential risk.

Part 1 Ride The Big Moves Introduction to Options Trading
Options trading is one of the most fascinating and flexible instruments in the financial market. It allows traders and investors to speculate, hedge, and generate income — all from the same market tool.
An option is a financial derivative — meaning its value is derived from an underlying asset, such as stocks, indices, commodities, or currencies. Options are contracts that give the buyer the right, but not the obligation, to buy or sell an asset at a specific price (called the strike price) before or on a particular date (called the expiry date).
In essence, options trading helps investors control large positions with relatively smaller amounts of capital while limiting risk when used correctly.

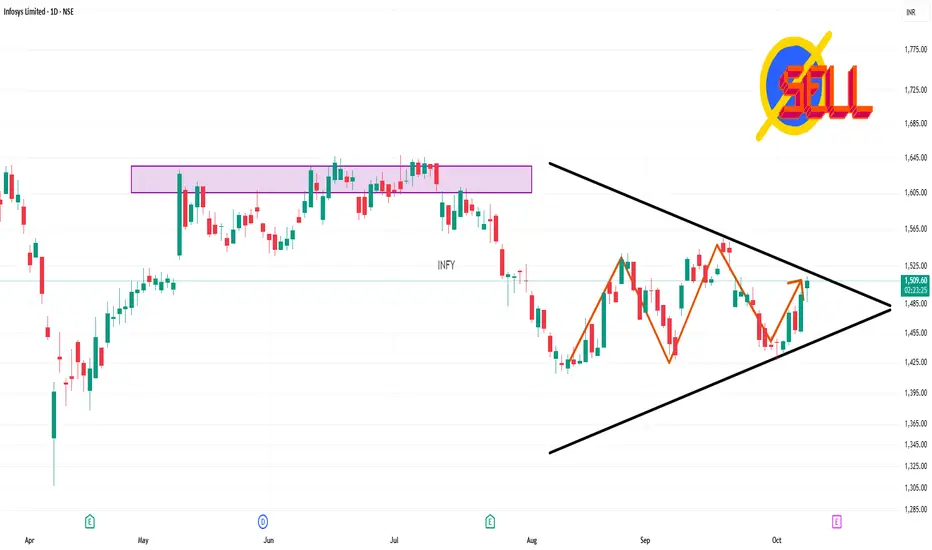
INFY 1 Day Time Frame 📈 Technical Overview (1-Day Timeframe)
Support & Resistance Levels
Immediate Support: ₹1,487.00
Immediate Resistance: ₹1,509.40
Pivot Point: ₹1,498.20
These levels are based on the current day's trading range and can serve as intraday reference points.
Moving Averages
5-Day: ₹1,453.10 (Buy)
10-Day: ₹1,463.10 (Sell)
20-Day: ₹1,491.33 (Sell)
50-Day: ₹1,480.74 (Sell)
100-Day: ₹1,534.03 (Sell)
200-Day: ₹1,614.71 (Sell)
The short-term moving averages indicate a bullish trend, while the longer-term averages suggest a bearish outlook.
Technical Indicators
Relative Strength Index (RSI): 43.75 — Neutral
Stochastic RSI: 25.04 — Neutral
MACD: -11.87 — Bearish
Rate of Change (ROC): -3.66 — Bearish
Commodity Channel Index (CCI): -63.85 — Neutral
These indicators suggest a neutral to slightly bearish momentum.
🔍 Market Sentiment
Infosys has become one of the most actively traded stocks today, particularly in call options, with significant volumes in various strike prices. The stock reached an intraday high, outperforming its sector. However, investor participation has declined, as evidenced by a notable drop in delivery volume.
⚠️ Summary
Infosys Ltd is currently experiencing a neutral to slightly bearish phase on the daily chart. While short-term support holds, the stock faces resistance near ₹1,509.40. Technical indicators like the MACD and ROC suggest downward momentum, and moving averages are predominantly signaling a sell. Traders should monitor the ₹1,509.40 resistance level closely; a breakout above this could shift the bias to bullish.
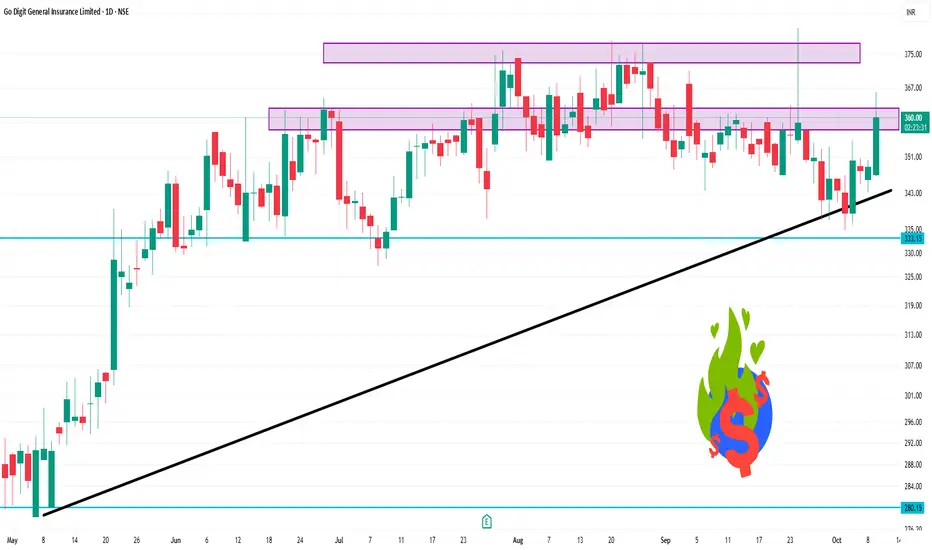
GODIGIT 1 Day Time Frame📊 Intraday Price Movement
Day’s Range: ₹346.65 – ₹350.15
Opening Price: ₹347.10
Closing Price (Previous Day): ₹348.80
Volume Traded: Approximately 55,201 shares
📈 Technical Indicators (1-Day Time Frame)
Relative Strength Index (RSI): 35.92 — indicates a neutral stance
Moving Averages:
5-Day EMA: ₹343.23 (Sell)
10-Day EMA: ₹346.88 (Sell)
20-Day EMA: ₹350.54 (Sell)
50-Day EMA: ₹351.97 (Sell)
100-Day EMA: ₹345.69 (Sell)
200-Day EMA: ₹334.59 (Buy)
MACD: -3.83 — suggests a potential buying opportunity
Commodity Channel Index (CCI): -206.91 — indicates a buying signal
Ultimate Oscillator: 28.51 — suggests a sell signal
Price Rate of Change (ROC): -5.88 — indicates a downward trend
🔍 Summary
The stock is exhibiting a neutral to slightly bearish trend in the short term, with several moving averages signaling a sell. However, indicators like MACD and CCI suggest potential buying opportunities. Investors should monitor for a sustained break above ₹350.00 for a more bullish outlook.
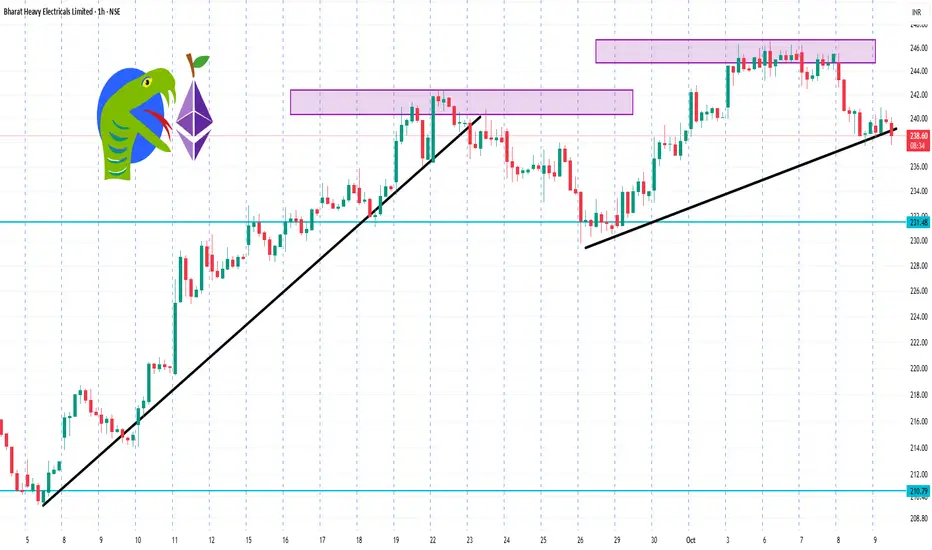
BHEL 1 Hour Time Frame 📉 1-Hour Technical Analysis Summary
Overall Signal: Strong Sell
Relative Strength Index (RSI): 41.43 — approaching oversold territory
MACD: -0.58 — indicating downward momentum
Stochastic Oscillator: 21.78 — confirming bearish bias
Average Directional Index (ADX): 54.36 — suggesting a strong trend
Williams %R: -76.66 — indicating oversold conditions
Commodity Channel Index (CCI): -68.24 — supporting bearish outlook
Pivot Levels:
Support: S1 = ₹238.45
Resistance: R1 = ₹240.85
These indicators collectively suggest a continuation of the current downtrend.
🔍 Key Price Levels
Intraday Support: ₹236.19
Intraday Resistance: ₹243.64
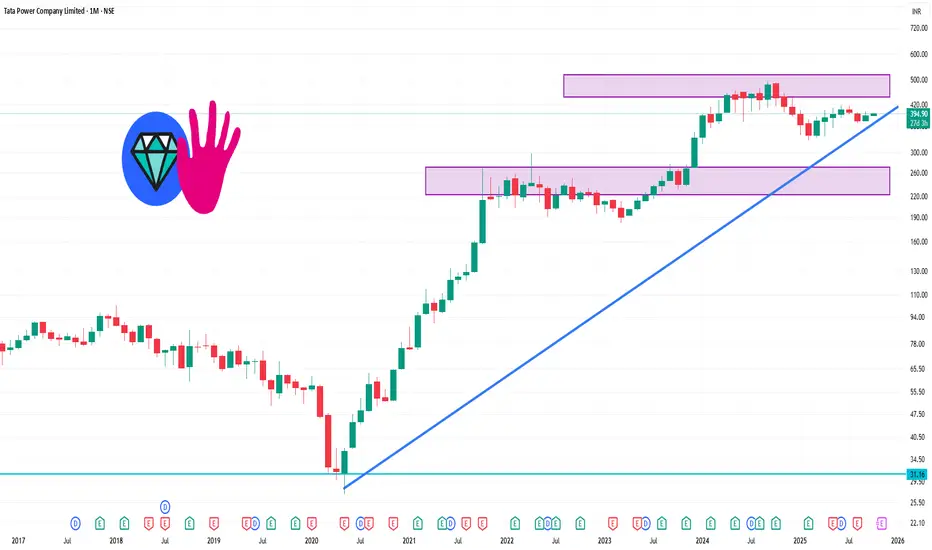
TATAPOWER 1 Month Time frame 📊 1-Month Technical Overview
Over the past month, the stock has shown a modest upward movement of approximately 1.90%
TradingView
.
🔄 Pivot Points (Monthly)
Support Levels: ₹387.57, ₹375.23, ₹361.82
Resistance Levels: ₹413.32, ₹426.73, ₹440.14
The central pivot point stands at ₹400.98
📊 Technical Indicators
Relative Strength Index (RSI): 56.79 (Neutral)
Moving Average Convergence Divergence (MACD): 0.06 (Bullish)
Commodity Channel Index (CCI): -482.5 (Bullish)
Ultimate Oscillator: 80.16 (Bullish)
Simple Moving Averages (SMA): 20-day: ₹394.82, 50-day: ₹394.90, 200-day: ₹393.54 (All Bullish)
Exponential Moving Averages (EMA): 20-day: ₹394.92, 50-day: ₹394.79, 200-day: ₹393.68 (All Bullish)
🧠 Summary
Tata Power's stock is exhibiting a bullish trend over the past month, supported by positive technical indicators and sustained upward momentum. The current price is approaching key resistance levels, suggesting potential for further gains if these levels are breached. However, investors should remain cautious of broader market conditions and sector-specific challenges that could impact performance.
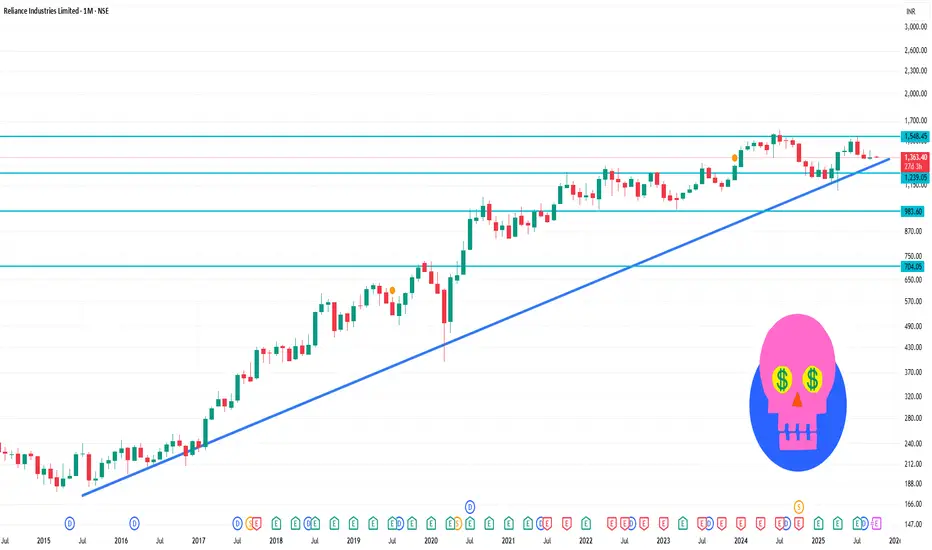
RELIANCE 1 Month Time Frame 📊 Monthly Pivot Levels (Standard)
Pivot Point: ₹1,375.53
Support Levels:
S1: ₹1,329.07
S2: ₹1,294.13
S3: ₹1,247.67
Resistance Levels:
R1: ₹1,410.47
R2: ₹1,456.93
R3: ₹1,491.87
These levels are derived from standard pivot point calculations, which are commonly used to identify potential support and resistance zones.
🔄 Technical Indicators Overview
Relative Strength Index (RSI): Approximately 41.5, indicating a neutral to slightly bearish condition.
Moving Averages: The stock is trading below its 50-day and 200-day moving averages, suggesting a bearish trend.
MACD: Currently negative, reinforcing the bearish momentum.
Part 2 Master Candle Stick Pattern1. Option Writing – Risks and Rewards
Option writing (selling) is when traders collect premium by selling calls or puts.
Advantage: Time decay works in your favor.
Risk: Unlimited (naked call writing is extremely risky).
Best Use: Done with hedges, spreads, or adequate margin.
2. Options vs. Futures
While both are derivatives, they differ:
Futures: Obligation to buy/sell at a future date.
Options: Right but not obligation.
Risk/Reward: Futures = unlimited risk/reward. Options = asymmetric risk/reward.
Use Case: Futures for directional moves, options for hedging or volatility plays.
3. Option Trading Psychology
Option trading is not just numbers—it’s also psychology.
Fear of missing out (FOMO) leads traders to buy expensive options in high IV.
Greed causes holding onto losing trades too long.
Discipline is key in cutting losses quickly and following position sizing rules.
4. Risk Management in Option Trading
Without proper risk management, options can blow up accounts. Key principles:
Never risk more than 1–2% of capital per trade.
Avoid naked option selling without hedge.
Use stop-loss orders or mental stop levels.
Diversify across strategies.
5. Option Trading in India – NSE Context
In India, options on Nifty 50, Bank Nifty, FinNifty, and individual stocks dominate volumes.
Weekly Expiries: Bank Nifty & Nifty weekly expiries have huge liquidity.
Retail Participation: Has grown massively due to low margin requirements.
Risks: SEBI has warned about high losses in retail options trading.
6. Real-World Applications of Options
Options are not just speculation tools—they serve critical functions:
Hedging portfolios of mutual funds, FIIs, DIIs.
Insurance companies use options to balance risks.
Commodity traders hedge against price swings.
Global corporations hedge forex exposures.
7. Conclusion – The Power and Danger of Options
Options are double-edged swords. They allow traders to:
Leverage capital effectively.
Hedge risks in uncertain markets.
Create income through systematic strategies.
But they also carry dangers:
Time decay eats away value.
Over-leveraging leads to account blow-ups.
Misjudging volatility can destroy trades.
Thus, option trading should be approached with education, discipline, and respect for risk. A beginner should start small, learn spreads, and focus on risk control rather than chasing quick profits.

Trading Master Class With ExpertsPart 1: Introduction to Option Trading
Options are financial derivatives that derive their value from an underlying asset such as stocks, indices, commodities, or currencies. Unlike shares, buying an option doesn’t mean you own the asset—it gives you the right but not the obligation to buy or sell the asset at a pre-agreed price within a set period. This flexibility makes options a powerful tool for hedging, speculation, and income generation.
Part 2: What is a Derivative?
A derivative is a financial contract whose value depends on another asset. Futures and options are the two most popular derivatives. While futures require you to buy/sell at expiry, options give you the choice. This “choice” is what makes them unique—and sometimes tricky.
Part 3: The Two Types of Options
Call Option – Gives the buyer the right to buy an asset at a fixed price (strike price).
Example: If you buy a call option of Reliance at ₹2500, and the stock moves to ₹2600, you can still buy it at ₹2500.
Put Option – Gives the buyer the right to sell an asset at a fixed price.
Example: If you buy a put option at ₹2500 and the stock falls to ₹2400, you can still sell it at ₹2500.
Part 4: Key Terminologies
Strike Price – The pre-decided price of buying/selling.
Premium – The cost paid to buy the option.
Expiry Date – The last date till which the option is valid.
In-the-Money (ITM) – Option has intrinsic value.
Out-of-the-Money (OTM) – Option has no intrinsic value.
At-the-Money (ATM) – Strike price is close to market price.
Part 5: Call Option in Detail
A call option is ideal if you expect the price of an asset to rise. Buyers risk only the premium paid, while sellers (writers) can face unlimited losses if prices rise sharply. Traders often buy calls for bullish bets and sell calls to earn premium income.
Part 6: Put Option in Detail
A put option is profitable when asset prices fall. Buyers of puts use them for protection against a market crash, while sellers hope prices won’t fall so they can pocket the premium. Investors holding stocks often buy puts as insurance against downside risk.
Part 7: How Option Premium is Priced
Option premium = Intrinsic Value + Time Value
Intrinsic Value: Actual value (e.g., if Reliance is ₹2600 and strike is ₹2500, intrinsic = ₹100).
Time Value: Extra cost traders pay for the possibility of favorable movement before expiry.
Pricing is also influenced by volatility, interest rates, and dividends.
Part 8: The Greeks in Options
The Greeks measure option sensitivity:
Delta – Measures how much option price moves for a ₹1 move in stock.
Gamma – Measures how delta changes with stock movement.
Theta – Measures time decay (options lose value as expiry approaches).
Vega – Measures sensitivity to volatility.
Rho – Measures sensitivity to interest rates.
Part 9: Why Traders Use Options
Options are versatile. Traders use them to:
Speculate on price movements with limited risk.
Hedge against adverse market moves.
Generate Income by selling options (collecting premiums).
Leverage positions with less capital compared to buying shares directly.
Part 10: Buying vs Selling Options
Buying Options: Limited risk (premium), unlimited profit potential.
Selling Options: Limited profit (premium), unlimited risk.
Example: Selling a naked call when markets rise aggressively can cause heavy losses.

Part 7 Trading Master Class1. Option Pricing Models
One of the most complex yet fascinating aspects of option trading is how option premiums are determined. Unlike stocks, whose value is based on company fundamentals, or commodities, whose prices are driven by supply-demand, an option’s price depends on several variables.
The two key components of an option’s price are:
Intrinsic Value (real economic worth if exercised today).
Time Value (the added premium based on time left and expected volatility).
Factors Affecting Option Prices
Underlying Price: The closer the stock/index moves in favor of the option, the higher the premium.
Strike Price: Options closer to current market price (ATM) carry more time value.
Time to Expiry: Longer-dated options are more expensive since they allow more time for the move to happen.
Volatility: Higher volatility means higher premiums, as chances of significant movement increase.
Interest Rates & Dividends: These play smaller roles but matter for advanced valuation.
Option Pricing Models
The most famous is the Black-Scholes Model (BSM), developed in 1973, which provides a theoretical value of options using inputs like underlying price, strike, time, interest rate, and volatility. While not perfect, it revolutionized modern finance.
Another important concept is the Greeks—risk measures that tell traders how sensitive option prices are to different factors:
Delta: Measures how much the option price changes with a ₹1 change in the underlying.
Gamma: Measures the rate of change of Delta, indicating risk of large moves.
Theta: Time decay, showing how much premium erodes daily as expiry nears.
Vega: Sensitivity to volatility changes.
Rho: Impact of interest rate changes.
Professional traders use these Greeks to balance portfolios and create hedged positions. For example, a trader selling options must watch Theta (benefits from time decay) but also Vega (losses if volatility spikes).
In short, option pricing is a multi-dimensional game, not just about guessing direction. Understanding these models helps traders evaluate whether an option is overpriced or underpriced, and to design strategies accordingly.
2. Strategies for Beginners
New traders often get attracted to cheap OTM options for quick profits, but this approach usually leads to consistent losses due to time decay. Beginners are better off starting with simple, defined-risk strategies.
Basic Option Strategies:
Covered Call: Holding a stock and selling a call option on it. Generates steady income while holding the stock. Ideal for investors.
Protective Put: Buying a put option while holding a stock. Works like insurance against price falls.
Bull Call Spread: Buying one call and selling another at a higher strike. Limits both profit and loss but reduces cost.
Bear Put Spread: Buying a put and selling a lower strike put. A safer way to bet on downside.
Long Straddle: Buying both a call and put at the same strike. Profits from big moves in either direction.
Long Strangle: Similar to straddle but using different strikes (cheaper).
For beginners, spreads are particularly useful because they balance risk and reward, and also reduce the impact of time decay. For example, instead of just buying a call, a bull call spread ensures you don’t lose the entire premium if the move is slower than expected.
The goal for a beginner is not to chase high returns immediately, but to learn how different market factors impact option prices. Small, risk-controlled strategies give that experience without blowing up accounts.
3. Advanced Strategies & Hedging
Once traders understand basics, they can move on to multi-leg strategies that cater to more complex views on volatility and market direction.
Popular Advanced Strategies
Iron Condor: Combining bull put spread and bear call spread. Profits when market stays within a range. Excellent for low-volatility conditions.
Butterfly Spread: Using three strikes (buy 1, sell 2, buy 1). Profits when the market closes near the middle strike.
Calendar Spread: Selling near-term option and buying long-term option at same strike. Benefits from time decay differences.
Ratio Spreads: Selling more options than you buy, often to take advantage of skewed volatility.
Straddles and Strangles (Short): Selling both call and put to profit from low volatility, though risky without hedges.
Hedging with Options
Institutions and even individual investors use options as risk management tools. For instance, a fund manager holding ₹100 crore worth of stocks can buy index puts to protect against market crashes. Similarly, exporters use currency options to hedge against forex fluctuations.
Advanced option trading is less about speculation and more about risk-neutral positioning—making money regardless of direction, as long as volatility and timing behave as expected. This is where understanding Greeks and volatility becomes critical.
4. Risks in Option Trading
Options provide opportunities, but they are not risk-free. In fact, most beginners lose money because they underestimate risks.
Key Risks Include:
Leverage Risk: Options allow big exposure with small capital, but this magnifies losses if the view is wrong.
Time Decay (Theta): Options lose value daily. Even if you’re directionally correct, being late can mean losses.
Volatility Risk (Vega): Sudden spikes/drops in volatility can make or break option trades.
Liquidity Risk: Illiquid options have wide bid-ask spreads, making it hard to enter or exit efficiently.
Unlimited Loss for Sellers: Option writers can lose unlimited amounts, especially in naked positions.
Overtrading: The fast-moving nature of weekly options tempts traders to overtrade, often leading to poor discipline.
Professional traders always assess risk-reward ratios before taking trades. They know that preserving capital is more important than chasing quick profits. Beginners must internalize this lesson early to survive long-term.

Part 3 Institutional TradingPart 1: Introduction to Option Trading
Option trading is a sophisticated financial instrument that allows traders to speculate on or hedge against the future price movements of an underlying asset. Options provide rights, not obligations, giving traders flexibility compared to traditional stock trading. Unlike futures, where contracts are binding, options give the choice to exercise or let expire. This makes them attractive for hedging, income generation, and speculative strategies.
Part 2: What is an Option?
An option is a contract between a buyer and seller that gives the buyer the right, but not the obligation, to buy or sell an underlying asset at a predetermined price (strike price) on or before a specific date (expiration).
Call Option: Right to buy the underlying asset.
Put Option: Right to sell the underlying asset.
Options derive their value from the underlying asset, which can be stocks, indices, commodities, or currencies.
Part 3: Key Terminology in Option Trading
Understanding options requires familiarity with core terms:
Strike Price: Price at which the option can be exercised.
Expiration Date: Last date the option can be exercised.
Premium: Price paid by the buyer to purchase the option.
In-the-Money (ITM): Option has intrinsic value.
Out-of-the-Money (OTM): Option has no intrinsic value.
At-the-Money (ATM): Option’s strike price is near the current market price.
Part 4: Types of Option Contracts
Options can be categorized as:
American Options: Can be exercised any time before expiration.
European Options: Can be exercised only on expiration.
Exotic Options: Complex options with non-standard features, e.g., barrier, Asian, or digital options.
Part 5: Option Payoff Structure
Option payoffs determine profit or loss:
Call Option Payoff: Profit if underlying price > strike price at expiration.
Put Option Payoff: Profit if underlying price < strike price at expiration.
Graphs are often used to visualize potential profit/loss for both buyers and sellers.
Part 6: Option Pricing Components
Option prices (premiums) are influenced by:
Intrinsic Value: Difference between strike price and underlying price.
Time Value: Additional value due to time remaining until expiration.
Volatility: Higher volatility increases option premiums.
Interest Rates & Dividends: Affect option valuation for stocks.
Part 7: Option Pricing Models
Common models used to calculate option premiums:
Black-Scholes Model: For European options, considers volatility, interest rate, strike price, and time.
Binomial Model: Uses a tree of possible prices to calculate option value.
Monte Carlo Simulation: Used for complex or exotic options.
Part 8: The Greeks – Measuring Risk
Greeks quantify how an option’s price changes with market variables:
Delta: Sensitivity to underlying price.
Gamma: Rate of change of delta.
Theta: Time decay impact.
Vega: Sensitivity to volatility.
Rho: Sensitivity to interest rates.
Greeks help traders manage risk and structure positions.
Part 9: Option Strategies for Beginners
Simple strategies include:
Long Call: Buying a call to profit from price rise.
Long Put: Buying a put to profit from price fall.
Covered Call: Selling a call against owned stock for income.
Protective Put: Buying a put to hedge an existing stock.
Part 10: Advanced Option Strategies
Advanced strategies include:
Spreads: Buying and selling options of the same type to limit risk.
Vertical Spread, Horizontal/Calendar Spread, Diagonal Spread.
Straddles & Strangles: Betting on high volatility without direction bias.
Butterfly & Condor: Complex strategies for range-bound markets.

Divergance Secrets1. Introduction to Option Trading
In the world of financial markets, traders and investors are constantly looking for ways to maximize returns while managing risks. Beyond the conventional buying and selling of stocks, bonds, or commodities lies the fascinating arena of derivatives. Among derivatives, options stand out as one of the most versatile and widely used financial instruments.
An option is essentially a contract that gives the holder the right, but not the obligation, to buy or sell an underlying asset at a predetermined price before or at a specified expiration date. This flexibility allows traders to hedge risks, speculate on market movements, or design complex strategies to suit different risk appetites.
Option trading is a double-edged sword: it can generate extraordinary profits in a short span but also result in significant losses if misunderstood. Hence, before stepping into this market, it is essential to understand the fundamentals, mechanics, and strategies behind option trading.
2. Basics of Options
To understand option trading, let us first dissect the essential components.
2.1 Call Options
A call option gives the buyer the right, but not the obligation, to buy the underlying asset at a predetermined price (strike price) within a specific period.
If the asset’s price rises above the strike price, the call option holder can buy at a lower price and profit.
If the price falls below the strike, the buyer may let the option expire worthless, losing only the premium paid.
Example: If you buy a call option on Stock A at ₹100 strike and the stock rises to ₹120, you profit by exercising the option or selling it in the market.
2.2 Put Options
A put option gives the buyer the right, but not the obligation, to sell the underlying asset at the strike price before or at expiration.
If the asset price falls below the strike, the put holder benefits.
If it rises above the strike, the option may expire worthless.
Example: If you buy a put option on Stock A at ₹100 and the stock falls to ₹80, you can sell it at ₹100, making a profit.
2.3 Strike Price
The pre-agreed price at which the underlying asset can be bought or sold.
2.4 Premium
The price paid by the option buyer to the seller (writer) for acquiring the option contract. It represents the upfront cost and is influenced by time, volatility, and underlying asset price.
2.5 Expiration Date
Options have a finite life and must be exercised or left to expire on a specific date.
3. Types of Options
Options vary based on style, market, and underlying assets.
American Options – Can be exercised anytime before expiration.
European Options – Can only be exercised on the expiration date.
Equity Options – Based on shares of companies.
Index Options – Based on stock indices like Nifty, S&P 500, etc.
Commodity Options – Based on gold, silver, crude oil, etc.
Currency Options – Based on forex pairs like USD/INR.
4. Participants in Option Trading
Every option trade involves two primary parties:
Option Buyer – Pays the premium, enjoys the right but no obligation.
Option Seller (Writer) – Receives the premium but carries the obligation if the buyer exercises the contract.
The buyer has limited risk (premium paid), but the seller has theoretically unlimited risk and limited profit (premium received).
5. Why Trade Options?
Traders and investors use options for multiple reasons:
Hedging – Protecting existing investments from adverse price moves.
Speculation – Betting on market directions with limited risk.
Income Generation – Writing options to collect premiums.
Leverage – Controlling a large position with a relatively small investment.

Option Trading 1. Speculation with Options
Options allow leverage, letting traders profit from small price movements with limited capital. Risk is limited to the premium paid for buyers, but sellers face potentially unlimited risk.
2. Option Styles
Options come in different styles:
European Options: Can be exercised only at expiry.
American Options: Can be exercised anytime before expiry.
Bermudan Options: Exercise possible on specific dates before expiry.
3. Factors Affecting Option Prices
Option premiums are influenced by:
Underlying asset price
Strike price
Time to expiry
Volatility
Interest rates
Dividends
Understanding these factors helps in predicting option price movement.
4. Intrinsic vs. Extrinsic Value
Intrinsic value: Real value if exercised now.
Extrinsic value: Additional premium based on time and volatility.
Example: If a stock trades at ₹520 and the call strike is ₹500, intrinsic value = ₹20, rest is extrinsic value.
5. Option Strategies
There are basic and advanced option strategies:
Single-leg: Buying a call or put.
Multi-leg: Combining options to reduce risk or maximize profit (e.g., spreads, straddles, strangles).
Example: Covered call involves holding the stock and selling a call to earn extra premium.
6. Risk Management
Options trading requires strict risk management:
Limit exposure per trade.
Use stop-loss orders.
Diversify strategies.
Monitor Greeks to assess risk dynamically.
7. Advantages of Options
Flexibility in trading.
Leverage for small capital.
Hedging against price swings.
Profit in any market condition using proper strategies.
8. Disadvantages of Options
Complexity compared to stocks.
Time decay can erode value.
Unlimited risk for option sellers.
Requires continuous monitoring of market movements.
9. Real-life Examples
Hedging: A farmer selling wheat futures and buying put options to secure a minimum price.
Speculation: A trader buying Nifty call options before earnings season to profit from upward movement.
Income: Selling covered calls on owned stocks to earn premiums regularly.
10. Conclusion
Option trading is a powerful tool for hedging, speculation, and income generation, but it requires knowledge, discipline, and risk management. Understanding strike prices, premiums, Greeks, and strategies ensures that traders can capitalize on market movements effectively. Beginners should start with simple strategies and gradually explore complex multi-leg positions as they gain confidence.
