BSE Ltd TargetsThe Recent expected Targets from BSE Ltd can be set at 3135 and 3438. If the stock hits resistance at this level then the support levels of this stock can be 2710 and 2600. Held this stock even when it hit lows in Aug and Sept as RSI indicated a reversal and it paid off.
Targetprice

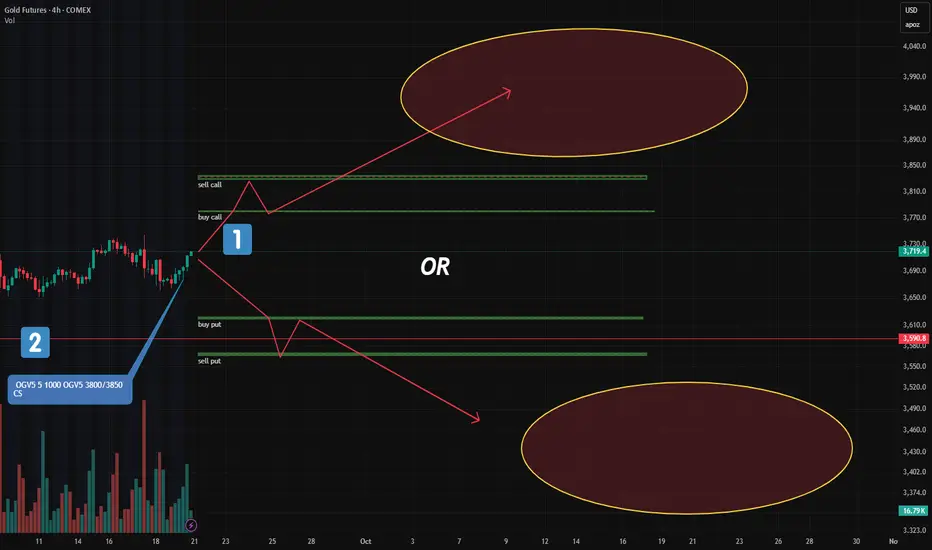
Gold: Major New Option Portfolios Signal Strong Moves AheadFriday’s CME report showed a surge in large option blocks in gold — two of them stand out.
🔹 1. "Long Condor" on December Futures (GCZ24)
This is the most significant structure added:
Targets a move below $3,620 or above $3,780
In other words: a breakout is expected, not consolidation
📌 Key point:
A "Long Condor" profits from volatility, not direction.
It wins if price moves sharply — up OR down — but loses if it stays flat.
🔹 2. Bull Call Spread (Oct Series): $3800–$3850
Another key play:
A classic bullish call spread at 3800/3850
Target: upside beyond current levels
But here’s the difference:
Unlike the "Long Condor", this one needs a clear upward move — and soon. Within a few days.
This isn’t about volatility.
It’s a directional bet that gold will rise.
🧠 Bottom Line:
One portfolio says: "Breakout coming — no matter which way."
Another says: "Gold goes up — and soon."
Are they aligned?
Contradictory?
Or could both win?
Trade smarter, not harder! Looking to boost your profits with valuable market insights and data-driven entry points? Join us or keep moving!
Bearish Setup on BCH/USDOverview:
The market conditions and price action are currently indicating a bearish trend for BCH/USD. Below is the detailed breakdown of the trade setup and why this position is logical:
Market Structure:
The price is in a downward trend, confirmed by the lower highs and lower lows visible on the chart.
A break below key support levels, along with the current price action, suggests that the bearish move is likely to continue.
Entry Level:
Entry = 580.53: The entry has been strategically placed below a key resistance level, which is also near the recent high. This confirms that a breakdown is happening, setting the stage for further downward movement.
We are entering at a point where the price has shown weakness and failed to continue its upward movement, which typically signals a potential continuation to the downside.
Stop Loss (SL):
Stop Loss = 601.45: The stop loss has been placed above a previous swing high, ensuring that the trade will only be invalidated if the price reverses above this level, thus protecting us from a false breakout.
The chosen level ensures the risk is kept under control while still allowing for reasonable price fluctuations within the trend.
Take Profit (TP):
Target = 535.76: The target is set based on recent price action, aligning with previous support levels. This level is where the price is expected to find potential support before making any reversal.
The risk-to-reward ratio here is favorable, with a potential reward much higher than the initial risk, making the setup an attractive swing trade opportunity.
Trend Confirmation:
The price is below the 50-period and 200-period EMAs, indicating that the overall trend is bearish.
The trendline at the bottom, which slopes upward, serves as an additional support that the price is expected to break below before confirming the bearish move.
Volume:
Volume analysis indicates increasing selling pressure, supporting the bearish narrative.
A breakout with higher volume confirms the strength of the downtrend, reducing the chances of a fakeout.
Conclusion:
The overall market structure, confirmed by the price action, trend, and volume analysis, suggests that the market is likely to move lower.
With a favorable risk-to-reward ratio, this setup is logical and worth considering for those looking to enter a short position on BCH/USD.

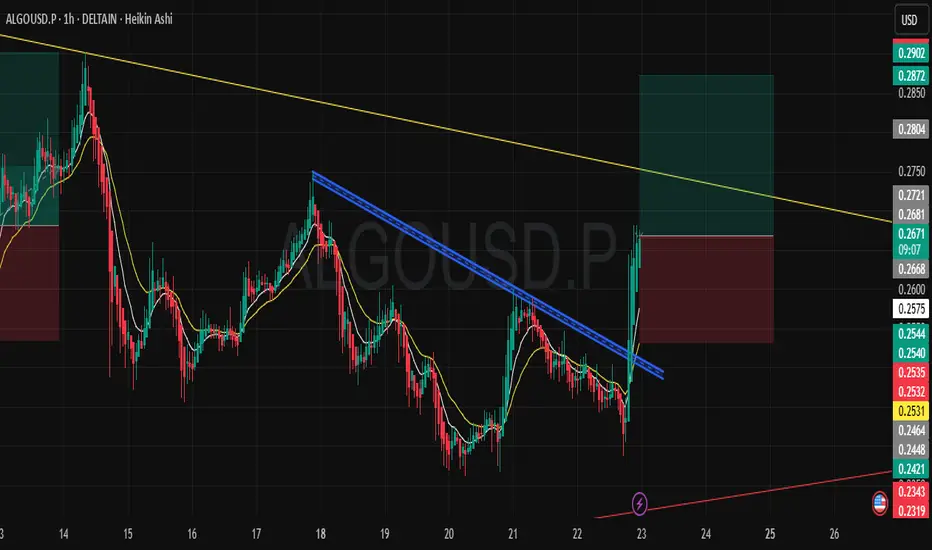
ALGO/USDT – Bullish Breakout Setup (1H)ALGO has shown a clean breakout from the descending trendline (blue) after several days of lower highs. The breakout was backed by strong bullish candles and a close above the short-term EMAs, confirming momentum shift to the upside.
🔹 Trade Plan:
Entry: Around 0.2575 (post-breakout confirmation)
Stop Loss: 0.2540 (below structure & EMAs)
Targets:
First Target: 0.2721
Second Target: 0.2804
Extended Target: 0.2902
🔹 Technical Outlook:
The descending trendline was acting as resistance since August 17 and has now been broken.
EMAs are turning upward and aligning bullishly.
Strong volume push on breakout candle indicates buyers stepping in.
Next major resistance sits near the higher descending yellow trendline – a break above that could open the way toward higher levels.
📊 Bias: Bullish as long as price holds above 0.2540. Watching for continuation toward upper resistance.
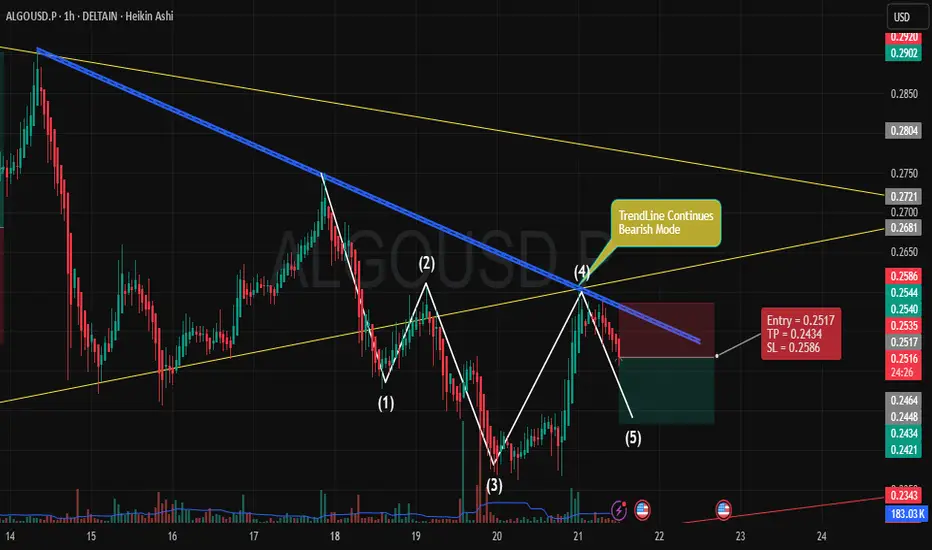
Bearish Continuation for ALGOUSD** IF you like my observation, please boost and follow for more content."
Trade Overview:
Entry: 0.2517
Stop Loss (SL): 0.2586
Take Profit (TP): 0.2434
Key Points:
Trend Analysis:
The price is currently under a bearish trend as indicated by the downward sloping blue trendline. This trendline shows consistent resistance, rejecting price rallies and continuing the bearish bias.
The yellow trendlines represent key support and resistance zones, highlighting the consolidation range where the price has been fluctuating within a defined pattern.
Market Structure:
Price has formed a lower high (marked as point 4), followed by a lower low (point 5), confirming the continuation of the downtrend. This suggests that the market is likely to keep pushing lower towards the target.
The price has retraced upwards but has failed to break the bearish trendline, reinforcing the idea of further downside potential.
Entry Strategy:
Entry Point: We are entering at 0.2517, just below the recent resistance, anticipating the price to continue downward after failing to breach the trendline.
The price action at point (4) suggests weakness in the upward movement, making this a prime opportunity to capitalize on further downside movement.
Risk-Reward Setup:
The Stop Loss is set at 0.2586, just above the last swing high, giving room for minor retracements while protecting against a breakout above the trendline.
The Take Profit is set at 0.2434, targeting the next level of support where the price could potentially find buying interest. This gives a favorable Risk-Reward Ratio of about 2:1.
Volume Confirmation:
Notice the increase in volume during the downward movement, suggesting that sellers are in control. A drop in volume during price retracements further validates the weak bullish momentum and confirms the expected continuation to the downside.
Why This Setup?
The bearish trend, price action, and trendline rejection all align with a continuation trade setup.
The risk-reward is favorable, with a clear structure to exit the trade if the price moves against the position.
The broader market context is also in line with a bearish outlook, making this a high-probability trade setup for the next few hours.
UPDATER SERVICES LTD#UDS
Flag & Pole pattern Breakout & the stock is trading at ATH.
We can see stock making new highs as volume is rising in the stock,
golden crossover done in daily chart.
The ratio chart is also on breakout.

@tatapower range breakout done Swing trading concept NSE:TATAPOWER Swing trading concept
Range breakout strategy
Daily time frame
Duration 15-20 days
Breakout done with rising volume 📈🚨✔️
Stoploss at your risk
Do as directed
Do your analysis before taking any step
This is not trading recommendation or advise

BTC short ( Short term)If a breakdown occurs then the given target can be achieved. This is my personal view and analysis for bitcoin. Always trade responsibly and place a stop loss.

PRESTIGE ESTATES - Swing Trade - 25th February #stocksPRESTIGE ESTATES (1D TF) - Swing Trade Analysis given on 25th Feb, 2024
Pattern: FALLING WEDGE BREAKOUT
- Resistance Breakout - Done ✓
- Volume buildup at Resistance - Done ✓
- Retest & Consolidation - Done ✓
#stocks #swingtrade #chartanalysis #priceaction #traderyte #PRESTIGE #stockmarket #sharemarket #viral #sharemarketindia #StockMarketindia

ALLCARGO LOGISTICS - Swing Trade Analysis - 23rd March #stocksALLCARGO LOGISTICS (1W TF) - Swing Trade Analysis given on 23rd March, 2024
Pattern: AT WEEKLY SUPPORT
- Pullback candle at Weekly Support - Done ✓
- Strong Volume candle at Support - Done ✓
- Demand Zone Retest & Consolidation - In Progress
#ALLCARGO #LOGISTICS

CONCORD BIOTECH - Swing Trade - 25th February #stocksCONCORD BIOTECH (1D TF) - Swing Trade Analysis given on 25th Feb, 2024
Pattern: RECTANGLE BOX
- Volume buildup at Resistance - Done ✓
- Resistance Breakout - In Progress
- Retest & Consolidation - In Progress
#stocks #swingtrade #chartanalysis #priceaction #traderyte #CONCORDBIOTECH #stockmarket #sharemarket #viral #sharemarketindia #StockMarketindia

ICICI SECURITIES - Swing Trade - 25th February #stocksICICI SECURITIES (1D TF) - Swing Trade Analysis given on 25th Feb, 2024
Pattern: ASCENDING TRIANGLE
- Volume buildup at Resistance - Done ✓
- Resistance Breakout - In Progress
- Retest & Consolidation - In Progress
#stocks #swingtrade #chartanalysis #priceaction #traderyte #ICICI #stockmarket #sharemarket #viral #sharemarketindia #StockMarketindia

Jaiprakash Power(JPPOWER) Stock Targets 10.90 and 11.95The current price stands at 9.90. After conducting a three-week analysis, I've identified a promising trade opportunity for Jaiprakash Power Ventures Ltd (JPPOWER) stock. My evaluation indicates two potential profit targets: the first set at 10.90 and the second at 11.95. It's crucial to establish a clear stop-loss level to effectively manage risks.
Trade Idea: Consider taking a long position on JPPOWER stock for a three-week period, with the first profit target set at 10.90 and the second at 11.95. Implement a well-defined stop-loss strategy to manage risks effectively.
1st Target --> 10.90
2nd Target --> 11.95
Best regards,
Kambi

Long Setup in Mahindra &MahindraA Bullish Flag and Pole Chart Pattern Breakout happened on the weekly Time frame of NSE:M_M
Price Action is well supported by the volume.
The stock is currently in uptrend making higher highs and higher lows.
One can add this stock into their stocks to buy list.
Initiate the long trade only according to the levels mentioned.
Stop loss will be on weekly closing basis.
Trend Analysis :- UP Trend
Chart Pattern :- Bullish Flag and Pole
Technical Indicator :- Positive MACD Crossover

INOX WIND will give good returnswe see in the chart that the stock changing its momentum
we will see that the stock will give good returns on the monthly chart
Central resistance zone between 235 to 310 rs approx.(+-5)...above 233 will see a sudden change in north direction...book profit at 300 rs and if broke 310 monthly then the stock will show further momentum
first target:235
second target:305 approx.
sl:165 rs on a closing basis
views are personnel...we are not sebi registered...

HIMATSEIDE Analysis(Double Bottom)!HIMATSEIDE Analysis on Weekly Timeframe
Bullish view on HIMATSEIDE
Double Bottom Pattern Formation in HIMATSEIDE
Neckline Breakout
HIMATSEIDE has made double bottom patten on Weekly Timeframe. The price has given breakout to the neckline 85.45 and now it is trading above it. We can see the breakout has happend with the good volume. We can expect further upmove upto 107.80.
Trade Psychology and Setup =
Entry = Between 85 - 90 but it will good if we can enter with lower price
Target = 107.80
Stop Loss = Below 75.80
Disclaimer = All my analysis are for Educational Purpose only. Before entering into any trade - 1) Educate Yourself 2) Do your own research and analysis 3) Define your Risk to Reward ratio 4)Don't trade with full capital

Weekly H&S pattern target about to be achieved in L&T The pattern which started weeks back is now about to give the fruit. Look at the chart of L&T. How beautifully the chart broke out of the Head and Shoulder pattern and now is about to give the target. Patience and sticking to 1 pattern is the key to technical analysis.

TCS long termTarget - 3470/3490/3655/3800
Support level -3366/3264/3200
Its forms Flag pattern with target point (315).
And also forms bullish flag.
It always form parallel channels and make lows and highs .
You can look at 45 min and 1 day time frame you may observe parallel channels mostly.
Consolidation channel- mostly 25 to 32 days it form highs and lows.
And now its time to go high.If is sustains and break the channel then above target can achieve.
Comment for more analysis.
like and support.

TEXRAIL SHARE BUY OPPORTUNITY 46 LEVEL TEXRAIL SHARE buy opportunity 46 level and long term investment big profit exception my view and other technical view so comments box

Bank Nifty to Fill Previous Gaps?Is Bank Nifty trying to feel previous gap?
Target / Support - 37950
Stoploss - 39518

Target 2 achieved in ITC | 8.65% mover This idea is a follow-up to ITC
You can check the Link to Related Ideas
Disclaimer: The information provided is for educational purposes only. Our intention is not to provide any financial advice, don't take any decision without consulting your financial advisor.


Chambal Fertilizer - Cup and handleChambal Fertilizer:
Forming Cup and Handle pattern.
Breakout from previous high.
Technically the chart is showing strength, if today it breakout at close 515, then, as per the "cup and handle" pattern, a target 620 is determined by measuring the distance between the bottom of the cup and the pattern’s breakout level and extending that distance upward from the breakout. Kindly note the upper trendline too.
