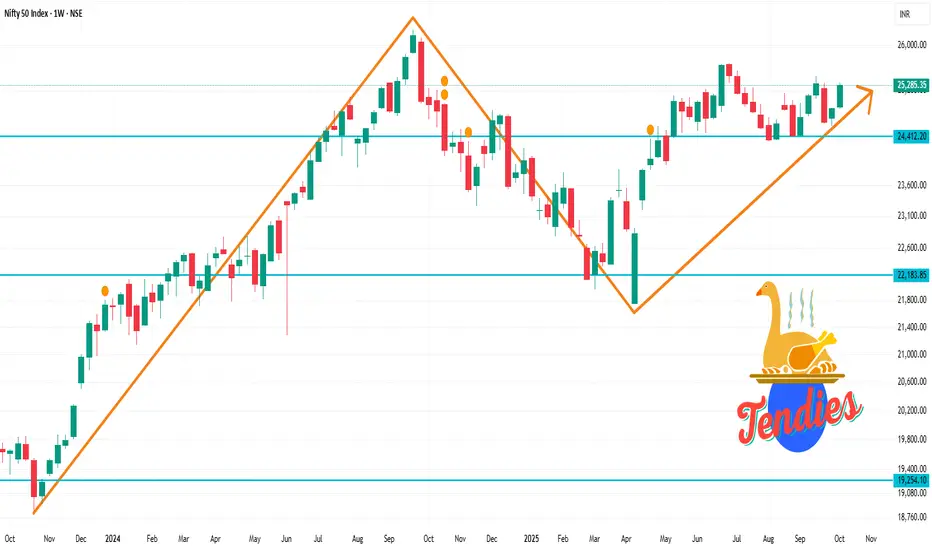
Nifty 50 1 Week time frame Key Technical Levels for the Week Ahead:
Resistance Levels:
25,000–25,100: This zone has been identified as a significant resistance area. A breakout above 25,100 could potentially lead to a rally towards 25,400.
Support Levels:
24,400–24,500: This range is considered a key support zone. A failure to hold above this level may indicate weakness in the index.
Analysts suggest that the Nifty 50 may trade within a defined range in the near term, with resistance expected around the 24,800 mark and strong support near the 200-day exponential moving average at 24,200.
Tariffs
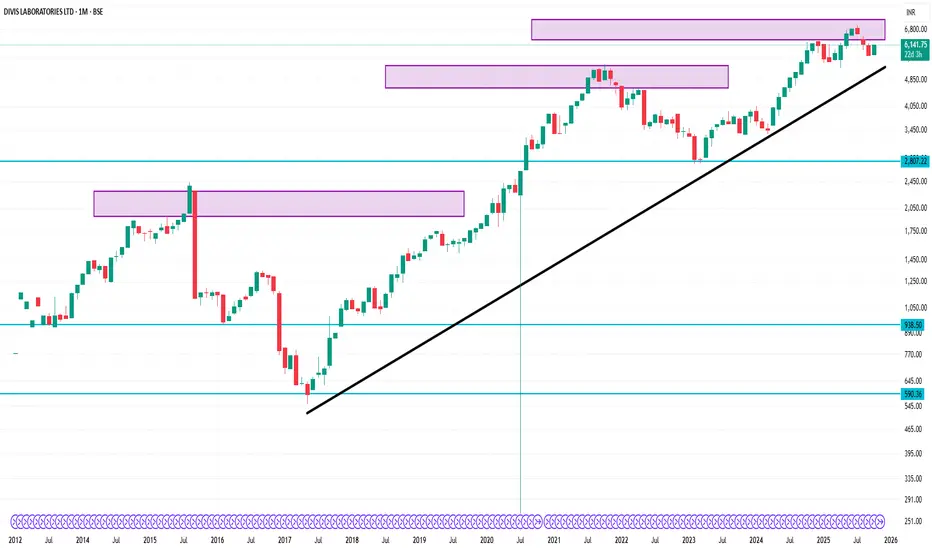
DIVISLAB 1 Month Time Frame 📈 1-Month Performance Snapshot (September 9 – October 9, 2025)
Opening Price (Sep 9, 2025): ₹6,025.00
Closing Price (Oct 9, 2025): ₹6,149.00
Price Change: +₹124.00 (+2.06%)
52-Week Range: ₹4,955.00 – ₹7,071.50
Current Price vs. 52-Week High: -12.98%
Current Price vs. 52-Week Low: +24.14%
Trading Volume (Oct 9): Approximately 129,890 shares
5-Day Moving Average: ₹6,128.00
20-Day Exponential Moving Average (EMA): ₹6,110.08
1-Month Return: +1.54%
📊 Recent Performance Highlights
October 8, 2025: Closed at ₹6,120.50 (+0.26%)
October 7, 2025: Closed at ₹6,104.50 (+4.77%)
October 6, 2025: Closed at ₹5,826.50 (-0.67%)
October 3, 2025: Closed at ₹5,866.00 (+2.73%)
October 1, 2025: Closed at ₹5,710.00 (+0.36%)
🧾 Key Financial Metrics
P/E Ratio (TTM): 70.29
EPS (TTM): ₹86.80
Market Capitalization: ₹1.62 trillion
Dividend Yield: 0.49%
Debt-to-Equity Ratio: 0.00 (indicating a debt-free status)
5 Defensive & Growth Sectors Perfect for Dip Buying1. Pharmaceuticals & Healthcare
Why It’s Defensive
Healthcare is a necessity, not a luxury. People need medicines, hospitals, and diagnostic services regardless of economic conditions. That’s why pharma and healthcare stocks are considered defensive – they remain resilient even during recessions, global slowdowns, or financial crises.
For example, during the COVID-19 crash of March 2020, while many sectors collapsed, pharma stocks quickly recovered and even surged due to global demand for medicines, vaccines, and hospital services.
Why It’s Growth-Oriented
Rising global healthcare spending: Aging populations in developed countries and increasing middle-class income in emerging markets boost demand.
Innovation in biotech & generics: Indian pharma companies are global leaders in generic drugs and are expanding into biosimilars, CRAMS (Contract Research and Manufacturing Services), and specialty medicines.
Telemedicine & digital health: Healthcare is undergoing digital transformation, creating new growth avenues.
Dip Buying Opportunities
Pharma stocks often face sharp corrections due to regulatory concerns, USFDA observations, or temporary pricing pressures. These dips are usually opportunities because:
Core demand for healthcare doesn’t vanish.
Once regulatory issues are resolved, stocks bounce back strongly.
Defensive nature ensures limited downside risk.
Example: Sun Pharma, Dr. Reddy’s, and Cipla often correct 15–20% due to quarterly margin pressures, but these are great accumulation zones for long-term investors.
Investment Strategy
Focus on large-cap pharma for stability and mid-cap specialty companies for higher growth.
Accumulate in phases during 10–20% marketwide corrections.
Diversify across hospitals, diagnostics, and pharma manufacturing for balanced exposure.
2. FMCG (Fast-Moving Consumer Goods)
Why It’s Defensive
FMCG companies sell essentials – food, beverages, personal care, and household products. Even in recessions, people continue buying soaps, biscuits, and packaged goods. This makes FMCG stocks highly resilient.
Historically, FMCG stocks like Hindustan Unilever (HUL), Nestlé, and Dabur have delivered steady returns regardless of market cycles. Their low volatility and strong brand loyalty make them classic defensive plays.
Why It’s Growth-Oriented
Rural consumption growth: Government spending on infrastructure and rising rural incomes increase demand for everyday goods.
Premiumization: Consumers are upgrading from basic to premium products.
Export opportunities: Many Indian FMCG firms are expanding into Southeast Asia, Africa, and the Middle East.
E-commerce & D2C channels: Online retail is boosting FMCG distribution and margins.
Dip Buying Opportunities
FMCG stocks rarely see sharp falls, but when markets correct heavily, they too trade at attractive valuations. These dips are perfect to accumulate:
High dividend yields add to returns.
Sector is less affected by inflation and currency swings.
Low-beta nature reduces portfolio volatility.
Example: ITC was ignored for years due to regulatory risks in its cigarette business, but patient investors who accumulated during dips saw multi-fold returns once FMCG growth kicked in.
Investment Strategy
Look for market leaders with strong distribution networks.
FMCG works best for long-term compounding, so use SIP-style accumulation.
Mix large brands (HUL, Nestlé) with emerging challengers (Marico, Emami).
3. Information Technology (IT) & Digital Services
Why It’s Defensive
At first glance, IT may not seem defensive, but global outsourcing and digitization trends provide resilience. Indian IT companies like TCS, Infosys, and HCL Tech derive a majority of revenues from recurring service contracts with global clients, ensuring steady cash flows.
Even during global slowdowns, IT spending often shifts from discretionary projects to cost-saving digital initiatives – keeping demand steady.
Why It’s Growth-Oriented
Digital transformation: Cloud computing, AI, data analytics, and cybersecurity are high-growth areas.
Global outsourcing demand: Companies worldwide seek cost efficiency, benefiting Indian IT firms.
New-age verticals: FinTech, healthtech, and e-commerce drive additional IT services demand.
High free cash flow: IT majors regularly return cash to shareholders through buybacks and dividends.
Dip Buying Opportunities
IT is cyclical and often corrects sharply when:
The US or Europe signals a slowdown.
Clients cut IT budgets temporarily.
Currency fluctuations impact quarterly results.
But these dips are ideal for accumulation because long-term demand for digitization is irreversible.
Example: During 2022, IT stocks corrected 30–40% due to global slowdown fears. Investors who accumulated Infosys and TCS during the correction are sitting on solid gains as digital spending picked up again.
Investment Strategy
Large-caps for stability (TCS, Infosys).
Mid-cap IT for higher growth (LTIMindtree, Persistent Systems).
Accumulate during 20–30% corrections in IT index.
Avoid chasing small-cap IT unless fundamentals are strong.
4. Banking & Financial Services
Why It’s Defensive
Banking is the backbone of any economy. Regardless of cycles, credit, deposits, and payments continue. In India, the financialization of savings and increasing credit penetration make banking a structural growth story.
Defensive elements include:
Strong regulatory framework by RBI.
Essential role in supporting all other industries.
Diversification across retail, corporate, and digital lending.
Why It’s Growth-Oriented
Credit expansion: India’s credit-to-GDP ratio is still low compared to global averages, leaving massive room for growth.
Digital finance: UPI, fintech partnerships, and mobile banking expand customer reach.
Insurance & asset management: BFSI sector is diversifying into wealth management and insurance.
Consolidation: Strong banks gain market share when weaker NBFCs or PSU banks face stress.
Dip Buying Opportunities
Banking stocks are volatile due to:
Rising interest rate cycles.
NPA concerns.
Global macroeconomic risks.
But dips often reverse quickly because banking demand is long-term.
Example: In 2020, HDFC Bank corrected sharply due to lockdown fears, but within a year, it made new highs as loan growth revived. Similarly, SBI’s turnaround post-2018 NPA cycle rewarded patient investors.
Investment Strategy
Private banks (HDFC Bank, ICICI Bank) for stability.
Select PSU banks (SBI, Bank of Baroda) during dip cycles.
NBFCs like Bajaj Finance for higher growth.
Accumulate gradually since BFSI can be volatile.
5. Energy & Power (with Renewable Focus)
Why It’s Defensive
Energy is a basic necessity. Industries, households, and transportation all rely on it. Demand for electricity, fuel, and energy infrastructure rarely collapses, making this sector defensive.
Why It’s Growth-Oriented
Renewable revolution: Solar, wind, and green hydrogen are the future, creating massive growth opportunities.
Government push: India targets net-zero emissions by 2070, meaning long-term policy support.
Rising demand: India’s power consumption grows consistently with urbanization and industrialization.
Energy diversification: Companies are shifting from traditional coal-based power to renewables, ensuring sustainability.
Dip Buying Opportunities
Energy and power stocks often correct due to:
Regulatory tariff changes.
Fuel cost fluctuations.
Global crude oil price swings.
But long-term demand remains intact, making dips valuable entry points.
Example: NTPC and Tata Power corrected during coal price hikes but bounced back as renewable capacity additions boosted valuations.
Investment Strategy
Balance between traditional leaders (NTPC, Power Grid) and renewable-focused players (Adani Green, Tata Power).
Accumulate during dips linked to global crude swings.
Long-term horizon needed, as renewable projects take time to scale.
How to Approach Dip Buying in These Sectors
Phased Buying: Don’t invest all at once. Break your investment into tranches and buy during market-wide or sector-specific corrections.
Valuation Discipline: Even defensive sectors can be overvalued. Wait for P/E multiples to come back to reasonable levels.
Diversification: Spread investments across all five sectors to balance risk and growth.
Use ETFs/Mutual Funds: If stock-picking is tough, sectoral ETFs or actively managed funds provide easier access.
Stay Patient: Dip buying works when you hold through recovery cycles. Avoid panic selling.
Conclusion
Market dips are uncomfortable but essential for building wealth. Instead of fearing corrections, smart investors use them to accumulate quality sectors. The five sectors we discussed – Pharma & Healthcare, FMCG, IT & Digital Services, Banking & Financials, and Energy with Renewables – combine the best of both worlds: resilience during downturns and strong growth potential during expansions.
By adopting a disciplined dip-buying approach, investors can build a portfolio that not only weathers volatility but also compounds steadily over time. Remember, corrections are temporary, but the growth stories of these defensive sectors are structural and long-term.
If you position yourself well, every market dip can become your wealth-building opportunity.

XAU/USD – FED, Tariffs & NFP Today | Captain Vincent🔎 Captain’s Log – Context & News
The probability of a FED rate cut in September has risen to 99.4% (from 96.6%) → almost certain.
FED’s Cook is under fraud investigation , combined with weak prior economic data → further strengthens momentum for Gold.
US–Japan deal : US reduces chip import tariffs to 15%, in return Japan invests 550B USD + purchases 8B USD in agricultural products. Although positive, it does not change the main outlook as markets remain focused on interest rates & inflation.
Trump : Threatens tariffs on all chip/semis companies not entering the US → raises geopolitical concerns.
NFP & Unemployment Rate (UR) tonight at 19:30 → key event, may trigger strong volatility.
⏩ Captain’s Summary:
Capital flow still leans towards BUY Gold thanks to FED rate cut expectations, but short-term shakeouts may occur before/after the news.
📈 Captain’s Chart – Technical Analysis
M30 BOS: Gold has just formed a Break of Structure, overall trend remains bullish.
Captain’s Shield (Support): 3484 – 3486 (Main Buy Zone).
Storm Breaker (Resistance): 3575 – 3593 (aligned with Fibo 0.5 – 0.618).
If it breaks 3591 – 3593 → pathway to new ATH 3608 – 3610 or higher.
If it fails at Storm Breaker → price may retest Golden Harbor (3484) before bouncing back.
🎯 Captain’s Map – Trade Scenarios
✅ Golden Harbor (BUY – Priority)
Entry: 3484 – 3486
SL: 3478
TP: 3490 → 3493 → 3497 → 3505 → 35xx
⚡ Quick Boarding (SELL Scalp – Short-term)
Entry: 3575 – 3577
SL: 3585
TP: 3570 → 3565 → 3560 → 3555 → 35xx
🌊 Storm Breaker (SELL Zone – Resistance)
Entry: 3591 – 3593
SL: 3600
TP: 3588 → 3585 → 3580 → 3575 → 35xx
⚓ Captain’s Note
“The Golden ship sails smoothly as FED is almost certain to cut rates in September. Golden Harbor 🏝️ (3484) is the safe anchorage to continue riding the bullish tide. Storm Breaker 🌊 (3575–3593) may create big waves for short Quick Boarding 🚤 , but the main current still carries us North.”

How to Read Price ActionIntroduction
Price Action (PA) is the art and science of reading market movement directly from price charts, without over-reliance on lagging indicators. Professional traders, institutional players, and prop firms often emphasize price action because it reflects the pure psychology of buyers and sellers.
Unlike trading based on technical indicators, price action trading relies on raw market data: candlesticks, support & resistance levels, chart structures, and volume context.
Learning to read price action is like learning a new language — once you master it, you can understand what the market is saying at any given moment.
Chapter 1: What is Price Action?
Price Action refers to analyzing the actual price movement of a financial instrument over time.
It does not depend on moving averages, oscillators, or complex indicators.
It studies patterns, trends, support/resistance zones, candlestick formations, and order flow behavior.
The ultimate goal is to understand the story behind each price move: who is in control (buyers or sellers), and where the next move might head.
Key Idea: Price action is the footprint of money. When large institutions buy or sell, they leave traces on the chart — PA traders learn to read these footprints.
Chapter 2: Why Read Price Action?
Clarity – It removes clutter from charts.
Universal Language – Works across all markets (stocks, forex, commodities, crypto).
Flexibility – Adapts to all timeframes, from scalping 1-min charts to investing on weekly charts.
Real-Time Decisions – Price action reacts instantly, unlike lagging indicators.
Psychology-Based – Helps traders understand market sentiment: fear, greed, indecision.
Chapter 3: Core Building Blocks of Price Action
Before diving into strategies, you need to master the foundations:
3.1 Candlesticks
Candlesticks are the backbone of price action. Each candle tells a story:
Open, High, Low, Close (OHLC) show how price moved within that time frame.
Long wicks = rejection.
Long body = strong momentum.
Small body = indecision.
3.2 Market Structure
Higher Highs & Higher Lows (HH, HL) = Uptrend.
Lower Highs & Lower Lows (LH, LL) = Downtrend.
Sideways movement = Consolidation.
3.3 Support and Resistance (S/R)
Support: A price level where buying pressure often appears.
Resistance: A price level where selling pressure often emerges.
These zones are not exact prices, but areas.
3.4 Trendlines & Channels
Connecting swing highs/lows creates visual guides.
Channels highlight when price is moving within a range.
3.5 Volume (Optional but Powerful)
Volume confirms price moves — high volume validates breakouts, while low volume signals weak trends.
Chapter 4: Candlestick Price Action Patterns
4.1 Reversal Patterns
Pin Bar (Hammer, Shooting Star): Signals rejection at support/resistance.
Engulfing Candle: Strong shift in momentum (bullish or bearish).
Morning Star / Evening Star: Trend reversal confirmation.
4.2 Continuation Patterns
Inside Bar: Market is pausing; breakout is likely.
Flag & Pennant: Small correction before continuation.
Marubozu: Strong conviction candle.
4.3 Indecision Patterns
Doji: Balance between buyers and sellers.
Spinning Top: Low conviction, sideways market.
Lesson: Candlestick patterns only matter in the right context (support, resistance, trend zones).
Chapter 5: Understanding Market Phases
Price moves in cycles:
Accumulation Phase: Smart money buys quietly, market moves sideways.
Markup Phase: Strong uptrend begins (higher highs & higher lows).
Distribution Phase: Smart money sells to late buyers, price moves sideways again.
Markdown Phase: Downtrend begins (lower highs & lower lows).
Price action traders learn to spot transitions between phases.
Chapter 6: Reading Trends
Uptrend: Look for buying opportunities on pullbacks.
Downtrend: Look for selling opportunities on retracements.
Range-bound: Focus on support/resistance rejections.
Golden Rule: Trade with the trend until price clearly shows reversal signs.
Chapter 7: Breakouts & Fakeouts
Breakout: Price moves beyond key support/resistance with momentum.
Fakeout (False Break): Price breaks a level but quickly reverses.
Pro Tip: Watch volume + candle close for real confirmation.
Chapter 8: Price Action Trading Strategies
Here are practical strategies traders use:
8.1 Breakout Trading
Identify consolidation → Wait for breakout → Enter with momentum.
Example: Range breakout, Triangle breakout.
8.2 Pullback Trading
Enter in the direction of trend after a retracement.
Example: Price bounces off support in uptrend.
8.3 Reversal Trading
Spot exhaustion patterns (Pin Bars, Engulfing) near major S/R zones.
Requires patience and confirmation.
8.4 Supply and Demand Zones
Supply = institutional sell zones.
Demand = institutional buy zones.
Price often reacts strongly when revisiting these levels.
Chapter 9: The Psychology Behind Price Action
Every candle reflects human psychology:
Long bullish candle: Strong buyer confidence.
Long bearish candle: Panic selling or strong bearish conviction.
Doji: Confusion / indecision.
Breakouts: Fear of missing out (FOMO) + herd mentality.
Price action is a visual representation of trader emotions.
Chapter 10: Common Mistakes in Reading Price Action
Overcomplicating the chart – Too many lines, patterns, or zones.
Ignoring market context – A bullish candle in a downtrend is weak.
Chasing trades – Entering late after breakout.
Forcing patterns – Seeing patterns that don’t exist.
Neglecting risk management – PA gives entries, but stops are crucial.
Conclusion
Reading price action is not about memorizing patterns, but understanding the story behind the charts. It’s about seeing the battle between buyers and sellers and aligning with the winning side.
Once you master candlesticks, support/resistance, trends, and psychology, price action becomes a powerful weapon that can work in any market, on any timeframe.
The path is long, but with discipline, patience, and practice, you can become fluent in the language of price action.
Difference Between Investing and TradingIntroduction
In the world of finance, two of the most common approaches people take to grow their wealth are investing and trading. At first glance, these two activities may look similar—both involve putting money into financial instruments like stocks, bonds, mutual funds, or derivatives with the aim of making a profit. However, when we look deeper, the philosophies, time horizons, risk appetites, strategies, and outcomes of investing and trading are very different.
To put it simply:
Investing is about building wealth steadily over time, often with a long-term horizon.
Trading is about taking advantage of short-term opportunities in the market to generate quick returns.
Understanding the difference is essential because choosing the wrong path for your personality, goals, and risk tolerance can not only hurt your financial performance but also cause emotional stress.
This essay will take you through a detailed journey into what investing and trading mean, their similarities, differences, strategies, risks, psychology, and real-world examples, so you can decide which path (or combination) best suits you.
What is Investing?
Investing is the act of committing money for the long term with the expectation of receiving returns in the future. Investors typically focus on assets that are expected to grow steadily over years or decades, such as:
Stocks (Equities) – Shares in companies that appreciate over time and may pay dividends.
Bonds – Fixed-income securities that provide interest.
Mutual Funds/ETFs – Diversified portfolios managed by professionals.
Real Estate – Property investments that generate rental income and appreciate.
Commodities & Precious Metals – Gold, silver, etc., often used as hedges.
The core philosophy of investing is wealth accumulation through compounding. Albert Einstein famously called compounding the "eighth wonder of the world," and investors rely on this principle.
For example:
If you invest ₹1,00,000 at a 12% annual return (average Indian equity market return), in 20 years it grows to over ₹9,64,000. That’s the power of compounding without needing to buy and sell constantly.
Types of Investing
Value Investing – Buying undervalued stocks (e.g., Warren Buffett).
Growth Investing – Focusing on high-growth companies (e.g., tech firms).
Dividend Investing – Choosing companies with steady dividend payouts.
Index/Passive Investing – Investing in index funds for market-average returns.
Mindset of an Investor
Patient, long-term focused.
More concerned with company fundamentals than short-term price moves.
Sees market downturns as opportunities.
“Buy and hold” is the mantra.
What is Trading?
Trading is the act of buying and selling financial instruments within shorter timeframes to capture profits from market fluctuations. Unlike investing, traders don’t usually care about the long-term potential of an asset; they focus on short-term movements driven by demand-supply, news, or technical patterns.
Common Trading Styles
Scalping – Holding positions for seconds to minutes.
Day Trading – Buying and selling within a single trading day.
Swing Trading – Holding for days or weeks to capture medium-term trends.
Position Trading – Holding for weeks to months (a mix between trading and investing).
Tools Traders Use
Technical Analysis: Chart patterns, indicators (RSI, MACD, Bollinger Bands).
Volume Analysis: Understanding buying/selling pressure.
News & Events: Earnings announcements, Fed decisions, global crises.
Risk Management: Stop-loss, position sizing, leverage control.
Mindset of a Trader
Short-term profit focused.
Quick decision-making and adaptability.
High tolerance for risk and volatility.
Needs discipline and emotional control.
Strategies in Investing vs Trading
Investing Strategies
Buy and Hold – Holding quality stocks for decades.
SIP (Systematic Investment Plan) – Regular investments in mutual funds.
Portfolio Diversification – Reducing risk by spreading across assets.
Rebalancing – Adjusting portfolio periodically.
Trading Strategies
Momentum Trading – Riding strong trends.
Breakout Trading – Entering when price breaks support/resistance.
Mean Reversion – Betting price will revert to its average.
Options Strategies – Using derivatives like straddles, spreads, iron condors.
Risks in Investing vs Trading
Investing Risks
Market crashes (e.g., 2008, 2020).
Inflation risk eroding returns.
Poor stock selection (choosing weak companies).
Overconcentration in one asset.
Trading Risks
High volatility losses.
Leverage amplifying both gains and losses.
Overtrading and emotional decisions.
Sudden news shocks (war, government bans).
Key difference: Investors lose slowly, traders can lose instantly.
Psychology of Investing vs Trading
Investor Psychology: Requires patience, belief in long-term growth, ability to ignore short-term volatility. Successful investors avoid panic-selling.
Trader Psychology: Requires emotional discipline, quick thinking, sticking to risk limits, and accepting frequent small losses. Greed and fear are dangerous here.
Both require discipline, but in different ways.
Case Studies
Case Study 1: Investor Success
Warren Buffett invested in Coca-Cola in 1988.
Initial investment: $1.3 billion.
Today’s value: Over $25 billion plus billions in dividends.
Lesson: Patience and compounding create massive wealth.
Case Study 2: Trader Success
Paul Tudor Jones, a famous trader, predicted the 1987 crash.
He shorted the market and earned around $100 million in one day.
Lesson: Quick action, timing, and risk management can lead to big rewards.
Case Study 3: Investor Loss
Many who invested in companies like Enron or Yes Bank without research faced near-total losses.
Case Study 4: Trader Loss
Retail traders using high leverage during COVID crash wiped out accounts overnight.
Which is Better – Investing or Trading?
There’s no universal answer—it depends on your goals:
If you want steady long-term wealth → Choose Investing.
If you want active income and thrill → Choose Trading (but master risk control).
Many professionals do a mix: 80% long-term investing, 20% trading for extra income.
Conclusion
The difference between investing and trading lies in time horizon, mindset, risk tolerance, and strategy. Investing is like planting a tree and waiting for it to grow into a forest. Trading is like surfing waves—you ride them quickly, but must always be alert.
Both paths can be profitable, but both come with risks. The key is knowing yourself: Are you patient and disciplined for long-term gains, or energetic and risk-tolerant for short-term opportunities?
Ultimately, wealth creation often comes from investing, while trading can generate active cash flow if done with discipline. The wisest approach may be blending the two—secure your future with investments, and fuel your present with well-managed trading.
PCR Trading StrategyMoneyness of Options
Moneyness shows whether the option has intrinsic value:
In the Money (ITM): Already profitable if exercised.
At the Money (ATM): Strike price = market price.
Out of the Money (OTM): No intrinsic value, only time value.
Factors Affecting Option Prices (Option Greeks)
Options are influenced by multiple factors:
Delta: Sensitivity to underlying price changes.
Gamma: Sensitivity of Delta.
Theta: Time decay – options lose value as expiry nears.
Vega: Sensitivity to volatility.
Rho: Sensitivity to interest rates.
Payoff Profiles
Buyer of Call/Put: Limited loss (premium), unlimited profit.
Seller of Call/Put: Limited profit (premium), unlimited or large risk.

Paer 6 Learn Institutional Trading Options Trading Strategies
Basic Strategies
Long Call → Buy call, bullish.
Long Put → Buy put, bearish.
Covered Call → Own stock + sell call for income.
Protective Put → Own stock + buy put for protection.
Intermediate Strategies
Straddle: Buy Call + Put at same strike (bet on volatility).
Strangle: Buy Call (higher strike) + Put (lower strike).
Bull Call Spread: Buy low strike call + sell higher strike call.
Bear Put Spread: Buy put + sell lower strike put.
Advanced Strategies
Iron Condor: Range-bound strategy selling OTM call + put spreads.
Butterfly Spread: Profit from low volatility near strike.
Ratio Spreads: Adjust risk/reward with multiple options.
Margin Requirements & Leverage
Option buyers: Pay only premium (small capital).
Option sellers (writers): Need large margin (higher risk).
NSE SPAN + Exposure margin system determines requirements.
For example, selling 1 lot of Bank Nifty option may require ₹1.5–2 lakh margin depending on volatility.

Part 2 Support And ResistanceHow Options Work in Trading
Imagine a stock is trading at ₹1,000.
You believe it will rise to ₹1,100 in a month. You could:
Buy the stock: You need ₹1,000 per share.
Buy a call option: You pay a small premium (say ₹50) for the right to buy at ₹1,000 later.
If the stock rises to ₹1,100:
Stock profit = ₹100
Call option profit = ₹100 (intrinsic value) - ₹50 (premium) = ₹50 net profit (but with much lower capital).
This leverage makes options attractive but also risky — if the stock doesn’t rise, your premium is lost.
Categories of Options Strategies
Options strategies can be divided into three main categories:
Directional Strategies – Profit from price movements.
Non-Directional (Neutral) Strategies – Profit from sideways markets.
Hedging Strategies – Protect existing positions.

INDIA VOLATILITY INDEXHello & welcome to this analysis
On the eve of FOMC meet tonight, India VIX is surprisingly muted despite the Middle East crises and the threat of further Tariff war.
A declining to muted volatility index is overall bullish for equities but not so much for OPTION buyers as movements are either staggered or sideways in the index (Nifty has been sideways since MAY 15) as stock specific action takes place.
As long as VIX remains below 15 it could further slide down towards 13.25 and below that 12 where we have several cases of VIX bottoming and Index topping out. Above 15 it could take a dash for 17.
if VIX continues to decline then option trend buying would be better off with strategies where one can hedge to reduce cost. Also keep in mind as it continues to slide down OTM premiums will remain low that might make your winning % higher but yields much lower in OTM strangles.
All the best

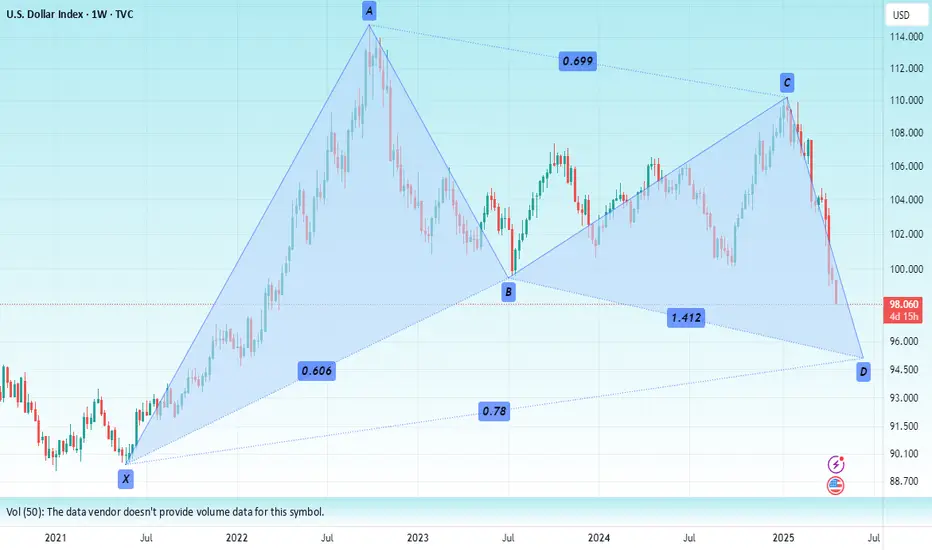
Dollar IndexHello & welcome to this analysis
Current decline in DXY could still continue all the way till 95 where it has a Bullish Harmonic Gartley.
At the current moment big resistance at 99-100, only above that a move towards 101.50 & then 1003
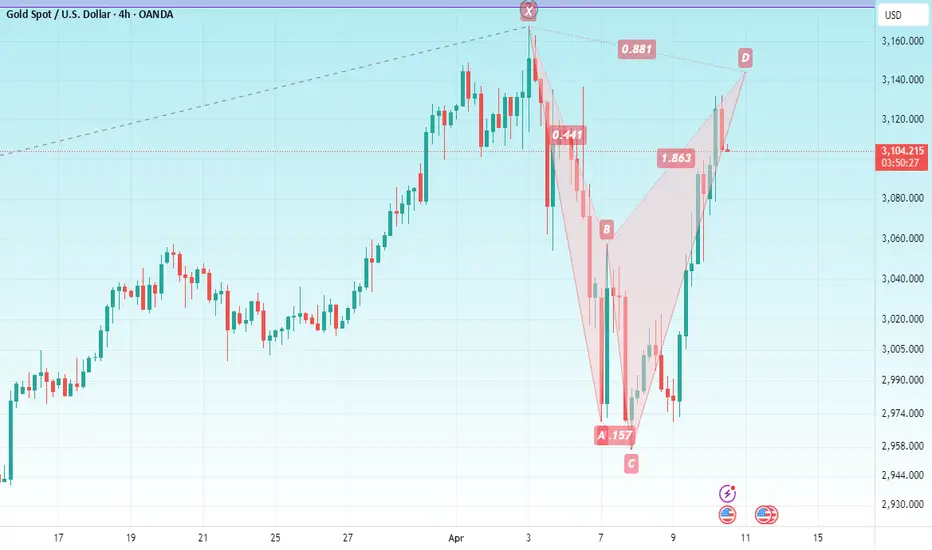
GOLDHello & welcome to this analysis
GOLD (Comex) 4hrs is going to enter the potential reversal zone of a bearish Harmonic Shark pattern between $3135 - $3155. Pattern negates above $3167.
Probable retracement levels $3100 / $ 3075 / $3025 / 2950
If it sustains above $3170-$3200 it gets v strong and will attempt $3300
Gold Hits Another Record II U.S. Tariff Plan II Daily Analysis🔥 Fundamental Analysis :
⚡Gold rose to $3,164 per ounce, a new record high as risk aversion increased following President Trump's tariff announcement.
⚡Trump outlined a 10% baseline tariff on imports from all countries, with higher rates for nations with trade surpluses, including China (34%), the EU (20%), and Japan (24%), and a 25% tariff on foreign-made automobiles.
⚡ All eyes are on the U.S. non-farm payrolls report, due Friday, for further clues on the Federal Reserve's monetary policy path.
Technical Analysis:
1. New All-Time High:
The price reached 3,168 USD, marking a new all-time high.
However, the price has slightly retraced after hitting this level.
2. Fibonacci Levels:
• 1st Fib Level: 3,183 USD – Potential resistance.
• 2nd Fib Level: 3,206 USD – Further resistance if the bullish momentum continues.
3. Support & Resistance Zones:
• Green Zone (~3,135 - 3,138 USD): Previously a resistance, now acting as support.
• Another support near 3,124 USD.
• Resistance Levels:
• 3,168 USD: (All-time high) – If broken, could push the price towards the Fibonacci targets.
4. Moving Averages:
• Red Line (Likely 50 EMA): Trending upwards, supporting price action.
• Blue Line (Likely 200 EMA): Positioned lower, indicating that the trend remains bullish as long as price stays above.
5. Trend Analysis:
• Bullish Breakout: The price broke out of a previous range and surged to a new high.
• Potential Retest: Price might revisit the 3,135 - 3,138 support zone before another leg up.
Trading Considerations:
• Bullish Case: If price consolidates above 3,135-3,138, it could retest 3,168 and move towards 3,183 or 3,206.
• Bearish Case: A break below 3,135 could push price back towards 3,124 or lower.
• Risk Management: Place stop losses below key support zones if entering long positions.
👉 Always follow TP/SL to protect your capital and maximize profits!
Stay tuned for updates once the confirmations are in place!
Please support me with your likes and comments to motivate me to share more analysis with you and share your opinion about the possible trend of this chart with me !
📢Best Regards , Silver Wolf Traders Community
Disclaimer: This is for educational purposes only.
Always trade responsibly and manage your risk effectively

BSL TRADE DONEBSL ALL TARGET HIT IN THREE DAYS
I SHARED THIS IDEA ON TRADING VIEW
AND SEE THE RESULT
please do follow for upcoming learning ideas
