Long Term Investment What is Bank Nifty (for long-term view)
Nifty Bank tracks India’s top banking stocks (HDFC Bank, ICICI Bank, SBI, Axis, etc.).
It’s:
🚀 High growth–oriented
📉 More volatile than Nifty 50
💰 Strongly linked to credit growth, interest rates, and the economy
Long-term verdict:
Great for growth if you can tolerate volatility.
Best ways to invest in Bank Nifty for the long term
1️⃣ Bank Nifty Index Mutual Funds (BEST for most people)
Passive funds that track Bank Nifty
Ideal for SIP + long horizon (7–10+ years)
Why this works
No stock picking risk
Lower expense ratio
Automatic rebalancing
👉 Suitable if you want set it and forget it
Tata

TATAGOLD What next do1. Over the last 3 months, the NAV of Tata Gold ETF rose from roughly ₹ ~10.20–10.90 (around early September 2025) to around ₹ 12.50 by early December 2025.
2. That implies a 3-month return of roughly +20–23%, which matches published data showing ~23-24% 3-month return.
3. The 52-week low was ~₹ 7.11 and high ~₹ 14.00 (or near that) — showing that the price nearly doubled from the low earlier in the 12-month period.
4. Recent momentum looks strong: after rising steadily from September to November, the ETF has seen consolidation around ₹12.4–12.6 levels in late November / early December — perhaps reflecting some profit booking or market hesitation

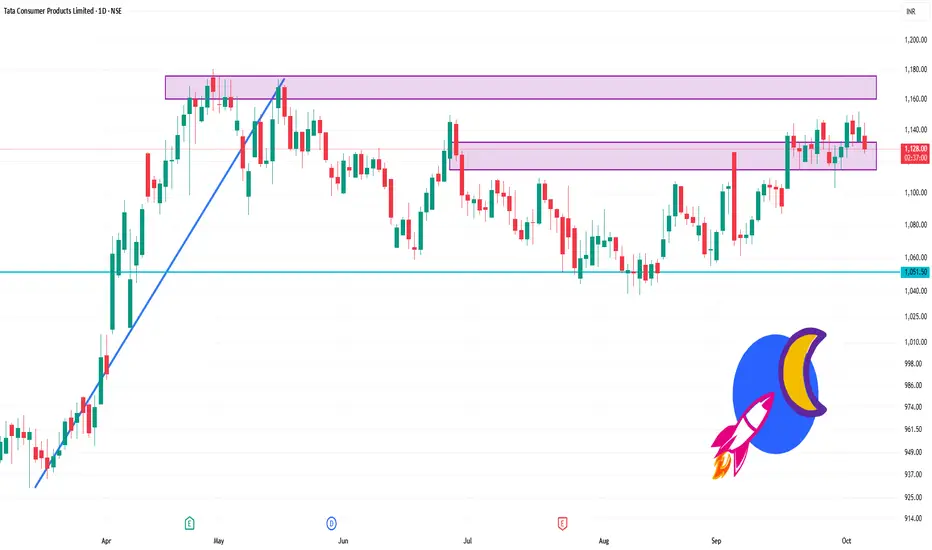
TATACONSUM 1 Day Time Frame 📊 Daily Support & Resistance Levels
Immediate Support: ₹1,112.57
Strong Support: ₹1,098.85
Resistance Levels: ₹1,154.75 → ₹1,182.65 → ₹1,210.60 → ₹1,238.50
🔄 Pivot Points & Fibonacci Levels
Pivot Point: ₹1,142.13
Resistance (R1–R4): ₹1,151.97 → ₹1,161.83 → ₹1,171.67 → ₹1,181.50
Support (S1–S4): ₹1,132.27 → ₹1,122.43 → ₹1,112.57 → ₹1,102.73
📈 Technical Indicators
Trend: Bullish on the long-term chart, neutral on the mid-term, and bullish on the short-term chart.
Resistance Levels: ₹1,144.80 → ₹1,168.90 → ₹1,168.00
Support Levels: ₹1,105.30 → ₹1,046.80 → ₹1,024.65
📌 Summary
Bullish Scenario: A breakout above ₹1,154.75 could target ₹1,182.65 and higher levels.
Bearish Scenario: A decline below ₹1,112.57 may lead to further support at ₹1,098.85.
Tata Steel trend line and 1 year resistance breakout Tata steel is gonna give a breakout soon, as it has been in a continuous up trend, reaching 1 year resistance and broken it, it can give from 10-20 % profit from here in short term .
Buy around - 172- 173
Target - 207
Duration - 2-3 months
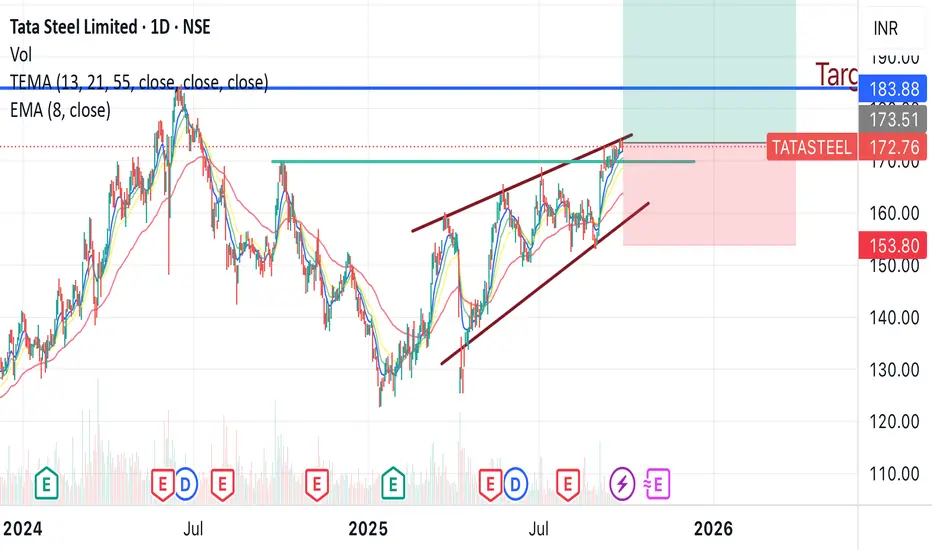
Tata SteelTata Steel in the verge of the breakout. Can go long. If it breaks the channel on the upside. and commodity is cycle business it needs other global market support.
Wait for breakout or breakdown.
This is for educational purposes

Relative Strength Index (RSI) in Trading1. Introduction to RSI
The financial markets operate on the constant tug-of-war between buyers and sellers. Traders have long sought tools to identify when markets are likely to reverse or continue trending. Among the most widely used technical indicators is the Relative Strength Index (RSI), a momentum oscillator developed to measure the speed and magnitude of recent price movements.
The RSI is not just a number; it’s a psychological mirror of the market, showing when traders may be overenthusiastic (overbought) or overly fearful (oversold). Since its introduction in 1978 by J. Welles Wilder Jr., RSI has become a cornerstone of technical analysis, used by retail traders, institutional investors, and even algorithmic systems across stocks, forex, commodities, and crypto.
2. History & Origin of RSI
RSI was introduced in Wilder’s famous book “New Concepts in Technical Trading Systems” (1978), alongside other indicators like the Average True Range (ATR) and Parabolic SAR. Wilder, a mechanical engineer turned trader, believed in quantifying market psychology.
Before RSI, momentum indicators existed, but they lacked a standardized scale. Wilder’s breakthrough was normalizing momentum into a range between 0 and 100, making it universally applicable and easier to interpret. Over time, RSI’s simplicity and adaptability allowed it to transcend asset classes, from Dow Jones stocks in the 80s to Bitcoin and Ethereum today.
3. Mathematical Formula & Calculation
The RSI formula is:
𝑅
𝑆
𝐼
=
100
−
(
100
1
+
𝑅
𝑆
)
RSI=100−(
1+RS
100
)
Where:
RS (Relative Strength) = Average Gain / Average Loss (over a set period, usually 14)
Steps:
Calculate the average of “up closes” and “down closes” for 14 periods.
Divide average gain by average loss = RS.
Plug RS into the RSI formula to scale between 0–100.
Example:
Average Gain = 1.5%
Average Loss = 0.75%
RS = 1.5 / 0.75 = 2
RSI = 100 – = 66.6
Thus, RSI = 67 indicates bullish momentum but not yet overbought.
4. Understanding RSI Levels
Above 70 → Overbought (possible correction)
Below 30 → Oversold (possible rebound)
Around 50 → Neutral (balance between buyers & sellers)
Some traders adjust:
80/20 levels for stronger trends
60/40 levels in trending markets (RSI may not touch extremes often)
RSI levels act as zones of probability, not absolute buy/sell signals.
5. RSI in Different Market Conditions
Trending Markets: RSI can remain overbought (>70) or oversold (<30) for extended periods. For example, in strong bull runs, RSI may hover around 70–80.
Ranging Markets: RSI oscillates smoothly between 30 and 70, making it excellent for mean-reversion strategies.
Volatile Markets: RSI signals can be whipsawed, requiring filters like moving averages or multiple timeframe confirmations.
6. RSI Trading Strategies
a) Overbought & Oversold Strategy
Buy when RSI < 30 (oversold) and price shows reversal.
Sell when RSI > 70 (overbought) and reversal signs appear.
Works best in sideways markets.
b) Divergence Strategy
Bullish Divergence: Price makes lower lows, RSI makes higher lows → reversal likely upward.
Bearish Divergence: Price makes higher highs, RSI makes lower highs → reversal likely downward.
c) RSI Swing Rejections
A method Wilder emphasized:
Bullish: RSI goes below 30, bounces back, rejects a second drop, then crosses above previous high.
Bearish: RSI goes above 70, falls, rejects second rise, then breaks lower.
d) RSI Trendlines & Breakouts
Traders draw trendlines on RSI itself, treating it like a price chart. Breakouts often lead price action.
e) RSI + Moving Averages
Use RSI to confirm MA crossovers. Example: RSI > 50 when 50-day MA crosses above 200-day MA strengthens bullish trend.
7. RSI for Different Timeframes
Intraday/Scalping (1–5 min): RSI is very sensitive. Traders use shorter settings (7-period RSI).
Swing Trading (1D–1W): Classic 14-period RSI works well. Divergences are powerful.
Long-Term Investing (1M): RSI identifies market cycles; buying when RSI < 30 on monthly charts often captures generational opportunities.
8. Combining RSI with Other Indicators
a) RSI + MACD
MACD confirms trend direction; RSI signals entry/exit.
Example: MACD bullish crossover + RSI near 40–50 = strong buy signal.
b) RSI + Bollinger Bands
RSI overbought + price at upper band → higher reversal probability.
RSI oversold + price at lower band → bounce likely.
c) RSI + Volume Profile
High volume at RSI extremes confirms stronger reversals.
d) RSI + Moving Averages
RSI trending above 50 while price is above MA = bullish confirmation.
Conclusion
The Relative Strength Index (RSI) remains one of the most effective momentum oscillators in trading history. From J. Welles Wilder’s manual calculations in the 70s to modern-day algorithmic applications, RSI has proven its adaptability.
Its power lies not in blindly buying at 30 or selling at 70, but in understanding context, divergences, swing rejections, and market psychology. While it has limitations in trending markets, when combined with other tools, RSI becomes a formidable ally.
For traders, RSI is more than a number. It’s a window into collective human behavior, showing how emotion, momentum, and probability interact to move markets. Whether you’re day-trading forex, swing-trading stocks, or investing in crypto, RSI remains a timeless guide to navigating uncertainty.
India Growth Super CycleIntroduction
The term “super cycle” is often used in economics and markets to describe long, sustained phases of growth that fundamentally reshape nations, sectors, or entire economies. Unlike short-term booms, which last for a few years, super cycles stretch over decades, powered by structural changes in demographics, productivity, capital inflows, consumption patterns, and policy frameworks.
In recent years, global analysts, economists, and investors have increasingly argued that India is entering a growth super cycle, a once-in-a-generation period of accelerated economic transformation. With its massive young population, rapidly growing middle class, digital adoption at scale, strong domestic demand, manufacturing push, energy transition, and global realignment of supply chains, India is set to emerge as one of the world’s leading growth engines through the 21st century.
This essay explores the concept of India’s growth super cycle in detail—its drivers, opportunities, risks, and implications.
1. Understanding the Super Cycle Phenomenon
A super cycle is not just about GDP numbers growing faster than average. It involves multi-decade, structural shifts that create sustained momentum. Historically, countries like Japan (1950s–1980s), China (1990s–2010s), and the United States (post-WWII industrial boom) experienced such cycles.
Common traits of super cycles include:
Demographic dividend (young, working population)
Industrial and manufacturing expansion
Technological transformation
Rising household incomes and consumption
Strong infrastructure development
Capital inflows and foreign investments
Integration with global trade and supply chains
India in 2025 finds itself at the cusp of these very trends, making the argument for a “India Growth Super Cycle” stronger than ever.
2. India’s Macroeconomic Context
India’s economic fundamentals provide a strong foundation:
GDP Size: $4.2 trillion (2025 est.), making India the 5th largest economy in the world.
Growth Rate: Consistently between 6–8% annually, far outpacing developed markets.
Population: 1.43 billion (2025), the largest in the world, with a median age of 28 years.
Domestic Demand: Household consumption accounts for ~60% of GDP, creating resilience.
External Strength: Forex reserves of $650+ billion provide stability against global shocks.
Digital Economy: The rise of UPI, digital payments, and e-commerce has accelerated financial inclusion.
These metrics underline why global investors increasingly see India as the next growth story after China.
3. Key Drivers of India’s Growth Super Cycle
a. Demographic Dividend
65% of India’s population is below 35 years.
Working-age population will continue to rise until 2040, providing decades of labor supply.
Young population = higher productivity, rising consumption, and entrepreneurial dynamism.
b. Rising Middle Class & Consumption Boom
By 2030, India’s middle class is projected to double to 600 million people.
Per capita income, currently around $3,000, could rise to $6,000–7,000 by 2035.
Rising disposable income will fuel demand for housing, automobiles, travel, healthcare, and education.
c. Digital Transformation
UPI transactions exceed 12 billion per month (2025).
India is creating the world’s largest digital public infrastructure—from Aadhaar to ONDC.
Rapid digitalization is boosting financial inclusion, formalization, and productivity across sectors.
d. Manufacturing & Supply Chain Realignment
China+1 strategy by global firms is shifting investments to India.
“Make in India” and Production Linked Incentives (PLI) schemes support electronics, EVs, semiconductors, and defense manufacturing.
Sectors like smartphones, textiles, chemicals, and pharmaceuticals are becoming export powerhouses.
e. Infrastructure Build-Out
National Infrastructure Pipeline: $1.4 trillion planned investment in roads, railways, ports, and urban projects.
Rapid expansion of airports, highways, and metro systems.
Energy transition projects targeting 500 GW renewable capacity by 2030.
f. Financial Sector Deepening
Credit penetration is still low (~55% of GDP), leaving room for massive expansion.
Equity markets are vibrant: India is the world’s 4th largest stock market by market cap.
Banking system has largely cleaned up post-NPA crisis, improving credit growth.
g. Global Geopolitical Realignment
Rising US-China tensions position India as a neutral, attractive investment destination.
Strategic partnerships with US, EU, Japan, and ASEAN create access to markets and capital.
India’s leadership in the Global South increases its geopolitical leverage.
4. Sectoral Engines of Growth
i. Technology & Digital Services
IT services exports already exceed $250 billion annually.
AI, cloud computing, cybersecurity, and data analytics open new frontiers.
India is home to the world’s third-largest startup ecosystem.
ii. Manufacturing & Industrial Growth
Electronics manufacturing projected to reach $300 billion by 2026.
Defense manufacturing, steel, cement, and EVs driving industrial demand.
India could become the global hub for pharmaceuticals and generics.
iii. Green Energy & Sustainability
Solar, wind, hydrogen, and EVs present trillion-dollar opportunities.
India’s climate commitments are attracting green financing and ESG investments.
iv. Financial Services & Capital Markets
Expanding insurance, mutual funds, and retail stock participation.
Credit growth at double-digit rates, driven by MSMEs and consumption loans.
Potential to become a global hub for fintech and digital banking.
v. Real Estate & Urbanization
By 2035, 600 million people will live in cities.
Housing demand, smart cities, and commercial real estate to boom.
5. The Long-Term Investment Case
Global investors view India as a multi-decade compounding story:
Stock Markets: India’s equity markets have delivered ~11% CAGR over 20 years, among the best globally.
FDI Flows: Averaging $60–70 billion annually, with new highs expected as supply chains shift.
Bond Markets: India’s entry into global bond indices in 2025 is likely to bring $25–30 billion annual inflows.
For long-term investors, the growth super cycle offers exposure across equities, bonds, real estate, and private markets.
6. Risks & Challenges
No growth story is without risks. India’s path faces several hurdles:
Employment Creation: Millions of young Indians need jobs; automation could limit opportunities.
Income Inequality: Growth must be inclusive, else social tensions may rise.
Infrastructure Bottlenecks: Execution delays can hurt competitiveness.
Climate & Resource Stress: Water scarcity, pollution, and energy transition costs are challenges.
Policy & Regulatory Risks: Political shifts and bureaucratic hurdles could slow reforms.
Global Headwinds: Geopolitical shocks, global recessions, or commodity volatility can disrupt momentum.
Managing these risks will decide whether the growth cycle is truly “super” or just a phase.
7. Lessons from China’s Growth Super Cycle
China’s rise from the 1990s offers lessons for India:
Export-Led Growth: China leveraged manufacturing + global trade. India must balance exports with domestic consumption.
Urbanization & Infrastructure: China urbanized aggressively; India must manage this sustainably.
Governance & Policy Consistency: Long-term reforms and stable governance matter.
India will not replicate China’s model but chart its own path—more services + consumption driven, with a democratic framework.
8. The 2030 and 2040 Vision
By 2030, India could be a $7–8 trillion economy, the world’s 3rd largest.
By 2047 (100 years of Independence), India aspires to be a developed economy ($30 trillion GDP, per capita income ~$20,000).
Urbanization, digitalization, and sustainability will define this transformation.
9. Opportunities for Traders & Investors
For traders, India’s growth super cycle creates:
Sectoral Rotations: Banking, infra, energy, and consumption stocks leading in phases.
IPO Boom: Rising entrepreneurship will bring waves of public listings.
Currency & Commodity Trades: INR stability and commodity demand (oil, steel, copper).
Thematic Investments: Green energy, fintech, EVs, AI, and defense manufacturing.
Conclusion
India is entering what many call its “Amrit Kaal”—a golden era of growth. The combination of demographic advantage, domestic demand, digital revolution, manufacturing push, and global repositioning creates a once-in-a-century opportunity.
The India Growth Super Cycle is not just about GDP numbers but about a civilizational transformation—lifting hundreds of millions into prosperity, reshaping global supply chains, and positioning India as one of the great powers of the 21st century.
If managed wisely—with inclusive policies, sustainable development, and steady reforms—India’s growth super cycle could rival the greatest economic transformations in history.

Trading Discipline with Biofeedback1. Introduction: Why Trading Discipline is Hard
In the world of financial markets, traders are constantly balancing analysis with emotion. Charts and data may look purely rational, but the human brain does not operate like a spreadsheet. Instead, traders face fear, greed, overconfidence, hesitation, and impulse — all in rapid cycles during market hours.
Trading discipline is the ability to execute a trading plan consistently, without being swayed by emotional impulses or external noise. It’s what separates a professional who survives years in the market from someone who burns out after a few months.
The challenge? Even the best-prepared trader can watch their discipline crumble in moments of market stress. This is where biofeedback comes in — a method for measuring and controlling physiological responses to improve self-control and decision-making under pressure.
2. What is Biofeedback in the Context of Trading?
Biofeedback is a technique where you use electronic monitoring devices to measure physiological functions — like heart rate, breathing rate, muscle tension, skin conductance, and brainwave activity — and then use that real-time data to learn how to control them.
In trading, biofeedback can help you:
Recognize early signs of stress before they impact your judgment.
Maintain an optimal arousal level for peak performance.
Train your nervous system to remain calm in volatile situations.
Develop habits that strengthen mental resilience over time.
Example:
A trader using a heart rate variability (HRV) monitor might notice their HRV drops significantly before a losing trade — a sign of rising stress. With practice, they can use breathing techniques to restore calm and prevent impulsive decisions.
3. The Science Behind Biofeedback for Traders
3.1. The Stress-Performance Curve
This is based on the Yerkes–Dodson Law, which shows that performance improves with physiological arousal — but only up to a point. Too little arousal (low alertness) leads to sluggish reactions; too much (high anxiety) causes poor judgment.
Biofeedback helps traders stay in the optimal performance zone — alert but calm.
3.2. Physiological Markers in Trading
When you place a trade or watch a volatile market, your body activates the sympathetic nervous system ("fight-or-flight" mode):
Heart rate increases → decision-making becomes reactive.
Breathing shortens → oxygen supply to the brain decreases.
Skin conductance rises → higher sweat response from stress.
Muscle tension increases → physical discomfort, fatigue.
Brainwaves shift → from alpha/theta (calm focus) to high beta (stress).
This physiological shift can override logic. Biofeedback helps you detect these changes before they hijack your behavior.
3.3. Neuroplasticity and Habit Formation
Biofeedback training taps into neuroplasticity — the brain’s ability to rewire itself through repeated experience. By pairing specific mental states (calm focus) with trading activities, you strengthen neural pathways that make discipline more automatic.
4. Why Discipline Breaks in Trading
Even with a perfect trading plan, discipline often fails because:
Emotional Hijacking — The amygdala overrides rational thought under stress.
Overtrading — Dopamine-driven urge to "chase" trades after wins or losses.
Loss Aversion — The tendency to avoid losses at all costs, leading to holding losers too long.
Confirmation Bias — Seeking only information that supports your existing trade.
Fatigue — Poor sleep or extended screen time reduces impulse control.
Biofeedback directly addresses points 1 and 5, and indirectly helps with the rest by improving awareness and emotional regulation.
5. Types of Biofeedback Tools for Traders
5.1. Heart Rate Variability (HRV) Monitors
Function: Measures beat-to-beat variations in heart rate.
Why it’s useful: Higher HRV = greater resilience and adaptability to stress.
Popular devices: Polar H10, Whoop, Elite HRV, Oura Ring.
5.2. Electroencephalography (EEG) Headsets
Function: Measures brainwave activity (alpha, beta, theta, gamma).
Why it’s useful: Identifies mental states — e.g., focus, relaxation, distraction.
Popular devices: Muse, Emotiv Insight.
5.3. Skin Conductance Sensors
Function: Measures electrical conductance of skin (linked to sweat response).
Why it’s useful: Early indicator of stress before conscious awareness.
Popular devices: Empatica E4, GSR2.
5.4. Breathing Feedback Devices
Function: Tracks breathing rate and depth.
Why it’s useful: Calm, diaphragmatic breathing maintains optimal arousal levels.
Popular devices: Spire Stone, Breathbelt.
5.5. Multi-Sensor Platforms
Combine HRV, skin conductance, temperature, movement, and EEG for a full picture.
Often integrated with mobile apps that guide breathing, meditation, or cognitive training.
6. The Biofeedback-Discipline Loop for Traders
Here’s how biofeedback fits into a trader’s workflow:
Baseline Measurement
Monitor your physiological state during calm, non-trading hours.
Establish "normal" HRV, heart rate, and brainwave patterns.
Stress Mapping
Record your physiological data during live trading.
Identify patterns before, during, and after trades — especially losing streaks.
Intervention Training
Use breathing, mindfulness, or focus exercises to restore optimal state.
Repeat until the intervention becomes automatic.
Real-Time Application
Wear biofeedback devices during trading.
Take action the moment stress markers exceed thresholds.
Review and Adjust
Analyze post-trade logs for emotional triggers and physiological patterns.
Update your discipline strategy accordingly.
7. Biofeedback Training Protocol for Traders
Phase 1: Awareness (2–3 Weeks)
Goal: Understand your physiological reactions to market events.
Action Steps:
Wear HRV and skin conductance sensors during trading.
Log market conditions and emotional states alongside data.
Identify recurring "stress spikes" and the situations causing them.
Phase 2: Regulation (3–4 Weeks)
Goal: Learn to control physiological stress responses.
Techniques:
Coherent Breathing: Inhale for 5.5 seconds, exhale for 5.5 seconds.
Progressive Muscle Relaxation: Tense and release muscles from head to toe.
Alpha Wave Training: Use EEG feedback to enter calm, focused states.
Phase 3: Integration (Ongoing)
Goal: Make emotional regulation part of your trading routine.
Action Steps:
Pre-market: 5 minutes of HRV breathing.
During trading: Monitor stress markers, take breaks if needed.
Post-market: Review biofeedback logs and trade journal together.
8. Case Studies
Case Study 1: The Impulsive Scalper
Problem: A day trader entered trades too quickly after losses, leading to overtrading.
Biofeedback Insight: HRV dropped sharply after losing trades; breathing became shallow.
Solution: Implemented 3-minute breathing reset after each loss. Over 6 weeks, reduced revenge trades by 70%.
Case Study 2: The Swing Trader with Exit Anxiety
Problem: Took profits too early due to fear of reversals.
Biofeedback Insight: EEG showed increased beta waves when price approached target.
Solution: Practiced alpha-wave breathing before exit decisions. Result: Average holding time increased by 15%, boosting profits.
Case Study 3: The New Trader with Market Open Stress
Problem: Felt overwhelmed at the opening bell, making erratic trades.
Biofeedback Insight: Skin conductance spiked dramatically at market open.
Solution: Added 10 minutes of pre-market meditation and HRV training. Result: 40% fewer impulsive trades in the first 30 minutes.
9. Advantages of Biofeedback for Trading Discipline
Objective self-awareness: Replaces guesswork with measurable data.
Prevents emotional spirals: Stops small mistakes from snowballing.
Speeds up learning: Accelerates habit formation for calm decision-making.
Customizable: Can be adapted to each trader’s unique stress patterns.
Integrates with trading journal: Creates a full picture of both mental and market performance.
10. Limitations and Considerations
Cost: High-quality devices can be expensive.
Learning curve: Requires time to interpret data and apply techniques.
Over-reliance: Biofeedback should enhance, not replace, psychological skill-building.
Privacy: Data storage should be secure, especially with cloud-based apps.
Conclusion
Trading discipline is not just a mental skill — it’s a mind-body skill. Biofeedback bridges the gap between the psychological and physiological sides of trading performance. By learning to recognize and control your body’s stress responses, you can keep your decision-making sharp, your execution consistent, and your emotions balanced even in high-pressure market environments.
Over time, biofeedback training rewires your nervous system for resilience, turning discipline from a constant battle into a natural, automatic state. And in the competitive world of trading, that could be the difference between long-term success and early burnout.
Part8 Trading MasterclassIntroduction to Options Trading Strategies
Options are like the “Swiss army knife” of the financial markets — flexible tools that can be shaped to fit bullish, bearish, neutral, or volatile market views. They’re contracts that give you the right, but not the obligation, to buy or sell an asset at a specific price (strike) on or before a certain date (expiry).
While most beginners think options are just for making huge leveraged bets, seasoned traders use strategies — combinations of buying and selling calls and puts — to control risk, generate income, or hedge portfolios.
Why Use Strategies Instead of Simple Buy/Sell?
Risk Management: You can cap your losses while keeping upside potential.
Income Generation: Strategies like covered calls and credit spreads generate consistent cash flow.
Direction Neutrality: You can profit even when the market moves sideways.
Volatility Play: You can design trades to profit from expected volatility spikes or drops.
Hedging: Protect stock holdings against adverse moves.

Trading Masterclass Options Trading Strategies
For Beginners:
Buying Calls: Bullish on the stock/index.
Buying Puts: Bearish on the stock/index.
For Intermediate Traders:
Covered Call: Holding the stock + selling a call for income.
Protective Put: Holding stock + buying a put to limit losses.
For Advanced Traders:
Iron Condor: Neutral strategy with limited risk/reward.
Straddle: Buy a call and put at the same strike; profits from big moves.
Strangle: Buy a call and put at different strikes.
Spreads:
Bull Call Spread: Buy a lower call, sell a higher call.
Bear Put Spread: Buy a higher put, sell a lower put.
These strategies balance risk and reward across different market outlooks.

Super Cycle in Trading (2025–2030 Outlook)Introduction: What is a Super Cycle in Trading?
A super cycle in trading refers to a long-term, secular trend that drives asset prices higher (or lower) across years—sometimes even decades. These macroeconomic cycles often result from structural shifts such as technological revolutions, global demographic trends, monetary policy changes, or supply-demand imbalances in key markets like commodities, equities, or currencies.
Historically, super cycles have influenced not just asset prices but global economies, wealth distribution, and geopolitical dynamics. For instance, the commodity super cycle of the early 2000s—driven by China's industrialization—triggered a worldwide surge in raw material prices. The tech super cycle in the 2010s saw exponential gains in the valuation of Silicon Valley and digital-first companies.
As we enter the second half of the 2020s, traders and investors are keenly watching for the 2025–2030 super cycle—which sectors will dominate, what risks lie ahead, and how to position themselves for maximum advantage.
Section 1: Characteristics of a Super Cycle
Understanding a super cycle involves recognizing its unique characteristics:
Extended Duration – Lasts 5–20 years.
Broad Market Impact – Affects multiple asset classes, not just isolated sectors.
Macro-Driven – Tied to global shifts in technology, demographics, or policy.
Momentum-Heavy – Once in motion, trends tend to self-reinforce.
High Volatility Phases – Though generally upward (or downward), corrections within the cycle can be sharp.
Section 2: Historical Super Cycles & Lessons Learned
To understand future super cycles, we must look at past ones:
1. Post-War Industrial Boom (1945–1965)
Driven by U.S. manufacturing and European reconstruction.
Equities soared while gold remained fixed under Bretton Woods.
2. Oil Shock & Stagflation (1970s)
Energy-driven cycle where oil-producing nations gained power.
Gold and commodities surged; equities stagnated.
3. Tech Bubble (1990s–2000)
Dot-com boom powered by internet expansion.
Unprecedented IPO mania followed by the 2001 crash.
4. China-Driven Commodity Cycle (2002–2011)
Massive demand for metals, energy, and raw goods.
Benefited countries like Australia, Brazil, and Russia.
5. Post-GFC Liquidity Super Cycle (2009–2021)
Central bank stimulus led to asset inflation.
Tech, real estate, and passive investing dominated.
Key Takeaway: Super cycles are driven by unique, structural themes. They reward early movers and punish late entrants who chase overheated trends.
Section 3: Super Cycle Themes Likely to Dominate 2025–2030
Here are the major themes expected to power the next super cycle:
1. Artificial Intelligence and Automation
Why? Generative AI (like ChatGPT), robotics, and LLMs are transforming productivity, disrupting white-collar jobs, and creating new digital business models.
Market Implications:
Long-term growth in AI chipmakers, cloud infra, and data platforms.
Emergence of “AI-first” companies replacing legacy tech.
ETFs and thematic funds based on AI and robotics to outperform.
Trading Tip: Watch for mid-cap tech breakouts and AI service enablers in emerging markets.
2. Green Energy & Climate Tech
Why? Energy transition is no longer optional—climate policy, regulation, and ESG demand are forcing real capital shifts.
Market Implications:
Massive investment in solar, wind, EVs, hydrogen, and battery storage.
Decline in legacy oil demand by late 2020s, despite short-term spikes.
New carbon trading platforms and climate hedge instruments.
Trading Tip: Focus on battery metals like lithium, cobalt, and rare earth ETFs.
3. De-Dollarization & Multi-Currency Trade Systems
Why? BRICS+ countries are pushing for alternative trade systems, reducing dependency on USD.
Market Implications:
Volatility in forex markets, with rising prominence of gold, yuan, and digital currencies.
Pressure on U.S. Treasury yields and broader financial dominance.
Trading Tip: Keep an eye on emerging market currencies, sovereign digital currency rollouts, and gold-based ETFs.
4. Demographic Super Cycle
Why? Aging populations in the West vs. youth booms in South Asia & Africa.
Market Implications:
Long-term bullishness on India, Vietnam, Indonesia due to labor and consumption booms.
Bearish tilt on EU and Japan due to declining productivity.
Trading Tip: Sectoral rotation into consumer stocks, fintech, and healthcare in these high-growth regions.
5. Decentralized Finance & Blockchain Integration
Why? Post-crypto winter, serious institutional adoption of DeFi is happening under regulated models.
Market Implications:
Ethereum and newer chains like Solana could see super cycle price surges.
Traditional finance will start integrating blockchain infrastructure (e.g., tokenized bonds, real estate).
Trading Tip: Long horizon positions in select Web3 tokens, DeFi apps, and stablecoin rails.
Section 4: Risks That Could Disrupt the Super Cycle
Super cycles aren’t guaranteed. Several factors can derail or delay them:
Geopolitical Tensions – Taiwan Strait, Middle East, Russia-Ukraine could fracture global trade.
Inflation Persistence – Sticky inflation may force central banks to tighten longer.
Tech Bubble 2.0 – Overhyped AI or green tech stocks could deflate.
Debt Crisis – Soaring global debt levels could trigger defaults or banking stress.
Climate Black Swans – Extreme weather events might upend agriculture, insurance, or energy markets.
Mitigation Strategy for Traders: Use options hedging, sector rotation, and diversified portfolio allocations. Follow global macro signals religiously.
Section 5: Trading Strategies to Ride the 2025–2030 Super Cycle
1. Thematic ETFs & Sectoral Allocation
Invest in AI, green energy, EM consumption, blockchain infrastructure via sector-focused ETFs.
2. Momentum & Breakout Trading
Super cycles create strong trend-following environments. Use weekly/monthly breakout setups for swing trades.
3. Options Writing with Super Cycle Bias
Sell puts on long-term bullish assets to accumulate at lower prices.
Use vertical spreads to capture trend-based price movement.
4. Position Trading in Commodities
Long metals and energy on dips; stay alert to seasonal and geopolitical triggers.
Super cycles often start in commodity inflation before equity re-ratings.
5. SME IPO Participation
India's SME boom is part of its structural super cycle. High-risk, high-reward territory for traders.
Use strict due diligence, avoid hype-based entries.
6. Macro Event Calendar Trading
Plan around key policy events: U.S. Fed meets, BRICS summits, G20, COP summits, Indian Budget, etc.
These can signal inflection points within super cycles.
Conclusion: Prepare, Don’t Predict
The 2025–2030 super cycle is forming amidst rapid technological shifts, rising geopolitical complexity, climate urgency, and generational demographic changes. Traders who align their strategies with these megatrends—rather than chasing short-term narratives—stand to benefit the most.
Use this cycle not just to profit, but to learn, adapt, and evolve as a market participant.
Options Trading Strategies (Weekly/Monthly Expiry)Introduction
Options trading is a powerful tool that offers flexibility, leverage, and hedging opportunities to traders. While buying and selling options is accessible, mastering strategies tailored for weekly and monthly expiries can significantly improve your chances of success. These expiry-based strategies are designed to take advantage of time decay (Theta), volatility (Vega), direction (Delta), and price range (Gamma).
This guide will deeply explore how traders approach weekly vs monthly expiry, key option strategies, risk-reward setups, and market conditions under which they’re best applied. It’s designed in simple, human-friendly language, ideal for both beginners and experienced traders.
Part 1: Understanding Expiry Types
Weekly Expiry Options
Expiry Day: Every Thursday (for NIFTY, BANKNIFTY) or the last Thursday of the week if Friday is a holiday.
Time Horizon: 1–7 days
Used by: Intraday and short-term positional traders
Purpose: Quick premium decay (theta decay is faster), suitable for short-duration strategies.
Monthly Expiry Options
Expiry Day: Last Thursday of every month
Time Horizon: 20–30 days
Used by: Positional traders, hedgers, and institutions
Purpose: Manage risk, longer setups, or swing trades; smoother premium decay compared to weeklies.
Part 2: Key Greeks in Expiry-Based Strategies
Understanding how Greeks behave around expiry is crucial:
Theta: Time decay accelerates in the final days (especially for weekly options).
Delta: Determines direction sensitivity; weekly options are more delta-sensitive near expiry.
Vega: Volatility effect; monthly options are more exposed to volatility changes.
Gamma: High near expiry, especially in ATM (At-the-Money) options — can lead to quick losses/gains.
Part 3: Weekly Expiry Strategies
1. Intraday Short Straddle (High Theta Play)
Setup: Sell ATM Call and Put of current week’s expiry.
Objective: Capture premium decay as the price stays around a range.
Best Time: Expiry day (Thursday), typically after 9:45 AM when direction becomes clearer.
Example (NIFTY at 22,000):
Sell 22000 CE and 22000 PE for ₹60 each.
Conditions:
Low India VIX
Expected range-bound movement
No major news or global event
Risks:
Sudden movement (delta risk)
Need for proper stop-loss or delta hedging
2. Short Iron Condor (Neutral)
Setup: Sell OTM Call and Put; Buy further OTM Call and Put for protection.
Risk-defined strategy, ideal for weekly expiry when you expect low movement.
Example:
Sell 22100 CE and 21900 PE
Buy 22200 CE and 21800 PE
Benefit:
Controlled loss
Decent return if the index stays in range
When to Use:
Mid-week when implied volatility is high
Event expected to cool off
3. Long Straddle (Directional Volatility)
Setup: Buy ATM Call and Put of the same strike.
Best for: Sudden movement expected — news, results, RBI event.
Example (Bank Nifty at 48,000):
Buy 48000 CE and 48000 PE
Break-even:
Needs large move to be profitable (due to premium paid on both sides)
Risk:
Premium loss if market remains flat
4. Directional Option Buying (Momentum)
Setup: Buy CE or PE depending on market trend.
Ideal for: Trending days (Tuesday to Thursday)
Time decay: High risk in weekly expiry. Must be quick in entries and exits.
Example:
Bank Nifty bullish -> Buy 48000 CE when price breaks above a resistance.
Tips:
Use support/resistance, volume, and OI data
Avoid buying deep OTM options
5. Option Scalping on Expiry Day
Method: Trade ATM options in 5-minute or 15-minute chart using price action.
Goal: Capture small moves multiple times — 10 to 20 points in NIFTY or BANKNIFTY
Works Best:
Thursday (expiry)
Volatile days with good volumes
Tools:
VWAP, OI buildup, Breakout strategy, Moving Averages
Part 4: Monthly Expiry Strategies
1. Covered Call (Long-Term Positioning)
Setup: Buy stocks (or futures), sell OTM call options
Goal: Earn premium while holding stocks
Example:
Buy Reliance stock at ₹2800
Sell 2900 CE monthly option for ₹50
Best For:
Investors with long-term holdings
Stable stocks with limited upside
2. Calendar Spread (Volatility Strategy)
Setup: Sell near expiry (weekly), buy far expiry (monthly)
Example:
Sell 22000 CE (weekly)
Buy 22000 CE (monthly)
Goal:
Earn premium from weekly decay, protect via long monthly
Best Time:
When volatility is expected to rise
Ahead of big events like elections, RBI meet
3. Bull Call Spread (Directional)
Setup: Buy ATM Call, Sell OTM Call
Risk-defined bullish strategy
Example:
Buy 22000 CE, Sell 22200 CE (monthly)
Payoff:
Limited profit, limited risk
Better risk-reward than naked option buying
Use When:
Monthly expiry in bullish trend
Budget rallies, earnings momentum
4. Bear Put Spread (Downside Protection)
Setup: Buy ATM Put, Sell OTM Put
Use for: Bearish view with limited loss
Example:
Buy 22000 PE, Sell 21800 PE (monthly)
Ideal For:
Volatile times with expected downside
FII outflows, global corrections
5. Ratio Spread (Moderately Bullish or Bearish)
Setup: Buy 1 ATM Option, Sell 2 OTM Options
Warning: Can cause unlimited loss if trade goes against you
Example (Bullish Ratio Call Spread):
Buy 22000 CE, Sell 2x 22200 CE
Conditions:
Monthly expiry
Expect mild upward move but not aggressive rally
Conclusion
Trading weekly and monthly expiry options offers unique opportunities and risks. Weekly options give fast profits but demand sharp timing and discipline. Monthly options offer more flexibility for directional, volatility, and income-based strategies.
Whether you’re a scalper, trend trader, or risk-averse investor, there’s a strategy suited for your style — but success depends on combining the right strategy with sound analysis, proper risk control, and emotional discipline.
GIFT Nifty & SGX Nifty Correlation1. Introduction
The Indian derivatives market has witnessed a historic transformation with the shift of offshore Nifty trading from SGX Nifty (Singapore Exchange) to GIFT Nifty (Gujarat International Finance Tec-City International Financial Services Centre). This move, significant in both strategic and geopolitical terms, was designed to bring liquidity, price discovery, and market influence back to Indian jurisdiction.
The relationship or correlation between GIFT Nifty and SGX Nifty is not just about numbers; it encapsulates the evolution of India’s financial markets, regulatory reforms, and global investor behavior. This guide explains the intricate correlation between the two, contextualized by market structure, trading dynamics, and macro-financial impacts.
2. Background of SGX Nifty
Before GIFT Nifty emerged, SGX Nifty was the go-to platform for global investors to gain exposure to Indian equity markets without being subject to Indian capital controls. Introduced in 2000 by the Singapore Exchange (SGX), SGX Nifty offered Nifty 50 index futures for global investors, especially hedge funds, proprietary traders, and institutional players who wanted to trade Indian indices in USD without directly accessing the NSE (National Stock Exchange) in India.
Key Points:
Cash-settled in USD.
Available for trading ~16 hours a day.
Offered strong liquidity and price discovery overnight.
Heavily used by global institutions for hedging Indian equity exposure.
3. Emergence of GIFT Nifty
GIFT Nifty was launched in 2023 on the NSE International Exchange (NSE IX) at GIFT City (Gujarat International Finance Tec-City) as a replacement for SGX Nifty, aiming to:
Localize Nifty trading.
Bring offshore volumes back to India.
Provide tax-efficient and regulated access to foreign investors.
GIFT Nifty is the sole platform for trading international Nifty derivatives post-transition, and it is denominated in USD, keeping global appeal intact.
4. Timeline: Transition from SGX Nifty to GIFT Nifty
Important Milestones:
2018: NSE terminated its data-sharing agreement with SGX, sparking a legal and market debate.
2019–2021: Regulatory developments and infrastructure improvements at GIFT City.
July 3, 2023: Official transition from SGX Nifty to GIFT Nifty. SGX stopped offering Nifty futures.
GIFT Nifty now operates under NSE IFSC regulations and continues to serve the same investor base with enhanced Indian regulatory control.
5. Structure and Functioning: SGX vs GIFT Nifty
Feature SGX Nifty GIFT Nifty
Exchange Singapore Exchange (SGX) NSE International Exchange (NSE IX)
Currency USD USD
Underlying Index Nifty 50 Nifty 50
Settlement Cash-settled Cash-settled
Regulation MAS (Singapore) IFSCA (India)
Time Zone Singapore Time (SGT) Indian Standard Time (IST)
Taxation Singapore tax regime IFSC-friendly tax structure
While the structure is mostly similar, the jurisdiction and oversight shifted from Singapore to India.
6. Trading Hours Comparison
Exchange Trading Hours (IST)
SGX Nifty (old) 06:30 AM – 11:30 PM IST (approx)
GIFT Nifty 6:30 AM – 3:40 PM (Session 1)
markdown
Copy
Edit
**4:35 PM – 2:45 AM** (Session 2) |
GIFT Nifty provides almost 21 hours of trading — covering both Asian and U.S. market hours, similar to SGX Nifty — ensuring that international investors can continue trading Nifty seamlessly.
7. Price Discovery and Global Influence
SGX Nifty's Role:
SGX Nifty was often viewed as the early indicator for Nifty 50 due to its early start.
It reflected overnight global cues (US, Asian markets).
It had strong influence over NSE opening gaps.
GIFT Nifty's Continuity:
Now assumes SGX Nifty’s role in overnight price discovery.
GIFT Nifty trading between 4:35 PM and 2:45 AM IST captures US and Europe market reactions.
Acts as a lead indicator for Nifty’s direction in the Indian market.
Thus, the correlation pattern of market impact continues, just the platform has shifted.
8. Liquidity and Volume Shifts
Pre-Transition:
SGX Nifty volumes averaged USD 1–1.5 billion/day.
Liquidity was concentrated in Singapore due to ease of access.
Post-Transition:
GIFT Nifty quickly absorbed liquidity, crossing $1 billion in daily turnover within weeks of launch.
Leading global market makers and brokers now operate from GIFT City.
Trading is supported by IFSCA-approved entities and clearing corporations like NSE IFSC Clearing Corporation.
The liquidity correlation was maintained as investors smoothly moved to GIFT Nifty.
9. Institutional Participation and Derivative Strategies
Institutional investors still require Nifty derivatives to hedge equity portfolios.
GIFT Nifty options and futures offer equivalent utility as SGX Nifty did.
Hedge funds, FPIs, global trading desks have migrated their Nifty-linked strategies to GIFT City.
Because GIFT Nifty is cash-settled and USD-denominated, hedging and arbitrage strategies remain unaffected.
Correlation in terms of usage and derivative structuring remains intact.
10. Impact on Indian Traders
Retail Indian traders are not directly impacted because both SGX and GIFT Nifty were/are offshore products.
However, GIFT Nifty can be tracked through price feeds and platforms like NSE IFSC, Refinitiv, Bloomberg, etc.
Indian traders still monitor GIFT Nifty early morning to assess gap-up/gap-down expectations.
So, GIFT Nifty remains a sentiment barometer, just like SGX Nifty was.
Conclusion
The GIFT Nifty-SGX Nifty correlation is best described as a seamless transition of purpose, structure, and function from one platform to another — with jurisdiction and regulatory benefits tilting in India's favor. While SGX Nifty served global investors well for over two decades, GIFT Nifty now fulfills the same role with greater regulatory sovereignty, tax efficiency, and strategic national interest.
Key takeaway:
SGX Nifty and GIFT Nifty are fundamentally correlated in utility and influence — but GIFT Nifty is the future.
Trade Like a Institutions Trading is the act of buying and selling financial instruments (like stocks, commodities, currencies, or derivatives) with the intention of making a profit over short to medium timeframes. Traders do not necessarily hold positions for the long term. They react to price movements and market trends.
➤ Core Features of Trading:
Short-Term Focus: Hours to weeks.
Active Management: Constant monitoring of charts, news, and prices.
Profit from Price Movement: Traders capitalize on volatility and momentum.
Risk Management: Stop-loss and position sizing are vital.
Types: Intraday trading, swing trading, scalping, positional trading.
➤ Pros:
Quick returns possible.
Flexibility in strategy.
Can be automated (algo/quant trading).
Capitalize on both bullish and bearish markets.
➤ Cons:
High risk due to leverage and volatility.
Emotionally draining.
Requires high skill and market understanding.
Brokerage, slippage, and taxes eat profits if not careful.

Crypto Market Recovery & Tokenized AssetsIntroduction
The cryptocurrency industry is known for its volatility and cyclical nature. Following periods of intense speculation and growth often come downturns, leading to what the community refers to as "crypto winters." However, the resilience of blockchain technology and the consistent innovation in the space have allowed it to recover from downturns repeatedly. Currently, we are witnessing signs of another crypto market recovery, buoyed by several factors, one of the most significant being the rise of tokenized assets. This convergence of market rebound and tokenization could redefine the future of finance.
This article delves into the causes and signs of the current crypto market recovery and explores the growing phenomenon of tokenized assets, highlighting how the two trends are intricately linked.
Part 1: Understanding the Crypto Market Recovery
1.1 The Cyclical Nature of the Crypto Market
Cryptocurrency markets have gone through several cycles:
Bull Markets – Characterized by soaring prices, mainstream interest, and speculative investment.
Bear Markets (Crypto Winters) – Marked by declining prices, reduced investor confidence, and contraction of the ecosystem.
Despite these swings, each downturn has historically led to a stronger resurgence, driven by real innovation, broader adoption, and better regulatory clarity.
1.2 The Most Recent Downturn
The latest bear market (2022–2023) was triggered by a mix of global macroeconomic challenges and internal crises within the crypto industry. Key events included:
The collapse of major entities like Terra (LUNA) and FTX.
Heightened regulatory scrutiny, especially in the US.
Inflation and rising interest rates that dampened risk asset appetite.
These events shook investor confidence and led to significant capital outflows.
1.3 Early Signs of Recovery
Starting in late 2023 and continuing into 2025, there have been growing signs of a market recovery:
Bitcoin and Ethereum price rebounds: Bitcoin has crossed significant psychological thresholds again, indicating renewed investor interest.
ETF Approvals: Regulatory green lights for Bitcoin and Ethereum spot ETFs in the US and other jurisdictions have brought institutional legitimacy.
Venture Capital Returns: More VC funds are re-entering the crypto space, targeting infrastructure, AI integration, and tokenization.
Institutional Adoption: Banks and financial institutions are increasing their exposure to crypto through custodial services and tokenization pilots.
1.4 Regulatory Clarity and Market Maturity
A more defined regulatory environment is also helping the market stabilize. Jurisdictions like the European Union with MiCA (Markets in Crypto-Assets Regulation) and progressive stances from Hong Kong and the UAE are providing legal frameworks that encourage innovation while protecting investors.
Part 2: The Rise of Tokenized Assets
2.1 What Are Tokenized Assets?
Tokenized assets refer to real-world assets (RWAs) represented digitally on a blockchain. These can include:
Real estate
Commodities
Stocks and bonds
Art and collectibles
Fiat currencies (as stablecoins)
By using blockchain technology, tokenized assets become programmable, divisible, and easily tradable across global platforms.
2.2 How Tokenization Works
The process of tokenization typically involves:
Asset Identification – Determining which real-world asset will be tokenized.
Valuation – Assessing the asset’s value, either through markets or third-party appraisals.
Token Creation – Issuing digital tokens that represent ownership or rights tied to the real asset.
Smart Contracts – Embedding the rules and rights associated with the asset into the token using blockchain protocols.
Custody and Compliance – Ensuring legal enforceability and regulatory compliance.
2.3 Benefits of Tokenized Assets
Increased Liquidity – Illiquid assets like real estate become tradable.
Fractional Ownership – Investors can buy portions of an asset, lowering entry barriers.
24/7 Trading – Markets can function outside traditional business hours.
Global Accessibility – Cross-border investment becomes frictionless.
Transparency – Transactions are visible and auditable on public blockchains.
2.4 Tokenization and DeFi (Decentralized Finance)
Tokenized assets are also finding a home in the DeFi ecosystem. They can be used as collateral, traded on DEXs (Decentralized Exchanges), or integrated into lending and yield farming protocols.
Part 3: Key Players and Use Cases in Tokenization
3.1 Institutional Adoption
Major financial institutions are entering the tokenization space:
BlackRock and Fidelity have shown strong interest in tokenized bonds and ETFs.
JPMorgan uses its Onyx platform for tokenized asset settlement.
Franklin Templeton launched a tokenized US government money market fund on the Stellar blockchain.
HSBC, UBS, and Goldman Sachs are piloting tokenization in private markets and real estate.
3.2 Government and Public Sector Involvement
Singapore’s Project Guardian and Switzerland’s SIX Digital Exchange (SDX) are spearheading public-private initiatives.
Hong Kong issued tokenized green bonds in a blockchain pilot to modernize capital markets.
The European Central Bank (ECB) is exploring how tokenized assets might integrate into future digital euro ecosystems.
3.3 Real-World Applications
Real Estate: Platforms like RealT and Lofty allow fractional ownership of U.S. real estate using blockchain tokens.
Commodities: Gold-backed tokens (like Paxos Gold) offer exposure to physical gold.
Collectibles: Artworks and rare items are being tokenized and sold as NFTs with shared ownership rights.
Private Equity: Startups and SMEs can raise funds by issuing equity tokens instead of going through traditional IPOs.
This bridges traditional finance and DeFi, making financial services more inclusive and efficient.
Conclusion
The recovery of the crypto market and the emergence of tokenized assets are two of the most important trends shaping the next generation of global finance. As regulatory clarity improves and infrastructure matures, tokenization will likely become the bridge between traditional and decentralized finance.
The Market SentimentPCR (Put-Call Ratio) – The Market Sentiment Radar
✅ What is PCR?
PCR stands for Put-Call Ratio, a popular sentiment indicator in the options market. It tells you whether traders are buying more puts (bearish bets) or more calls (bullish bets).
What is IV?
Implied Volatility (IV) is the market’s forecast of how volatile a stock or index might be in the future. It doesn’t tell direction, but only how fast or wild the moves could be.
✅ How does IV affect option prices?
Higher IV = Higher Option Premiums
Lower IV = Lower Option Premiums
Think of IV as the “air” in a balloon. More air (IV) = bigger premium (balloon).
✅ Why IV is Crucial:
Entry Timing: You want to buy options when IV is low (cheap premiums).
Exit Strategy: You want to sell options when IV is high (expensive premiums).
IV spikes before big events – like earnings, RBI policy, Budget, Fed meetings, etc.
✅ Example:
You buy a Nifty 20000 CE when IV is 14%. Then IV jumps to 22% even if price doesn’t move much.
Your option gains value because of IV expansion (called Vega Gain).
✅ IV vs HV:
IV: What market expects.
HV (Historical Volatility): What already happened.
When IV > HV = Overpriced Options.
When IV < HV = Underpriced Options.
VIX (Volatility Index) – The Fear Gauge of India
✅ What is VIX?
VIX is the Volatility Index, often called the "Fear Index". In India, we use India VIX, which measures expected volatility of Nifty 50 over the next 30 days.
✅ How is VIX calculated?
India VIX is derived from the option prices of Nifty 50 – mainly ATM (At-The-Money) options. It reflects market’s fear level or confidence.
✅ Interpretation:
VIX < 12 → Calm, low volatility (complacent market)
VIX 12–18 → Normal volatility
VIX > 20 → High fear, high volatility
🔁 VIX is inversely correlated with Nifty:
VIX rises → Nifty tends to fall
VIX falls → Nifty tends to rise
✅ Smart Usage of VIX:
Options Selling: When VIX is high, sell far OTM options (premium decay faster).
Options Buying: When VIX is low, buy options expecting breakout or event-driven moves.
Event Hedge: Spike in VIX signals market is anticipating big movement – ideal for straddle/strangle trades.
✅ Real Market Scenario:
During Budget day or unexpected geopolitical news, VIX may shoot up from 13 to 22 in a day.
Smart traders pre-position strangles or reduce exposure when VIX hits extremes.
🔷 Putting It All Together – Mastery Strategy
Let’s combine PCR, IV, and VIX for smart institutional-level setups.
🔹 1. PCR + VIX Confluence
PCR High + VIX High = Too much fear → Possible market bottom → Buy signal
PCR Low + VIX Low = Overconfidence → Possible correction → Sell signal
🔹 2. IV Crush Trade
Before event (high IV) → Sell options → Capture premium decay post-event
After event (low IV) → Buy directional options → Lower premium, better RR
🔹 3. Directional Bet with PCR + IV
Rising PCR + Rising IV = Building bearish pressure → Bearish bias
Falling PCR + Falling IV = Bullish optimism → Bullish bias

Learn Institutional Option Trading Part-3In India, options are traded primarily on:
NSE (National Stock Exchange)
BSE (Bombay Stock Exchange)
The Securities and Exchange Board of India (SEBI) regulates the derivatives market and ensures fair practices.
Why is Option Trading Popular in India?
Leverage: Traders can control large positions with small capital.
Hedging: Investors use options to protect their portfolios from market fluctuations.
Income Generation: Strategies like covered calls can provide regular income.
Speculation: Traders can bet on price movements with limited risk.

Option Chain AnalysisTo read an options chart effectively, consider the following steps:
Identify the strike price associated with each line on the chart.
Observe the direction and steepness of the lines to gauge the options' delta values. ...
Assess the options' positions concerning the current market price of the underlying asset.

Basic to Advance in Trading Understand market trends and patterns.
Use risk management strategies, like setting stop-loss orders.
Focus on liquid assets with high volume.
Keep emotions in check and stick to a trading plan.
Limit the number of trades to manage risk.
Constantly educate yourself on market dynamics and trading strategies.

Class for Advanced Trader part 2To understand how to become a trader, follow these seven steps:
Complete your education. ...
Learning the basics of trading. ...
Determine the product in which you want to trade. ...
Develop trading techniques. ...
Gain trading experience. ...
Understand risk management. ...
Review your trades.

Class for Advanced Trader Advanced trading strategies usually involve multiple technical indicators and more complicated instruments, such as options and futures.

Put Call Ratio (PCR) Trading The Put Call Ratio (PCR) is a tool in the stock market to understand how investors feel about a stock or the market's future. It compares the number of put options to call options traded. More puts traded mean investors expect prices to fall (bearish). More calls traded mean investors expect prices to rise (bullish).
