RSI Divergence part 1RSI divergence is fairly reliable, especially when used alongside other technical indicators for confirmation. However, like all technical tools, it's not foolproof and should be used as part of a broader strategy that includes risk management.
Tata

RSI Divergence part 1RSI: Divergence appears when the RSI's highs or lows diverge from price. For example, if the price makes new lows but the RSI bottoms at higher levels, it signals bullish divergence; if the price makes new highs but the RSI peaks at lower levels, it signals bearish divergence.

NIFTY BANK INDEX Banknifty will try to go near 56000 buy on dip near support
How to take trades using Harmonic pattern projection Trade setup is explained below:-
Entry: 1st SL point: 0% is recent top or bottom.
Trailing D: 15.1% is work as trailing SL of buy or sell trade if hit then we have to book profit
.If price goes below 2nd D 22.5% to 24.5% range then early traders can make fresh reversals trade after breaking 1st D 15.1% safe traders can reversal trade after breaking Point D 22.5.4% to 24.5% range
Targets:
Target T1: 36.1% to 38.3%
Target T3: 49.1% to 52.5%
T3: 60.9% to 64.8% is our 3rd Target since this is reversal zone so must book profit if break then take fresh trade again
Target T4: 76.4% to 79.7%
Next Targets are 100%, 127.2%,141.4% and final Target 161.8%.
How to take reversal trade:
If price going upside/ downside then then buy or sell levels appear on Chart ( Automatically show when price reach any reversal zone of harmonic projection). Trailing SL:
After reach 1st Target trail SL to just above or below cost (for example we are holding sell trade from 100 1st Target 110 hit then move trailing sl to 104-105 and move SL as price move upside or Downside)
Re-Entry:
For Re-entry in any pull back Point D (15.1%) is used for re-entry then SL recent high or low Point SL (0%).

INDUSIND BANK LTD Bullish on INDUSIND BANK
Trade Setup:
This is a positional breakout trade with a favorable risk-reward ratio. The structure indicates potential for a move toward *855 initially, with ₹900+ as a stretch target if momentum sustains.
✰ Entry Zone: On a breakout above 780-7785
Target Zone: *855 / 900+
✰ Stop Loss: *745 (on daily close basis)
Disclaimer: This is not investment advice. Please do your own research or consult with your financial advisor before making trading decisions.

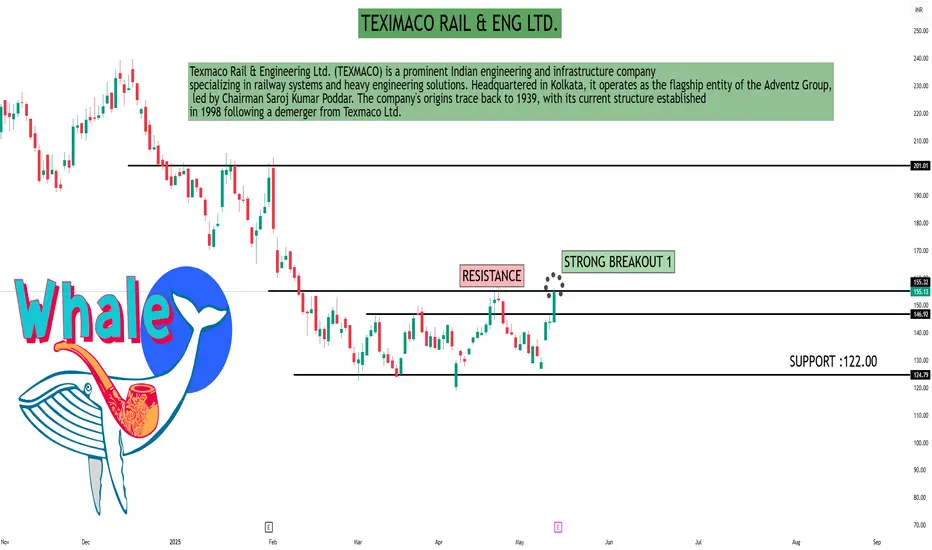
TEXIMACO RAIL & ENG LTD.✓
TIME FOR RAILWAY STOCKS:
#TEXRAIL (Texmaco Rail.)
+ Entry : 152
SL : 142
TARGET: 180
? FORMING BOTTOM!
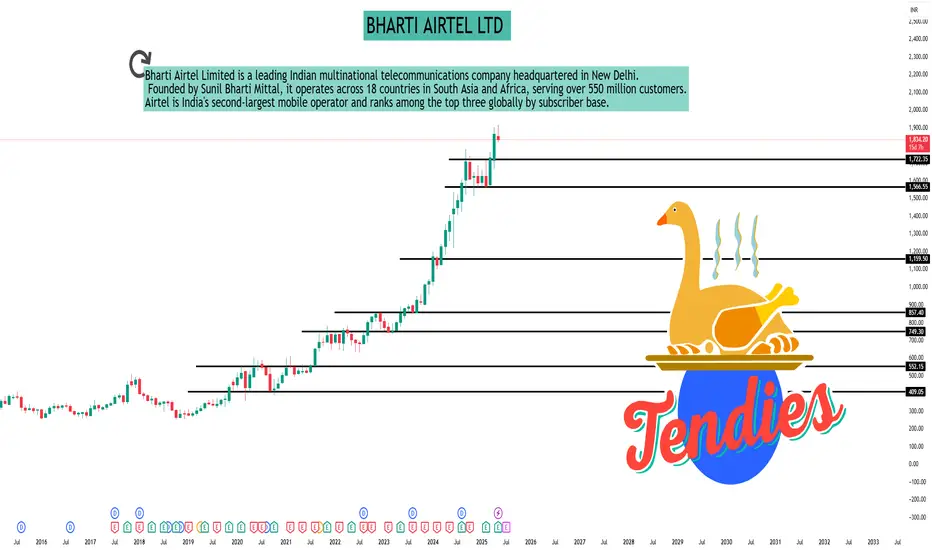
BHARTI AIRTEL LTD As of May 15, 2025, Bharti Airtel Ltd. (NSE: BHARTIARTL) is trading at ₹1,834.20. The stock has experienced significant growth over the past year, with a 12-month return of approximately 42.8%.
📅 Monthly Closing Prices (May 2024 – May 2025)
Month Closing Price (₹)
May 2025 1,837.90
April 2025 1,864.50
March 2025 1,733.40
February 2025 1,570.20
January 2025 1,626.30
December 2024 1,587.75
November 2024 1,627.15
October 2024 1,612.60
September 2024 1,709.55
August 2024 1,589.05
July 2024 1,483.28
June 2024 1,436.05
May 2024 1,365.14
📈 Key Price Highlights
52-Week High: ₹1,917.00 (May 7, 2025)
52-Week Low: ₹1,219.05
All-Time High: ₹1,917.00
All-Time Low: ₹9.31
📊 Performance Summary
1-Month Return: +4.4%
3-Month Return: +6.8%
1-Year Return: +42.8%
3-Year Return: +165.8%
5-Year Return: +239.8%
🔍 Analyst Insights
Average Analyst Target: ₹1,900 – ₹2,350
Consensus: Majority of analysts maintain a "Buy" rating.
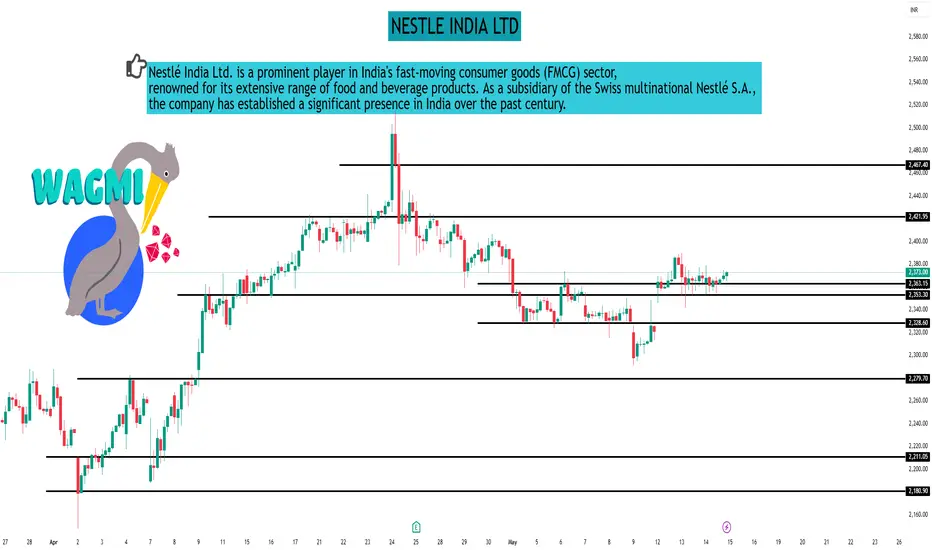
NESTLE INDIA LTDNestle India - Don't Miss the opportunity
Stock currently in downtrend in every time frame
But finally approaching its strong support level
Which is a demand zone in multiple time frame as well as a flip zone too
Buying zone can be between 2270 - 2290 with strict SL below 2260 closing basis
(at least in hourly candle)
Upside 1st tgt can be at least 2400 and so on
TITAN COMPANY LTDTitan - Trendline BO Post Q4 - Chart of the Week
TITAN
has a beautiful structure in the Weekly Timeframe and qualifies for my Chart of the Week idea post decent Q4 Results.
About:
TITAN
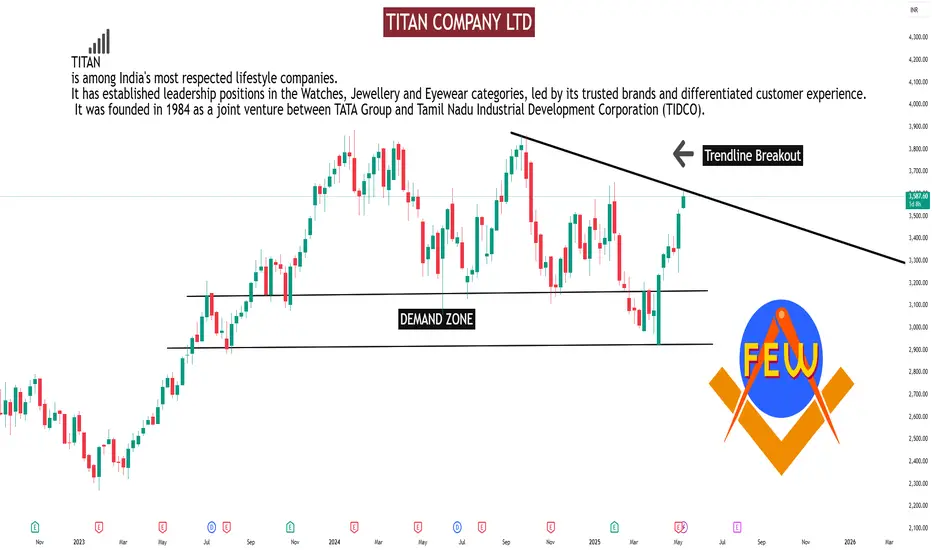
is among India's most respected lifestyle companies. It has established leadership positions in the Watches, Jewellery and Eyewear categories, led by its trusted brands and differentiated customer experience. It was founded in 1984 as a joint venture between TATA Group and Tamil Nadu Industrial Development Corporation (TIDCO).
Technical View:
The stock has decisively broken above a major descending trendline (marked with a white line) that had contained price action since July-August 2024. This trendline has been respected multiple times over approximately 8-9 months, making today's breakout particularly significant.
The breakout occurred with substantial price momentum, as indicated by the large green candle and 5%+ gain, suggesting conviction behind the move.
A critical demand zone (marked in green) around €2,900-3,000 that has repeatedly provided strong support. This zone has been tested and respected at least four times (marked with green arrows), demonstrating its importance as a major technical floor.
Since January 2025, the stock has formed progressively higher lows, indicating increasing buying interest at higher price levels.
Support and Resistance Analysis:
Key Resistance Levels
Immediate Resistance: ₹3,600 (horizontal level from previous swing highs)
Major Resistance: *3,886.95 (52-week high/all-time high)
Psychological Resistance: ₹3,750 (round number between current price and highs)
Key Support Levels
Immediate Support: ₹3,400-3,450 (previous resistance turned support) Trendline Support: ₹3,350 (the broken trendline should now act as support) Critical Support: *2,900-3,000 (major demand zone that has consistently held) Structural Support: €2,750 (low of the most recent significant pullback)
Trade Setup:
The combination of a clean trendline breakout, strong momentum, and historically reliable support zone suggests Titan Company may be poised for continued upside. Based on technical projections:
Target(Take Profit):
Near-term Target: 3,700-3,750 (measured move from the breakout point)
Intermediate Target: ₹3,886.95 (retest of previous high)
Longer-term Potential: New all-time highs above ₹3,900 if momentum continues
Stop Loss:
The critical factor to watch will be whether the stock can maintain positions above
the broken trendline on any pullbacks. This would confirm the validity of the
breakout and strengthen the bullish case. Conversely, a failure to hold above *3,400 could signal a false breakout scenario.
Disclaimer: "I am not SEBI REGISTERED RESEARCH ANALYST AND INVESTMENT ADVISER."
This analysis is intended solely for informational and educational purposes and should not be interpreted as financial advice. It is advisable to consult a qualified financial advisor or conduct thorough research before making investment decisions.
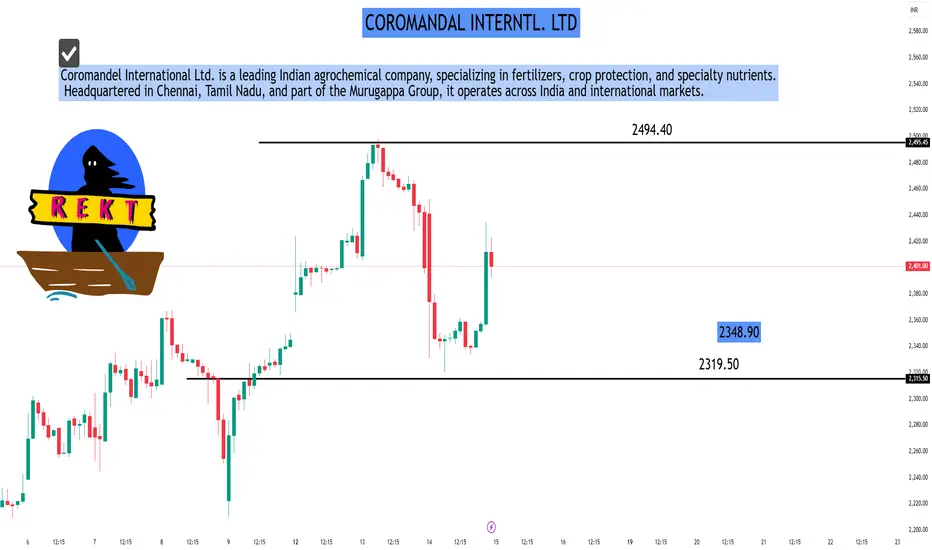
COROMANDAL INTERNTL. LTDAs of May 15, 2025, Coromandel International Ltd. (NSE: COROMANDEL) is trading at ₹2,403.30. Analyzing the 30-minute timeframe provides insights into short-term price movements and potential trading opportunities.
📊 30-Minute Technical Overview
Price Action:
Current Price: ₹2,403.30
Day's Range: ₹2,320.60 – ₹2,452.30
52-Week Range: ₹1,195.85 – ₹2,498.00
Technical Indicators:
Moving Averages: The stock is trading above its short-term moving averages, indicating a bullish trend.
Relative Strength Index (RSI): The RSI is in the neutral zone, suggesting neither overbought nor oversold conditions.
MACD: The MACD line is above the signal line, supporting a positive momentum.
Trend Analysis:
The 30-minute chart shows higher highs and higher lows, characteristic of an uptrend.
Volume analysis indicates increased buying interest during upward price movements.
🔍 Analyst Insights
Technical Rating: Based on multiple indicators, the stock has a "Strong Buy" rating in the 30-minute timeframe.
Volatility: The stock exhibits moderate volatility, suitable for intraday trading strategies.
RSI Divergence RSI: Divergence appears when the RSI's highs or lows diverge from price. For example, if the price makes new lows but the RSI bottoms at higher levels, it signals bullish divergence; if the price makes new highs but the RSI peaks at lower levels, it signals bearish divergence.

Candle Sticks Pattern part 2Candlestick charts show how prices move over a trading day or session. Each candle shows four important prices: the opening price, the closing price, and the highest and lowest prices of the day. The color of the candle shows whether the price increased or decreased.

Management and PsychologyManagement psychology applies psychological principles to understand and improve managerial practices, focusing on employee behavior, motivation, and workplace dynamics. It helps managers create more effective and positive work environments by understanding how individuals and groups behave in the workplace, and how that behavior is influenced by organizational structures and processes.

Basic to Advance TradingBeginners can start with courses that introduce the basics of trading and financial markets. Intermediate learners can delve into specific trading strategies and analytical techniques. Advanced traders can refine their skills with in-depth studies of market theories, algorithmic trading, and portfolio management.

Database Trading part 2Trading data is typically collected from stock exchanges such as the New York Stock Exchange (NYSE) or NASDAQ. This can be a useful source for trades that are made over the listed exchanges and can provide many different data poitns, such as trade prices and times.

RSI ( Relative Strength Index)In trading, RSI stands for Relative Strength Index, a momentum indicator used to assess overbought or oversold conditions in a market. It measures the speed and change of price movements, providing traders with insights into potential entry and exit points.

MACD ( Moving Average Convergence Divergence)MACD, which stands for Moving Average Convergence Divergence, is a technical indicator used in financial markets to identify potential trading opportunities and analyze price trends. It measures the relationship between two moving averages of a security's price. The MACD indicator is particularly useful for assessing momentum and determining potential trend reversals.

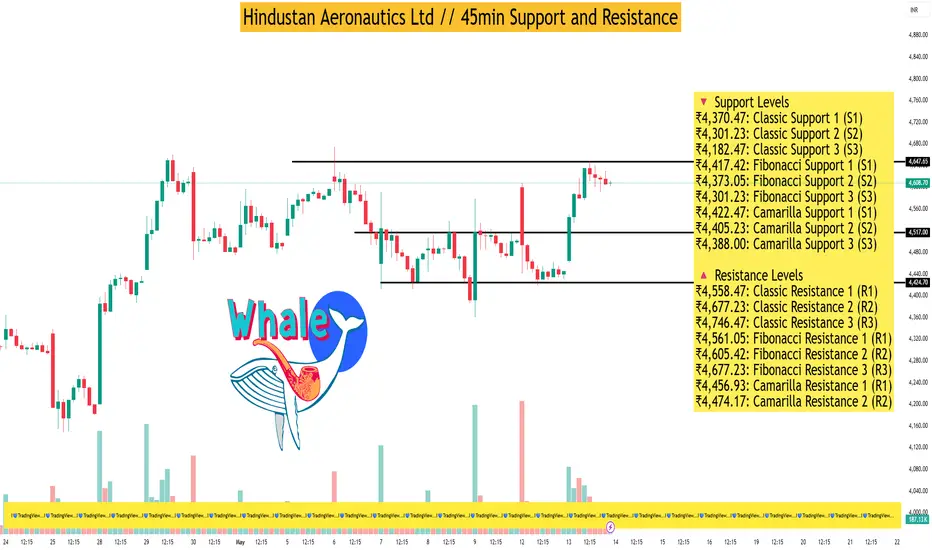
Hindustan Aeronautics Ltd // 45min Support and ResistanceAs of May 13, 2025, Hindustan Aeronautics Ltd (HAL) closed at ₹4,463.80, experiencing a slight decline of 0.668% for the day. Analyzing the 45-minute timeframe, the following support and resistance levels have been identified based on technical indicators and pivot point analyses:
🔻 Support Levels
₹4,370.47: Classic Support 1 (S1)
₹4,301.23: Classic Support 2 (S2)
₹4,182.47: Classic Support 3 (S3)
₹4,417.42: Fibonacci Support 1 (S1)
₹4,373.05: Fibonacci Support 2 (S2)
₹4,301.23: Fibonacci Support 3 (S3)
₹4,422.47: Camarilla Support 1 (S1)
₹4,405.23: Camarilla Support 2 (S2)
₹4,388.00: Camarilla Support 3 (S3)
🔺 Resistance Levels
₹4,558.47: Classic Resistance 1 (R1)
₹4,677.23: Classic Resistance 2 (R2)
₹4,746.47: Classic Resistance 3 (R3)
₹4,561.05: Fibonacci Resistance 1 (R1)
₹4,605.42: Fibonacci Resistance 2 (R2)
₹4,677.23: Fibonacci Resistance 3 (R3)
₹4,456.93: Camarilla Resistance 1 (R1)
₹4,474.17: Camarilla Resistance 2 (R2)
₹4,491.40: Camarilla Resistance 3 (R3)
📊 Technical Indicators Summary
Relative Strength Index (RSI): 44.65 – Neutral
MACD: -4.97 – Bearish
Average Directional Index (ADX): 20.58 – Indicates a weak trend
Stochastic Oscillator: 58.04 – Neutral
Rate of Change (ROC): 1.61 – Slightly bullish
Supertrend: ₹4,540.11 – Current trend indicator
Parabolic SAR (PSAR): ₹4,397.84 – Suggests potential reversal point
These indicators suggest a mildly bearish outlook in the short term, with the stock trading below key resistance levels. The RSI and Stochastic Oscillator indicate a neutral momentum, while the MACD points towards a bearish trend. The ADX value suggests that the current trend lacks strength.
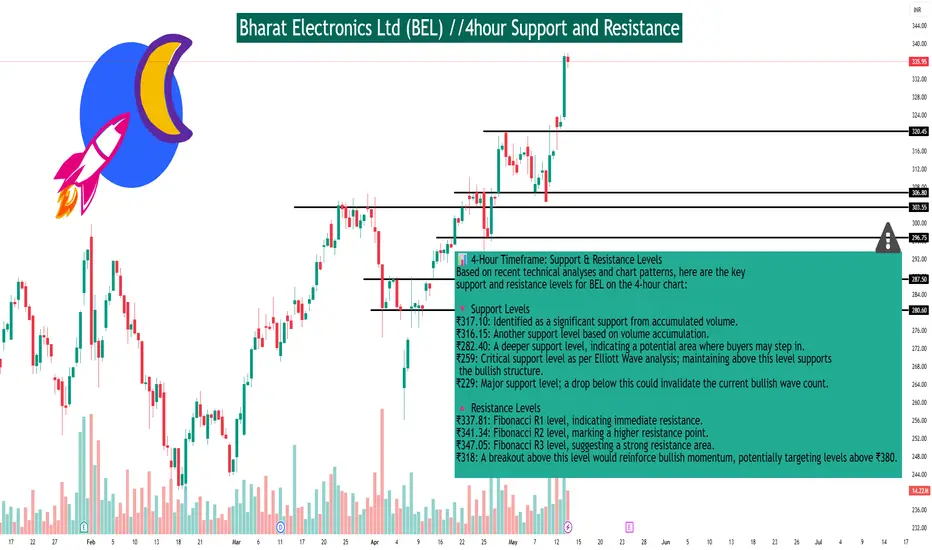
Bharat Electronics Ltd (BEL) //4hour Support and ResistanceAs of May 13, 2025, Bharat Electronics Ltd (NSE: BEL) closed at ₹335.75, reflecting a 4.21% gain for the day.
📊 4-Hour Timeframe: Support & Resistance Levels
Based on recent technical analyses and chart patterns, here are the key support and resistance levels for BEL on the 4-hour chart:
🔻 Support Levels
₹317.10: Identified as a significant support from accumulated volume.
₹316.15: Another support level based on volume accumulation.
₹282.40: A deeper support level, indicating a potential area where buyers may step in.
₹259: Critical support level as per Elliott Wave analysis; maintaining above this level supports the bullish structure.
₹229: Major support level; a drop below this could invalidate the current bullish wave count.
🔺 Resistance Levels
₹337.81: Fibonacci R1 level, indicating immediate resistance.
₹341.34: Fibonacci R2 level, marking a higher resistance point.
₹347.05: Fibonacci R3 level, suggesting a strong resistance area.
₹318: A breakout above this level would reinforce bullish momentum, potentially targeting levels above ₹380.
📈 Technical Outlook
BEL is currently in an upward trajectory within Minute Wave ((iii)) of Minor Wave 5, according to Elliott Wave analysis. To maintain this bullish structure, the price should stay above ₹259, with ₹229 being a critical support level. A breakout above ₹318 would confirm bullish control, with potential targets exceeding ₹380.
🔍 Additional Insights
Trend: The stock is in a strong rising trend in the short term, with expectations to rise 24.62% over the next 3 months, potentially reaching between ₹372.57 and ₹423.65.
Volatility: BEL has average daily movements with good trading volume, indicating medium risk.
Stop-Loss Recommendation: A suggested stop-loss is at ₹320.09, considering the medium daily movements and risk
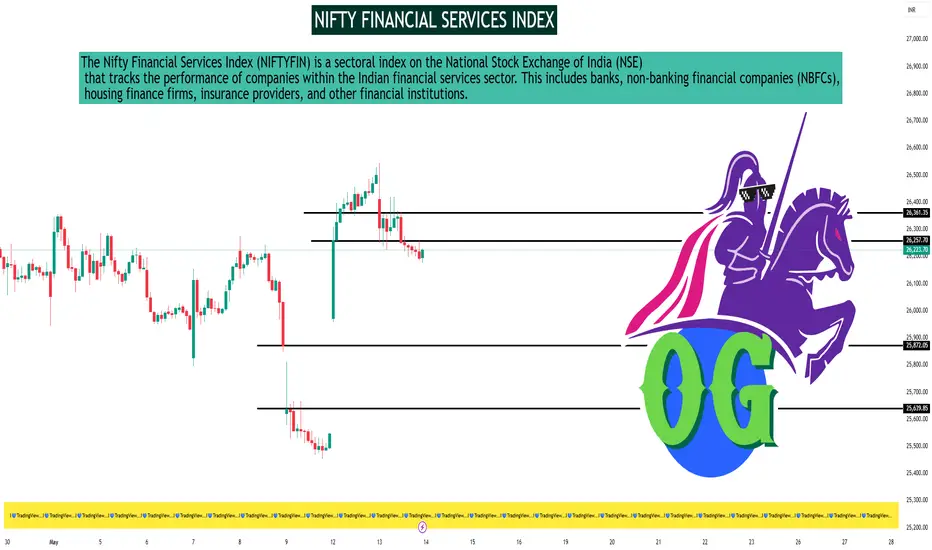
NIFTY FINANCIAL SERVICES INDEXAs of May 13, 2025, the Nifty Financial Services Index (NIFTYFIN) closed at 26,206.00, reflecting a decline of 1.10% for the day.
📊 30-Minute Timeframe Technical Overview
Key Support and Resistance Levels:
Support: Approximately 25,245.07
Resistance: Approximately 26,562.40
These levels are derived from recent price actions and are crucial for traders monitoring short-term movements.
Technical Indicators Summary:
Relative Strength Index (RSI 14): 52.33 – Neutral
Stochastic Oscillator (9,6): 98.35 – Overbought
Stochastic RSI (14): 2.60 – Oversold
MACD (12,26): 54.67 – Buy
Average Directional Index (ADX 14): 15.72 – Neutral
Williams %R: -1.94 – Overbought
Commodity Channel Index (CCI 14): -48.30 – Neutral
Average True Range (ATR 14): 166.29 – Indicates lower volatility
Rate of Change (ROC): 2.80 – Buy
Bull/Bear Power (13): -19.22 – Sell
Interpretation:
The technical indicators present a mixed outlook. While the MACD and ROC suggest bullish momentum, the overbought readings from the Stochastic Oscillator and Williams %R indicate potential for a short-term pullback. The neutral RSI and ADX values suggest a lack of strong directional momentum.
📈 Accessing 30-Minute Charts
For real-time 30-minute interval charts and advanced technical analysis tools, consider the following platforms:
TradingView – Nifty Financial Services Index
Investing.com – Nifty Financial Services Chart
Groww Terminal – Nifty Financial Services
These platforms offer customizable charts with various indicators to assist in your analysis.
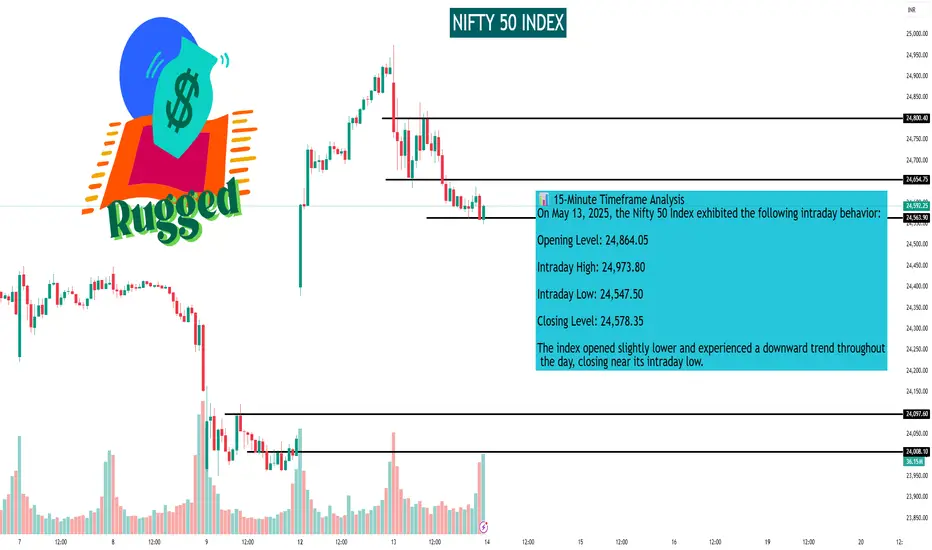
NIFTY 50 INDEX#NIFTY50 Analysis (15-min Chart)
Pattern: Breakdown from Ascending Trendline (bearish signal)
• Resistance:
• 24,700 - minor resistance
• 24,855 - swing high
• 25,066 - strong supply zone
• Support:
24,550 intraday support
24,400 strong demand zone
Note: Sustained trading below trendline weakens bullish momentum; watch for
bounce at 24,550 or reversal signs.
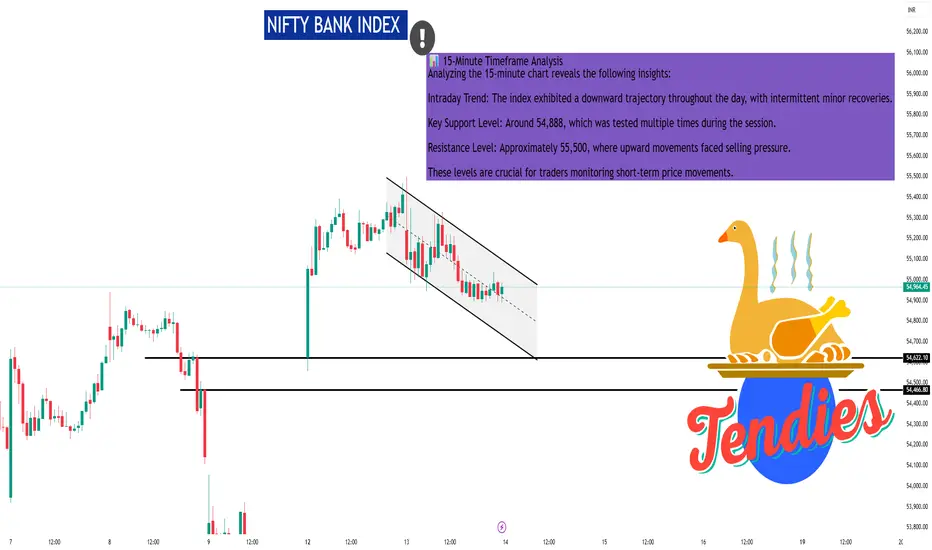
NIFTY BANK INDEX #NIFTYBANK Analysis (15-min Chart)
• Pattern: Falling Wedge () - Bullish reversal potential if breakout above resistance occurs.
• Resistance:
• 55,000 (psychological & upper wedge line)
• 55,400 - recent swing high
• Support:
54,800 wedge support zone
54,020 - previous gap-fill & demand zone
Note: Watch for volume spike & wedge breakout confirmation for long entry.
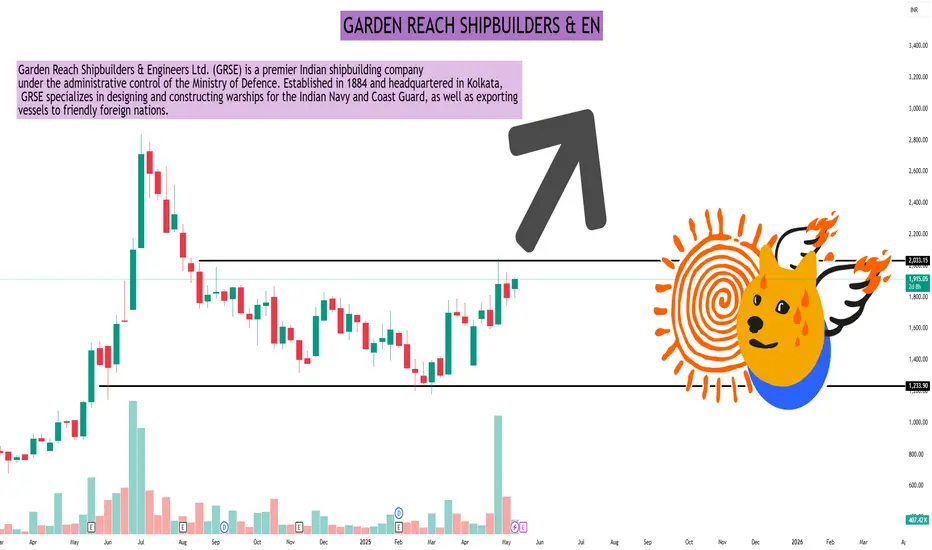
GARDEN REACH SHIPBUILDERS & ENBREAKOUT STOCK
Stock: Garden Reach Shipbuilders
Chart: weekly
Volatility in Range: *891 - *2833
+109.8% in 1-Year Returns
About the Company
Founded in 1934, GRSE is a key defense PSU engaged in:
• Warship & Naval Vessel Construction
• Diesel Engines & Ship Repair
Engineering Solutions for Indian Navy & Coast Guard
#GRSE
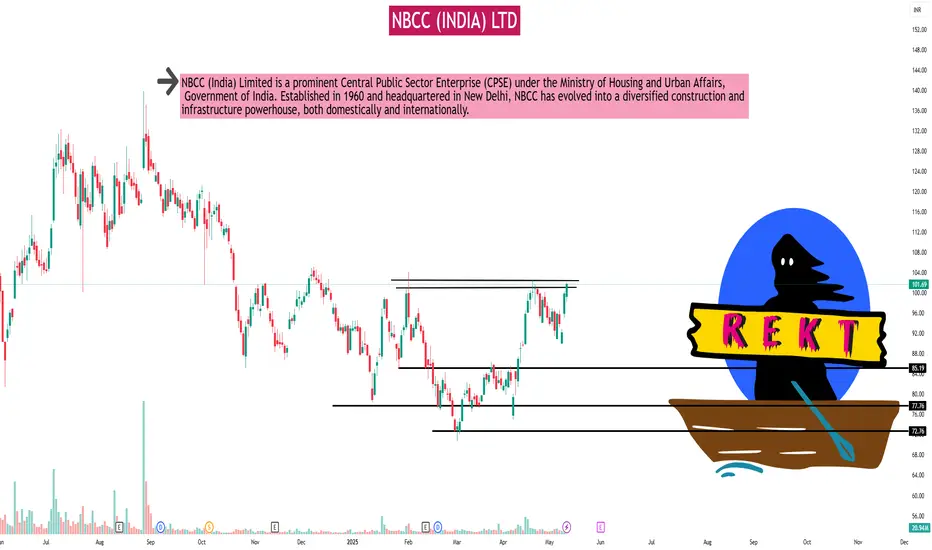
NBCC (INDIA) LTDAs of the close of trading on May 13, 2025, NBCC (India) Ltd. (NSE: NBCC) exhibited the following performance on the 1-day timeframe:
📊 NBCC (India) Ltd. – 1-Day Stock Performance
Closing Price: ₹101.69
Opening Price: ₹99.30
Day's Range: ₹98.32 – ₹102.10
Previous Close: ₹99.81
Daily Gain: +₹1.88 (+1.88%)
Volume: 20,939,670 shares traded
Average Traded Price (VWAP): ₹100.57
52-Week Range: ₹70.80 – ₹139.83
📈 Technical Overview
Trend: The stock is in an uptrend, closing higher for the second consecutive day.
Support Level: ₹98.00
Resistance Level: ₹102.10
Momentum: Positive, with a 1-day gain of nearly 2% and a 1-week gain of over 10%.
📅 Recent Developments
Order Acquisition: NBCC recently secured a ₹96 crore order, which is expected to positively influence investor sentiment.
📌 Key Metrics
Market Capitalization: ₹27,456 crore
P/E Ratio (TTM): 54.77
Dividend Yield: 0.62%
Book Value per Share: ₹8.93
Return on Equity (ROE): 24.8%
Debt-to-Equity Ratio: 0.00 (debt-free)