Watchlist Analysis – 12th Sept 2025📊 Watchlist Analysis – 12th Sept 2025
________________________________________
📌 ADANIENT (2398.80) – Rising Wedge
Momentum: Strong | Bullish | Risk: Low | Volume: High
Important Resistance Levels: 2499.68 / 2580.66 | Stop Loss: 2337.72
📊 Technical Indicators Explained
Adani Enterprises (ADANIENT) is flashing strong technical signals. A rising wedge structure 🔺 shows price tightening towards resistance, with today’s bullish breakout candle 🔥 backed by heavy volume surge 🚀. The RSI breakout ⚡ confirms strengthening momentum, while the BB Squeeze-Off release 📊 hints at a fresh volatility expansion. With support zones holding firm and price eyeing higher resistances, the stock is entering a decisive breakout zone.
Support & Resistance Zones
🟢 Support: 2353 | 2307 | 2275
🔴 Resistance: 2432 | 2464 | 2510
Investment Outlook & Conclusion
📈 Bullish Case – Strong momentum with volume support may push towards higher resistances.
📉 Bearish Case – A drop below SL can attract downside pressure.
⚡ Momentum Case – Aligned with momentum; good for short-term swings.
📅 Perspective – Short-term breakout play; long-term needs stability.
________________________________________
📌 AUROPHARMA (1109.20) – Double Bottom
Momentum: Strong | Bullish | Risk: High | Volume: High
Important Resistance Levels: 1175.93 / 1233.96 | Stop Loss: 1059.87
📊 Technical Indicators Explained
Aurobindo Pharma (AUROPHARMA) is flashing multiple bullish signals. A double bottom pattern 📉➡️📈 near ₹1016 confirms a strong reversal base, followed by a bullish breakout candle 🔥 backed by massive volume surge 🚀. The RSI breakout ⚡, Bollinger Band expansion 📊, and SuperTrend flip ✅ add conviction to the momentum. With supports holding firm and resistances ahead, the stock is entering a high-probability breakout zone.
Support & Resistance Zones
🟢 Support: 1074 | 1040 | 1018
🔴 Resistance: 1131 | 1153 | 1189
Investment Outlook & Conclusion
📈 Bullish Case – Heavy volume breakout supports upside continuation.
📉 Bearish Case – Failure to sustain above 1080 can bring weakness.
⚡ Momentum Case – Strong near-term upside; suitable for aggressive traders.
📅 Perspective – Short- to medium-term; long-term investors should watch risk levels.
________________________________________
📌 TATACHEM (968.25) - Symmetrical Triangle
Momentum: Strong | Bullish | Risk: Low | Volume: High
Resistance Levels: 1007.92 / 1039.84 | Stop Loss: 944.08
📊 Technical Indicators Explained
Tata Chemicals (TATACHEM) is showing strong bullish signals forming a Symmetrical Triangle. A bullish engulfing candle 🔥 near support highlights renewed buying interest, while an RSI breakout ⚡ confirms strengthening momentum. The Bollinger Band breakout 📊, along with VWAP support ✅, suggests rising participation. With a recent BB squeeze compression 🎯 now opening up, volatility expansion could fuel a decisive move. The stock is positioned in a potential breakout zone 🚀
Support & Resistance Zones
🟢 Support: 950 | 932 | 919
🔴 Resistance: 981 | 994 | 1012
Investment Outlook & Conclusion
📈 Bullish Case – Triangle consolidation may resolve higher on breakout.
📉 Bearish Case – Below SL, stock could revisit support levels.
⚡ Momentum Case – Neutral-to-positive; volume confirmation needed.
📅 Perspective – Short-term breakout opportunity; medium-term cautious stance.
________________________________________
📌 SHRIRAMFIN (620.05) – Downward Sloping Channel
Momentum: Strong | Bullish | Risk: Low | Volume: High
Resistance Levels: 643.69 / 664.48 | Stop Loss: 602.11
📊 Technical Indicators Explained
Shriram Finance (SHRIRAMFIN) has given a downward sloping channel breakout 📉➡️📈, signaling a shift from weakness to strength. An RSI breakout ⚡ confirms bullish momentum, while a BB Squeeze-Off setup 🎯 points to potential volatility expansion. The bullish price action 🔥 backed by rising volumes 🚀 suggests renewed buyer confidence. With resistances overhead, the stock now stands at a critical breakout zone, where follow-through buying could unlock further upside.
Support & Resistance Zones
🟢 Support: 608 | 595 | 588
🔴 Resistance: 628 | 635 | 648
Investment Outlook & Conclusion
📈 Bullish Case – Strong buying interest; scope for further upside.
📉 Bearish Case – Failure to hold above 602 may weaken momentum.
⚡ Momentum Case – Positive; traders may ride short-term moves.
📅 Perspective – Short-term play; long-term view requires caution.
________________________________________
⚠️ Disclaimer – Please Read Carefully
The information shared here is meant purely for learning and awareness. It is not a buy or sell recommendation and should not be taken as investment advice. I am not a SEBI-registered investment advisor, and all views expressed are based on personal study, chart patterns, and publicly available market data.
Trading — whether in stocks or options — carries risk. Markets can move unexpectedly, and losses can sometimes exceed the money you have invested. Past performance or past setups do not guarantee future results.
If you are a beginner, treat this as a guide to understand how the market works — practice on paper trades before risking real money. If you are experienced, always assess your own risk, position sizing, and strategy suitability before entering trades.
Consult a SEBI-registered financial advisor before making any real trading decision. By engaging with this content, you acknowledge full responsibility for your trades and investments.
💬 Found this useful?
🔼 Give this post a Boost to help more traders discover clean, structured learning.
✍️ Drop your thoughts, questions, or setups in the comments — let’s grow together!
🔁 Share with fellow traders and beginners to spread awareness.
👉 “If you liked this breakdown, follow for more clean, structured setups with discipline at the core.”
🚀 Stay Calm. Stay Clean. Trade With Patience.
Trade Smart | Learn Zones | Be Self-Reliant 📊
TATACHEM
Price Action, Demand Zones, and Low-Risk Entry Areas📊 Tata Chemicals – Technical Chart Study
🗓️ Date: May 22, 2025 | NSE: TATACHEM | Chart Type: Daily
**Price Action:**
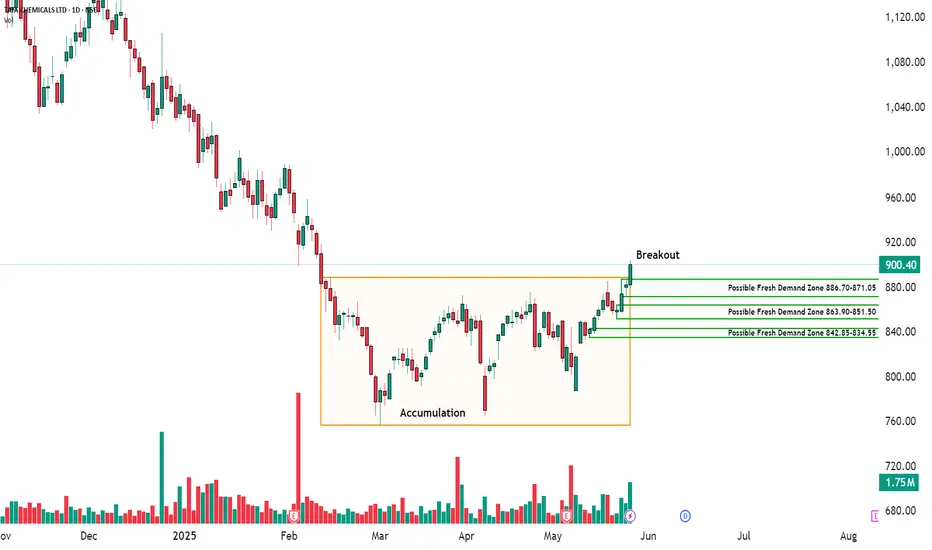
Since mid-April 2025, the stock has exhibited an uptrend characterized by higher lows and higher highs, which is generally considered a positive sign of market strength. The current price stands at 900.40, supported by a strong green candle that closed near its daily high. This recent price movement suggests buying interest in the stock, indicating potential for further upward movement. However, investors are advised to conduct their own analysis and consider market conditions before making any decisions.
**Chart Pattern Analysis:**
TATACHEM is showing a Volatility Contraction Pattern (VCP), with several contraction phases visible since March. The price has been trading within a tightening range of approximately 860 to 900, forming a recognizable pattern handle. During this period, volume declined gradually, which is typical in a VCP setup and may indicate absorption by stronger hands. The last few sessions before the breakout showed tight-range candles with lower volumes and mildly positive delta, often seen as a sign of accumulation. The breakout on May 27 came with approximately double the average volume, suggesting increased participation. While this pattern can indicate a higher probability of continuation, traders should evaluate risk carefully and not rely solely on any single pattern.
**Footprint Analysis:**
Footprint data for TATACHEM leading up to the breakout shows signs of increased buyer activity. The session on May 27 recorded total volume near 1.75 million and a positive delta of +174,050, suggesting buyers were more aggressive than sellers. Previous sessions showed fluctuating delta values, indicating a gradual shift from selling pressure to buying control. This trend may reflect a period of accumulation, with sellers becoming less dominant. Despite these observations, it is important to note that past volume and delta patterns do not guarantee future price movements.
**Demand Zones:**
Potential demand zones have been identified at key price levels: between 886.70 and 871.05, 863.90 and 851.50, and 842.85 and 834.55. These areas could act as support where buying interest may emerge if the stock experiences a pullback. Monitoring these zones can help investors plan entries, but it is essential to consider overall market dynamics and perform due diligence before trading.
**Low-Risk Entry Zone:**
TATACHEM recently entered a zone between 895 and 900 that may offer a lower-risk entry opportunity, with a brief intraday breach observed. For additional confirmation, a sustained close above 900 to 905 accompanied by above-average volume could suggest continuation strength. A potential stop loss could be placed below the handle low near 860, implying a risk of roughly 4.5%. This setup may offer a favorable risk-reward balance, but traders should assess their risk tolerance and market conditions before making decisions.
⚠️ Risk Management Tip: Always trade with a clearly defined stop loss. Avoid entering positions impulsively. It is advisable to start with a smaller quantity and increase your exposure only if the price action confirms the continuation of the trend. Capital protection should always be the priority.
📢 Disclaimer
This content is created purely for educational and informational purposes. It is not intended as investment advice, stock recommendations, or trading tips. Trading and investing in the stock market involves risk. Please consult with a SEBI-registered financial advisor before making any investment decisions. The author/creator is not registered with SEBI and shall not be held responsible for any losses incurred based on this information. Always do your own research and use proper risk management.
👉 If you found this analysis helpful, don’t forget to Follow, so you never miss out on a trade-worthy setup, breakout opportunity, or valuable educational insight again. Stay updated and trade smarter! 💡📈
Tata Chemicals Above 1120, Targeting 1400+Details:
Asset: Tata Chemicals Limited (TATACHEM)
Breakout Level: Above 1120
Potential Target: 1400+
Stop Loss: Below 1120 or as per risk tolerance
Timeframe: Medium to long-term
Rationale: Tata Chemicals has been consolidating for months, and a potential breakout above the 1120 level could signal a strong upward move. The stock has shown resilience and is primed for a bullish breakout that could take it toward the 1400 mark.
Market Analysis:
Technical Setup: After months of consolidation, the breakout level of 1120 is a key resistance point. A move above this level could indicate a renewed bullish trend with significant upside potential.
Consolidation Phase: The prolonged consolidation phase indicates that Tata Chemicals has been building strength, and a breakout could lead to rapid price appreciation.
Price Target:
The target for Tata Chemicals is set at 1400+, based on the potential breakout above 1120 and the stock’s ability to capitalize on positive market momentum.
Risk Management:
A stop loss below 1120 is recommended to manage risk in case the breakout fails to materialize or market conditions change.
Timeframe:
The move toward 1400+ is expected over the medium to long-term, but the pace of the breakout will depend on market conditions and investor sentiment.
Risk-Reward Ratio: The setup offers a favorable risk-reward ratio with a clear breakout level and a significant upside target, making it an attractive opportunity for medium to long-term investors.
As with any investment, ensure thorough analysis of market trends, company fundamentals, and appropriate risk management strategies before making trading decisions.

TATACHEM Breakout analysis to buyTata Chemicals Ltd manufactures and exports basic chemistry and specialty products
If we look at the chart:
The market has broken descending triangle to upside. Price also has taken 200 EMA support recently. RSI also indicates the bullish trend sign. There is also dividend date coming which might boost the buy for Tata Chemicval.
you can execute the trade with R:R of 1:3.
Plan of Action:
Buy: above 1123
Stop loss: 1069
Target: 1317

TATACHEM 1120 CERounding bottom pattern.
Simple analysis.
When momentum creeps in, this would be achieved.
15 Min chart - trigger based.

Tata Chemicals Resistance near 1300 LevelTata Chemicals Limited (nse: tatachem) stock may face the next resistance barrier around the critical 1300 level. Closely monitor this zone. The stock's price action near 1300 remains a focal point, influencing strategic trading decisions.

T A T A C H E M - F U T U R E STATACHEM Futs is on the verge of breaking out of Flag Pattern on 15 min chart with aggressive decrease in OI suggesting strong short-covering.
Risk:Reward very much in favour of bulls.
Could be bought with mentioned stoploss & target.

TATACHEMTATA CHEMICALS is breaking the weekly zone. Keep an eye on this for a stunning move in coming sessions. 20-30% is expected.
NOTE: I'm not a SEBI REG. Study before you invest.

TataChemTatachem is forming Distribution Schematic #2 Wyckoff
presently it is in Phase C
Phase D may give the first bearish action

Long Tata Chemicals - Target 1100For reference
Tata Chemical on daily chart formed Inverted Head and shoulder pattern.
Only problem is - Its lacking volume to prove the upmove.
In case of breakout then Target is 1050 and 1100.
Stop Loss - 993


Detailed analysis on TATACHEM, a good opportunity to buy ?Hello traders,
As market crashed, many stocks have given good downfall from ATH (All time high).
We should look at it as an advantage to accumulate fundamentally good stocks for long term.
Chemical and fertiliser stocks have also given a good retracement with the market.
TATACHEM, one of the good fundamentally strong chemical company has corrected 27% from All Time High.
--------------------------------------------------------------------------------------------------------------------------------------
On the chart, I have provided the Price action analysis and entries on it. Here is a note of fundamental analysis on TATACHEM.
A short description of the company:
Tata Chemicals engages in the manufacture of inorganic chemistry products with plants spread across four continents America, Europe, Africa and Asia. We are the worlds third largest Soda Ash and Indias leading vacuum evaporated iodised salt producer. Their salt works, spread over 36,000 acres, are the largest in Asia. We produce soda ash using synthetic and natural mining process. Of this, 3/4th capacity consists of natural soda ash allowing us significant cost competiveness.
TATACHEM is one of the crown jewels of the Tata group, being the 3rd largest manufacturer of Soda Ash and 6th largest of Sodium Bicarb in the world, both of which have numerous uses - from glass, detergents and medication to being used in EV batteries ⚡
Here are some of the important points to note, and why I think this is one for the long haul:
📍 Soda Ash demand is booming, with increased usage of glass in buildings, increased production of EV batteries for vehicles, and increased demand water treatment.
📍 Tata Chemicals is on track to increase the capacity of Soda Ash production by 30% on top of the 4.4 million tonnes per annum (MTPA) of installed capacity and ongoing expansion, which help further capitalise on growing demand.
📍 Since Tata Chemicals have a cost advantage, relying on the mining of Trona from the US and Africa, they can also pass down the rise in raw material costs to the buyers, and therefore maintains a pricing/margin advantage as well.
📍 Tata Chemicals is now getting into the specialty chemicals space - used in medicines or in pharmaceuticals, or other specialised applications, attracting more sticky customers, higher pricing, better margins, better return ratios, and subsequently even higher valuations.
📍 It has been investing in areas like High-Density Silica, nutraceuticals and EV batteries to drive the next leg of growth.
This Pros of the company are helping to boost the revenue growth of the company resulting as a good stock to invest for long term. The company has a wide scope in the future and is expected to give great profits.
Given below are the links of my ideas of my other long term picks that are recently posted. Do check it out :)
Market has crashed so the stocks have corrected from our entry prices. Don't worry, these companies are fundamentally good and therefore we can keep accumulating on dips.
As always, simple and neat charts so everyone can understand and not make it too complicated.
Will be posting more such ideas like this. Until that, like share and follow :)
check my other ideas to get to know about all the successful trades based on price action.
Thanks,
Aniket.
keep learning and keep earning.

Tata chem near support tata chem bouncin from support can buy for 20 point targets in short term.on breaking the trendline it should give a huge move.

TATA CHEM Bullish at 959-963 rangeTata Chem has broken a good support S1 and the day charts indicate a possible downtrend.
The 959-963 range looks as a good support range and can be used as a buy zone keeping stoplosses in place.
Can expect a 1-1.5% move upside.

TATA Chemicals Ltd - Multiple Indicators 📊 Script: TATACHEM (TATA CHEMICALS LIMITED)
📊 Nifty50 Stock: NO
📊 Sectoral Index: NIFTY 500 / NIFTY MIDCAP
📊 Sector: Commodities Chemicals
📊 Industry: Chemicals & Petrochemicals
Key highlights: 💡⚡
📈 Script is trading at upper band of Bollinger Bands (BB).
📈 MACD is giving crossover.
📈 Double Moving Averages may give crossover in next trading session.
📈 Volume is increasing along with price which is volume breakout.
📈 Current RSI is around 65.
📈 One can go for Swing Trade.
⏱️ C.M.P 📑💰- 1200
🟢 Target 🎯🏆 - 1317
⚠️ Stoploss ☠️🚫 - 1136
⚠️ Important: Always maintain your Risk & Reward Ratio.
⚠️ Purely technical based pick.
✅Like and follow to never miss a new idea!✅
Disclaimer: I am not SEBI Registered Advisor. My posts are purely for training and educational purposes.
Eat🍜 Sleep😴 TradingView📈 Repeat🔁
Happy learning with trading. Cheers!🥂

TATACHEM - Ichimoku Bullish Breakout Stock Name - Tata Chemicals Limited
Ichimoku Cloud Setup :
1). Today's close is above the Conversion Line
2). Future Kumo is Turning Bullish
3). Chikou span is slanting upwards
All these parameters are showing bullishness at Current Market Price
and more bullishness AFTER crossing 1200
#This is not Buy and Sell recommendation to any one. This is for education purpose and a helping hand to learn trading in Market.
# Cloud Trading
# Ichimoku Cloud
# Ichimoku Followers
I hope you all like my analysis.
Please do share your thoughts into comment section.
Please give a like, it motivates me to do analysis.

Tata chemicals consolation and bo#tatachem
#tatachemicals
Just broke after good consolidation
Looks okay
Enter with tight sl
#vr

Tata ChemicalsTata Chemicals (Weekly)
1. Stock is making Flag and Pole Pattern
2. Positive crossover in 5,13 days Exponential moving Average
3. RSI above 60 levels
4. Took support from 13Days Exponential moving average
Tata Chemicals(Daily)
1. Closing above 1195 can be a good buy


TATA CHEM TARGET UPDATE 29-6-2022One can look fresh in range 780-810 for upside 900-950 med term with SL 700..!!!


TATACHEM blasted with 22k Profit !! CheckNSE:TATACHEM
#NSE:TATACHEM shared and it bagged 22k profit, wish everyone bagged good money.
Do follow and like for regular market analysis.
Other 7 More stocks which I shared were blasted today, do check my signature for complete details.
Happy LEarning !!
