Part 7 Trading Master Class Basics of Options in India
An option is a derivative contract that gives the holder the right but not the obligation to buy or sell an underlying asset (like Nifty, Bank Nifty, or a stock) at a predetermined price (called the strike price) before or on a specified date (expiry).
Call Option (CE): Gives the right to buy.
Put Option (PE): Gives the right to sell.
Traders use options for:
Hedging (protecting portfolio losses)
Speculation (betting on price movements)
Income generation (using premium decay)
In India, options are traded on exchanges like NSE and BSE, primarily on indices (Nifty, Bank Nifty, FinNifty) and individual stocks.
Tatachemical

Part 1 Candle Stick Pattern Understanding Option Trading
Option trading is a segment of financial markets that allows investors to buy or sell the right to buy or sell an underlying asset at a predetermined price within a specific time frame. Unlike traditional stock trading, options provide leverage, flexibility, and risk management tools, making them appealing for both hedging and speculative purposes.
Options are derivatives, meaning their value is derived from an underlying asset, such as stocks, indices, commodities, or currencies. An option does not grant ownership of the asset itself but gives the holder the right to engage in a transaction involving the asset.
Types of Options
Options are broadly categorized into two types:
Call Options
A call option gives the buyer the right (but not the obligation) to buy the underlying asset at a specified price, called the strike price, before or on the expiration date.
Buyers of call options generally expect the underlying asset’s price to rise, allowing them to purchase the asset at a lower price than the market value.
Sellers (writers) of call options receive the option premium upfront but take on the obligation to sell the asset if the buyer exercises the option.
Put Options
A put option gives the buyer the right (but not the obligation) to sell the underlying asset at the strike price before or on the expiration date.
Buyers of put options generally expect the underlying asset’s price to fall, allowing them to sell the asset at a higher price than the market value.
Sellers of put options receive the premium but face the obligation to buy the asset if exercised.
Key Components of Options
To understand option trading, one must know the following components:
Underlying Asset – The security or asset on which the option is based (e.g., a stock like Apple or an index like Nifty 50).
Strike Price (Exercise Price) – The predetermined price at which the option can be exercised.
Expiration Date – The date on which the option expires. After this date, the option becomes worthless.
Premium – The price paid by the buyer to the seller for the rights conferred by the option.
Intrinsic Value – The difference between the underlying asset’s current price and the strike price, representing the real, immediate value of the option.
Time Value – The portion of the premium that reflects the possibility of the option gaining value before expiration. Time decay reduces this value as the expiration date approaches.
How Options Work
Let’s illustrate with an example:
Suppose a stock is trading at ₹1,000, and you buy a call option with a strike price of ₹1,050, expiring in one month, paying a premium of ₹20.
If the stock rises to ₹1,100 before expiration, you can exercise the option to buy at ₹1,050, making a profit of ₹50 per share minus the premium, i.e., ₹30 per share.
If the stock stays below ₹1,050, you would not exercise the option, losing only the premium of ₹20.
This example highlights two key advantages of options:
Leverage: You control more assets with less capital compared to buying the stock outright.
Limited Risk: The maximum loss for the buyer is the premium paid, unlike stock trading where losses can be higher.

Physiology of Trading in the AI Era1. Human Physiology and Trading: The Foundations
1.1 Stress and the Fight-or-Flight Response
When humans trade, they are not just using rational logic; they are also battling their physiological responses. Every trade triggers an emotional and bodily reaction. For example:
Adrenaline release when markets move rapidly in one’s favor or against them.
Increased heart rate and blood pressure during volatile sessions.
Sweating palms and muscle tension as risk builds.
This “fight-or-flight” response, mediated by the sympathetic nervous system, has been part of human survival for millennia. In trading, however, it can impair rational decision-making. A surge of cortisol (the stress hormone) may lead to panic selling, hesitation, or impulsive buying.
1.2 Dopamine and Reward Pathways
Trading can be addictive. Each win activates dopamine in the brain’s reward circuitry, similar to gambling or gaming. Traders often “chase” that feeling, even when logic dictates restraint. Losses, on the other hand, trigger stress chemicals, leading to cycles of overtrading, revenge trading, or withdrawal.
1.3 Cognitive Load and Fatigue
Traditional trading involves constant information processing—charts, news, market data, risk assessments. This consumes enormous cognitive energy. Long sessions can lead to decision fatigue, reducing accuracy and discipline.
Thus, before AI, trading was fundamentally a battle of human physiology against the demands of complex markets.
2. The AI Disruption in Trading
2.1 Rise of Algorithmic and High-Frequency Trading (HFT)
AI-driven systems can execute thousands of trades per second, scan global markets, detect patterns invisible to humans, and adjust strategies in real-time. These machines do not suffer from fear, greed, or fatigue.
For human physiology, this means:
Reduced direct execution stress (since machines handle it).
Increased monitoring stress (humans must supervise systems).
Psychological dislocation (traders may feel less control).
2.2 Machine Learning in Decision Support
AI models analyze sentiment from social media, evaluate economic indicators, and forecast price moves. Instead of staring at multiple screens, traders increasingly interpret AI dashboards and signals. This shifts the physiological strain from reaction-based stress to interpretation-based stress.
2.3 Automation and Human Role Redefinition
In the AI era, humans are less about execution and more about strategy, oversight, and risk management. Physiology adapts to:
Lower manual workload.
Higher demand for sustained attention.
Possible under-stimulation leading to boredom and disengagement.
3. Physiological Challenges of Trading with AI
3.1 Stress of Oversight
Even though AI reduces execution stress, it creates new types of anxiety:
“What if the algorithm fails?”
“What if there is a flash crash?”
“What if my model is outdated?”
This “meta-stress” is often harder to manage because the trader is not directly in control. Cortisol levels may remain high over long periods, contributing to chronic stress.
3.2 Cognitive Overload from Complexity
AI outputs are highly complex—probability charts, heatmaps, predictive models. Interpreting them requires intense concentration, taxing the prefrontal cortex (responsible for logic and planning). Prolonged exposure leads to cognitive fatigue, headaches, and reduced analytical clarity.
3.3 Screen Time and Physical Health
AI-based trading often demands sitting for long hours in front of multiple screens. This leads to:
Eye strain (computer vision syndrome).
Poor posture and musculoskeletal stress.
Reduced physical activity, increasing long-term health risks.
3.4 Emotional Detachment vs Overreliance
Some traders experience emotional detachment because AI reduces the “thrill” of trading. Others, however, become overly reliant, experiencing anxiety when AI signals conflict with personal judgment. Both conditions alter physiological balance—either numbing dopamine pathways or overstimulating stress responses.
4. Positive Physiological Impacts of AI in Trading
4.1 Reduced Acute Stress
Since AI handles rapid execution, traders are spared the intense “fight-or-flight” responses of old floor trading. Heart rate variability (HRV) studies show that algorithmic traders often experience lower peak stress events compared to manual traders.
4.2 Better Sleep and Recovery (Potentially)
If managed well, AI systems allow for reduced night sessions and improved rest. However, this is true only when traders trust their systems.
4.3 Cognitive Augmentation
By filtering noise and providing data-driven insights, AI reduces raw information overload. Traders can focus on strategic thinking, which may be less physiologically taxing than high-speed execution.
5. Neurophysiology of Human-AI Interaction
5.1 Brain Plasticity and Adaptation
Just as the brain adapted to calculators and computers, it is adapting to AI in trading. Neural pathways reorganize to prioritize pattern recognition, probabilistic thinking, and machine-interpretation skills.
5.2 The Stress of Uncertainty
The human brain dislikes uncertainty. AI, by nature, operates probabilistically (e.g., “there is a 70% chance of price rise”). This constant probabilistic feedback keeps traders in a state of anticipatory stress, leading to sustained low-level cortisol release.
5.3 Trust and the Oxytocin Factor
Neuroscience shows that trust is mediated by oxytocin. When traders trust their AI systems, oxytocin reduces stress. But if trust breaks (due to errors or losses), physiological stress spikes significantly higher than in traditional trading.
6. The Future of Trading Physiology in the AI Era
6.1 Neural Interfaces and Brain-Computer Trading
As AI advances, direct brain-computer interfaces may allow traders to interact without keyboards or screens. This will blur the line between human physiology and machine execution.
6.2 AI as Physiological Regulator
AI could not only trade but also monitor the trader’s physiological state—detecting stress, suggesting breaks, or even auto-reducing risk exposure when cortisol levels spike.
6.3 From Physiology to Philosophy
Ultimately, the AI era forces us to ask: What is the role of human physiology in a world where machines outperform us? Perhaps the answer lies not in competing, but in complementing—using uniquely human traits while allowing AI to handle mechanical execution.
Conclusion
The physiology of trading in the AI era is a fascinating intersection of biology and technology. Human bodies, wired for survival in primal environments, now face markets dominated by machines that never fatigue or feel fear. While AI reduces some physiological burdens—like execution stress—it introduces new forms of stress, such as oversight anxiety, cognitive overload, and emotional detachment.
The challenge for modern traders is not to resist AI but to manage their physiology in harmony with it. By using mindfulness, ergonomic design, physical health practices, and new neuro-adaptive tools, traders can maintain resilience.
In the long run, the physiology of trading will evolve. The human brain adapts, neural pathways shift, and AI itself may become an ally in regulating our stress. Trading in the AI era is no longer just about markets—it is about the integration of human physiology with machine intelligence.
Part 4 Learn Institutional Trading Option Greeks (Risk Measures)
Greeks are mathematical tools that measure how sensitive an option is to different factors:
Delta: Sensitivity to price change. (How much option moves if stock moves ₹1).
Gamma: Rate of change of delta.
Theta: Time decay (how much option loses value as expiry nears).
Vega: Sensitivity to volatility.
Rho: Sensitivity to interest rates.
Traders use Greeks to build precise strategies.
Option Strategies
Options can be combined into powerful strategies:
Single-leg: Buy call, Buy put, Sell call, Sell put.
Spreads: Bull call spread, Bear put spread.
Neutral strategies: Iron condor, Butterfly spread, Straddle, Strangle.
Advanced: Calendar spread, Ratio spread.
Each strategy suits different market conditions (bullish, bearish, sideways, volatile).

PCR Trading StrategiesIntroduction to Options Trading
The world of financial markets is vast, offering different ways to invest, trade, and manage risks. Among these instruments, Options have gained immense popularity because they offer flexibility, leverage, and unique strategies that regular stock trading cannot provide.
Options trading is not new—it has been around for decades in global markets—but in recent years, with the rise of online platforms and growing financial literacy, even retail traders are actively participating in it.
At its core, an option is a financial contract that gives the buyer the right, but not the obligation, to buy or sell an underlying asset (like a stock, index, currency, or commodity) at a predetermined price, within a certain period. This ability to choose—without compulsion—is what makes options unique compared to other financial products.
Basics of Options (Calls & Puts)
There are two main types of options:
Call Option: Gives the holder the right to buy the underlying asset at a fixed price (called the strike price) before or on the expiry date.
Example: You buy a Reliance call option with a strike price of ₹2500. If Reliance rises to ₹2700, you can buy at ₹2500 and gain from the difference.
Put Option: Gives the holder the right to sell the underlying asset at the strike price before expiry.
Example: You buy a Nifty put option with a strike price of 22,000. If Nifty falls to 21,500, your put gains in value since you can sell higher (22,000) while the market trades lower.
In simple terms:
Calls = Right to Buy
Puts = Right to Sell

PSU & Infrastructure RallyIntroduction
The Indian stock market often moves in cycles—sometimes technology stocks lead, sometimes consumption stocks take the front seat, and sometimes financials dominate the headlines. In recent years, one of the strongest and most eye-catching trends has been the rally in Public Sector Undertakings (PSUs) and Infrastructure stocks.
This rally has surprised many investors. For decades, PSU stocks were treated as “slow movers,” known for dividends but not for sharp price appreciation. Infrastructure companies also had their share of challenges—debt burdens, project delays, and regulatory hurdles. Yet, from 2020 onwards, both these sectors have staged a powerful comeback, creating significant wealth for investors.
In this essay, we will break down the reasons behind the PSU & Infrastructure rally, the role of government policies, investor psychology, macroeconomic conditions, and future outlook. We will also examine challenges, risks, and strategies investors can consider.
1. Understanding PSU & Infrastructure Sectors
1.1 What are PSUs?
Public Sector Undertakings (PSUs) are companies where the Government of India holds a majority stake (usually above 51%). These companies were originally created to control strategic industries, ensure employment, and provide services to the public.
They operate across sectors:
Energy & Oil: ONGC, Oil India, IOC, BPCL, HPCL.
Banking & Financials: SBI, Bank of Baroda, PNB, LIC.
Power & Utilities: NTPC, Power Grid, NHPC, SJVN.
Defence & Engineering: HAL, BEL, BEML, Cochin Shipyard.
Infrastructure-linked: IRCTC, IRFC, RVNL, NBCC.
For a long time, PSU stocks were considered "value traps." Investors believed these companies were controlled by government decisions rather than pure profit motives. But things have started to change.
1.2 What is the Infrastructure Sector?
The infrastructure sector includes companies involved in building and maintaining physical systems like roads, railways, airports, ports, bridges, housing, water supply, and energy projects.
Key players include:
Construction companies: L&T, NCC, KNR Construction.
Railways & Transport: RVNL, IRCON, IRFC.
Power & Energy Infrastructure: NTPC, Adani Transmission, Power Grid.
Cement & Steel (linked to infra growth): UltraTech Cement, JSW Steel.
Infrastructure is often called the backbone of the economy. A country’s GDP growth depends heavily on the quality of its infrastructure.
2. Why Are PSU & Infrastructure Stocks Rallying?
The rally is not a coincidence. Several structural, policy-driven, and global factors are working together. Let’s break them down:
2.1 Government Push on Capital Expenditure (Capex)
One of the biggest drivers is the Indian government’s consistent increase in infrastructure spending.
In Union Budgets (2022–2025), capital expenditure has grown at double-digit rates.
The government has allocated massive funds for roads, highways, railways, and renewable energy.
The National Infrastructure Pipeline (NIP) plans ₹111 lakh crore investment in infrastructure between 2019 and 2025.
Programs like Gati Shakti, Smart Cities Mission, and Bharatmala are boosting construction activity.
This creates a multiplier effect: cement demand rises, construction companies get more projects, railway stocks gain, and PSU banks benefit by financing these projects.
2.2 Revival of PSU Banks
PSU banks, once seen as weak due to Non-Performing Assets (NPAs), have staged a dramatic recovery.
Bad loans have reduced significantly.
Credit growth is at record highs (double-digit growth in 2023–25).
PSU banks are reporting all-time high profits.
With financial health improving, investors’ confidence in PSUs has returned.
Since banks are the backbone of financing infrastructure projects, their revival further fuels the rally.
2.3 Defence & Strategic Importance
Global geopolitical tensions have increased defence spending worldwide. India, too, is focusing on self-reliance in defence (Atmanirbhar Bharat).
Companies like HAL, BEL, Mazagon Dock, Cochin Shipyard have seen massive order inflows.
Defence PSUs are reporting strong earnings and full order books for the next decade.
The export market is also opening up—India is now exporting defence equipment to friendly nations.
This has turned defence PSUs into multi-baggers in recent years.
2.4 Disinvestment & Privatisation Story
For years, the government has been trying to monetise and privatise PSU assets.
Strategic sales like Air India have boosted sentiment.
LIC IPO brought renewed attention to PSU space.
The market believes future disinvestments (BPCL, Shipping Corporation, etc.) can unlock hidden value.
This narrative has created speculative interest, which supports price rallies.
2.5 Dividend Yield Attraction
Many PSU companies offer very high dividend yields (4–8%), much higher than bank deposits.
In times of global uncertainty, foreign investors look for safe, stable income—PSUs fit this profile. When combined with growth in earnings, dividend-paying PSUs become doubly attractive.
2.6 Railways & Infra Boom
Railway-linked stocks like RVNL, IRCON, IRFC, RailTel have been some of the biggest gainers.
Indian Railways is undergoing modernization at an unprecedented scale.
Projects like Vande Bharat trains, electrification, freight corridors, and station redevelopment are attracting massive investments.
These companies are reporting record order books.
This has triggered a railways mini-rally within the broader infrastructure rally.
2.7 Global Factors
Global trends are also playing a role:
China+1 Strategy: Many global companies are diversifying away from China, boosting demand for Indian infrastructure.
Commodity Cycle: Steel, cement, and energy cycles support infra companies’ growth.
Geopolitical Risks: Investors view India as a safe growth story compared to volatile markets.
3. Investor Psychology Behind the Rally
The PSU & Infrastructure rally is not just about fundamentals—it’s also about changing perceptions.
Earlier: Investors believed PSUs = inefficient + slow-moving.
Now: Investors see them as undervalued, dividend-paying, and backed by government growth plans.
Retail investors, especially in India, have driven momentum. With railway and defence PSUs showing 10x to 20x returns in a few years, fear of missing out (FOMO) has pulled in more buyers.
4. Risks & Challenges in PSU & Infra Rally
No rally is risk-free. Investors must remain aware of challenges:
Government Interference – PSU companies may prioritize social objectives over profits.
Cyclical Nature – Infra and PSU rallies depend heavily on government spending; if budgets tighten, growth may slow.
Execution Delays – Infra projects face land acquisition, legal, and environmental delays.
Global Slowdown – If global demand weakens, exports and commodity-linked infra stocks may suffer.
Valuation Concerns – Many PSU stocks have already rallied 200–500%. At some point, valuations may look stretched.
5. Future Outlook
Despite risks, the outlook for PSU & Infrastructure remains structurally positive:
India aims to become a $5 trillion economy—this is impossible without strong infra.
The government’s focus on Make in India, Atmanirbhar Bharat, and Defence exports supports PSU companies.
Digital infrastructure (5G rollout, Smart Cities) creates new opportunities.
Renewable energy push (solar, wind, hydro) benefits power PSUs like NTPC, NHPC.
In short, this is not just a short-term rally—it is a structural growth story with long-term potential.
6. How Investors Can Approach This Rally
For investors, the key is to approach with strategy and caution:
Focus on Leaders – Instead of chasing every PSU, stick to strong companies with robust fundamentals (SBI, NTPC, BEL, HAL, RVNL, L&T).
Look for Long-Term Themes – Defence, railways, power transmission, renewable energy are structural stories.
Dividend + Growth Combo – PSUs with both high dividend yields and growth potential are safer bets.
Avoid Overvaluation – Don’t enter after massive rallies; wait for corrections.
Diversify – Mix infra PSUs with private players (like L&T, Adani Ports) to reduce risk.
7. Case Studies of Recent Winners
7.1 Hindustan Aeronautics Ltd (HAL)
Once ignored, HAL is now a defence giant with export opportunities.
Stock has given 10x returns in 5 years.
7.2 Rail Vikas Nigam Ltd (RVNL)
Benefited from railway modernization.
Stock surged over 20x from 2020–2025.
7.3 SBI & Other PSU Banks
Recovered from NPAs.
Posting record profits, stock prices doubled/tripled.
7.4 NTPC & Power Grid
Benefiting from India’s massive renewable energy targets.
Stable dividend + growth.
These examples show why the rally has captured public attention.
8. Conclusion
The PSU & Infrastructure Rally is one of the most defining themes in the Indian stock market in recent years. What began as a quiet recovery in undervalued PSU banks and infra companies has turned into a full-blown rally fueled by:
Government capex push,
Defence modernization,
Railway expansion,
Revival of PSU banks,
Strong dividend yields,
Disinvestment hopes.
The rally has redefined investor sentiment towards PSUs, turning them from neglected assets into market favorites.
That said, investors must remain mindful of risks—government policies, project delays, or global slowdowns can temporarily derail the momentum.
But structurally, the story remains strong: India’s journey to a $5 trillion economy cannot happen without PSU & infrastructure growth. For long-term investors, this space offers both stability and growth potential—a rare combination.

Algorithmic & AI-Powered Trading1. Introduction: The Shift from Manual to Machine
For centuries, trading was purely a human skill — traders watched ticker tapes, read news, and relied on gut instinct. But as markets grew faster and more complex, human reaction time simply couldn’t keep up.
Enter algorithmic trading — a world where trades are executed in milliseconds, strategies are tested on decades of data, and human bias takes a back seat.
Over the past decade, Artificial Intelligence (AI) has supercharged this process.
Now, trading systems not only follow pre-set rules but also learn from market data, adapt strategies in real time, and detect patterns invisible to human eyes.
In 2025, over 70% of all equity trades in developed markets are algorithmic. In some markets, AI-powered systems handle more trading volume than humans.
2. What is Algorithmic Trading?
At its core, algorithmic trading is:
The use of computer programs to execute trades based on a defined set of rules and parameters.
Key features:
Rule-based execution: Trades are placed when certain conditions are met (e.g., price crosses moving average).
Speed & automation: No waiting for human clicks; execution is near-instant.
Backtesting: Strategies can be tested on historical data before risking real money.
Scalability: Can handle hundreds of trades simultaneously.
Example:
If a stock’s 50-day moving average crosses above its 200-day moving average, buy 100 shares. If the reverse happens, sell.
3. What is AI-Powered Trading?
AI-powered trading takes algorithms further:
Instead of pre-programmed rules, AI systems can learn patterns, adapt strategies, and make predictions based on data.
Core difference:
Algorithmic trading = fixed rules.
AI trading = adaptive, self-learning rules.
AI capabilities in trading:
Pattern recognition – spotting trends in price, volume, sentiment, or macro data.
Predictive modeling – forecasting future price movements.
Reinforcement learning – improving strategies based on feedback from trades.
Natural Language Processing (NLP) – reading and interpreting news, social media, and financial reports.
4. Types of Algorithmic & AI Trading Strategies
There’s a wide range of strategies — some decades old, others made possible only by modern AI.
A. Trend-Following Strategies
Based on technical indicators like Moving Averages, RSI, MACD.
Goal: Ride the trend up or down until it shows signs of reversal.
AI twist: Deep learning models can predict trend continuation probability.
B. Mean Reversion Strategies
Assumes prices will revert to an average over time.
Example: If a stock is far above its 20-day moving average, short it; if far below, buy.
AI twist: Machine learning models detect the optimal mean reversion window dynamically.
C. Arbitrage Strategies
Exploiting price differences between markets or instruments.
Example: If a stock trades at ₹100 in NSE and ₹101 in BSE, buy low, sell high instantly.
AI twist: AI can scan thousands of instruments and markets for fleeting arbitrage opportunities.
D. Statistical Arbitrage
Uses correlations between assets (pairs trading).
Example: If Reliance and ONGC usually move together, but Reliance rallies while ONGC lags, trade expecting convergence.
AI twist: AI can detect shifting correlations and adapt.
E. High-Frequency Trading (HFT)
Ultra-fast trades exploiting tiny inefficiencies.
Requires low-latency infrastructure.
AI twist: AI can dynamically adjust order placement to reduce slippage.
F. Sentiment Analysis Trading
Uses NLP to gauge market sentiment from news, tweets, blogs.
Example: AI detects a surge in positive sentiment toward Tesla, triggering a buy.
AI twist: Transformer-based NLP models (like GPT) can analyze sarcasm, tone, and context better than older keyword-based systems.
G. Market Making
Posting buy and sell orders to earn the bid-ask spread.
Requires continuous price adjustment.
AI twist: Reinforcement learning optimizes spread width for profitability.
5. Key Components of an Algorithmic/AI Trading System
Building a profitable system is more than just coding a strategy. It needs an ecosystem:
Market Data Feed
Real-time & historical prices, volumes, order book data.
AI needs clean, high-quality data to avoid bias.
Signal Generation
Algorithm or AI model generates buy/sell/hold signals.
Could be purely quantitative or include sentiment and fundamentals.
Execution Engine
Sends orders to the exchange with minimal delay.
AI can optimize execution to avoid market impact.
Risk Management Module
Position sizing, stop-loss levels, portfolio diversification.
AI can dynamically adjust risk based on volatility.
Backtesting Framework
Tests strategy on historical data.
Important: Avoid overfitting — making the model too perfect for past data but useless in the future.
Monitoring & Maintenance
Even AI needs human oversight.
Models can degrade if market behavior shifts (concept drift).
6. Role of Machine Learning in Trading
Machine Learning (ML) is the backbone of AI-powered trading.
Popular ML techniques in trading:
Supervised Learning – Train on historical prices to predict next-day returns.
Unsupervised Learning – Cluster stocks with similar price behavior.
Reinforcement Learning – Learn by trial and error in simulated markets.
Deep Learning – Use neural networks to detect complex patterns in large datasets.
Example:
A neural network could take in:
Price data
Volume data
News sentiment
Macroeconomic indicators
…and output a probability of the stock rising in the next 5 minutes.
7. Advantages of Algorithmic & AI Trading
Speed – Executes in milliseconds.
Accuracy – No fat-finger trade errors.
No emotional bias – Sticks to the plan.
Scalability – Monitors hundreds of assets.
24/7 markets – Especially useful in crypto trading.
Pattern discovery – Finds relationships humans might miss.
8. Risks & Challenges
Not everything is a profit paradise.
A. Technical Risks
System crashes
Internet outages
Latency issues
B. Model Risks
Overfitting to historical data
Concept drift (market behavior changes)
C. Market Risks
Sudden news events (e.g., black swan events)
Flash crashes caused by runaway algorithms
D. Regulatory Risks
Exchanges and regulators monitor algo trading to prevent manipulation.
Some AI strategies might accidentally trigger market manipulation patterns.
9. Risk Management in AI Trading
A robust system must:
Use position sizing (risk only 1-2% of capital per trade).
Place stop-loss & take-profit levels.
Have circuit breakers to halt trading if unusual volatility occurs.
Validate models regularly against out-of-sample data.
10. Backtesting & Optimization
Before deploying:
Data cleaning – Remove bad ticks, adjust for splits/dividends.
Out-of-sample testing – Use unseen data to test robustness.
Walk-forward testing – Periodically re-train and test.
Monte Carlo simulations – Stress-test strategies under random conditions.
11. Real-World Applications
Hedge Funds: Renaissance Technologies, Two Sigma.
Banks: JPMorgan’s LOXM AI execution algorithm.
Retail: Zerodha Streak, AlgoTrader.
Crypto: AI bots analyzing blockchain transactions.
12. Future Trends in AI Trading
Explainable AI – Making AI’s decision-making transparent.
Hybrid human-AI teams – AI generates signals; humans validate.
Quantum computing – Potentially breaking speed and complexity barriers.
Multi-agent reinforcement learning – AI “traders” competing/cooperating in simulations.
13. Conclusion
Algorithmic & AI-powered trading is no longer just a Wall Street tool — it’s accessible to retail traders, thanks to low-cost cloud computing, APIs, and open-source machine learning libraries.
The key to success isn’t just having an algorithm — it’s about data quality, model robustness, disciplined risk management, and constant adaptation.
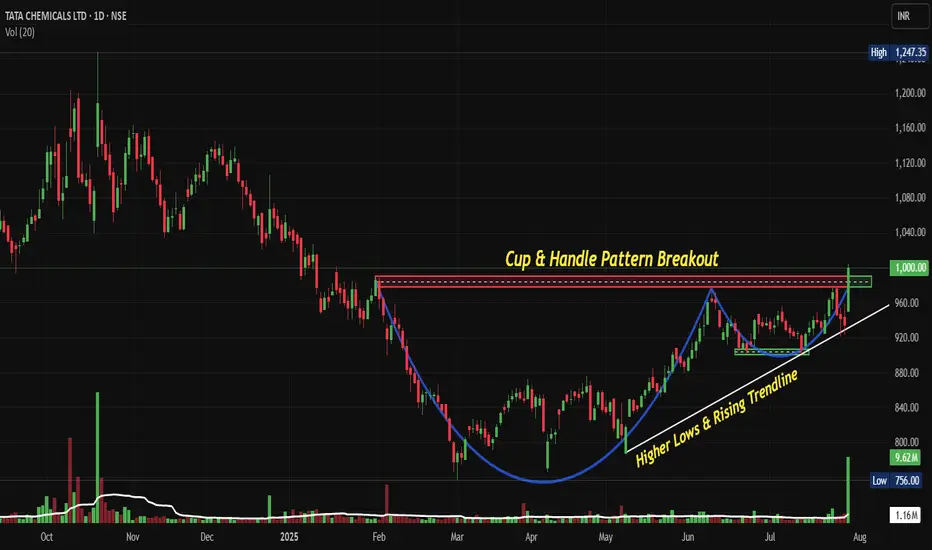
TATACHEM: Breaks out of Cup & Handle Breakout Post Q1 FY 26NSE:TATACHEM Breaks Out: The Cup and Handle Formation That Could Signal New Highs Post Good Q1 FY 26 with Margin Expansion.
Price Action:
Trend Structure
• Long-term uptrend intact with a higher lows pattern since March 2025
• Strong momentum breakout above key resistance at 1,000 levels
• Price action showing bullish continuation after brief consolidation
• Current trading above all major moving averages (20, 50, 200 EMA)
Breakout Characteristics
• Clean breakout above resistance
• Volume expansion confirming institutional participation
• No immediate rejection at breakout level, suggesting strength
• Momentum favouring further upside continuation
Volume Spread Analysis:
Volume Pattern:
• Significant volume spike during the breakout phase in July 2025
• Volume contraction during handle formation (typical healthy pattern)
• Above-average volumes during cup formation, indicating accumulation
• Recent volume expansion suggests institutional buying interest
Volume Confirmation:
• Breakout supported by 2-3x average daily volume
• Previous resistance turning into support with volume backing
• Accumulation-distribution pattern favourable for continued upside
Chart Pattern:
• The chart displays a classic Cup and Handle pattern formation spanning from Jan 2025 to July 2025
• The "Cup" formation shows a rounded bottom with the low around 750-780 levels during March 2025
• The "Handle" represents the consolidation phase between June-July 2025, around 920-960 levels
• Clear breakout above the 1,000 resistance level with strong volume confirmation
Key Technical Levels
• Primary Support: 920-950 (handle low and recent consolidation)
• Secondary Support: 850-880 (mid-cup level)
• Major Support: 750-780 (cup bottom)
• Immediate Resistance: 1,050-1,080 (psychological levels)
• Target Resistance: 1,200-1,250 (measured move from cup depth)
Trade Setup and Strategy:
Entry Levels:
• Aggressive Entry: 1,000-1,020 (on breakout confirmation)
• Conservative Entry: 950-980 (on pullback to handle support)
• Scale-in Entry: 920-950 (major support retest)
Exit Levels:
• Target 1: 1,100-1,120 (initial resistance cluster)
• Target 2: 1,200-1,250 (measured move target)
• Target 3: 1,300-1,350 (extension target based on cup depth)
Stop-Loss Strategy:
• Initial Stop-Loss: 920 (below handle low)
• Trailing Stop: 950 after Target 1 achievement
• Risk-Reward Ratio: 1:3 to 1:4 on conservative entry
Position Sizing and Risk Management:
Position Sizing:
• Allocate 2-3% of portfolio for this trade
• Calculate position size based on stop-loss distance
• Consider scaling in approach for better average entry
Risk Management:
• Maximum risk per trade: 1-2% of total capital
• Use position sizing formula: Risk Amount ÷ (Entry - Stop Loss)
• Maintain diversification across sectors and market caps
Risk Factors:
• Broader market correction could impact individual stock performance
• Sector-specific headwinds in the chemicals industry
• Global economic slowdown affecting demand
Fundamental and Sectoral Backdrop:
Recent Financial Performance:
• Q1 FY26 results showed consolidated revenue of ₹3,719 Cr with EBITDA of ₹649 Cr and PAT of ₹316 Cr
• Standalone revenue at ₹1,169 Cr, up 11.65% compared to Q1FY25, with PAT of ₹307 Cr, up 20%
• Stock gained 16.66% over the last three months
• Strong operational performance supporting technical breakout
Sectoral Outlook:
• The Chemicals market in India is projected to grow by 3.46% (2025-2029), resulting in a market volume of US$35.4bn in 2029
• India's speciality chemicals market is expected to increase at a CAGR of 12% to US$64 billion by 2025
• The chemical industry, currently valued at around US$250 billion, aims to grow to US$300 billion by 2025
• The sector is projected to grow by 11 to 12 per cent during 2021–27, tripling its global market share by 2040
Investment Thesis:
• Strong sectoral tailwinds supporting long-term growth
• Company's positioning in the speciality chemicals segment
• Potential beneficiary of India's manufacturing growth story
• Technical breakout aligning with fundamental strength
Key Monitoring Points:
Technical Triggers:
• Sustain above 1,000 levels for breakout confirmation
• Volume patterns on any pullbacks
• Price action at target levels for profit booking decisions
Fundamental Catalysts:
• Quarterly earnings performance and guidance
• New project announcements or capacity expansions
• Sectoral policy developments and government initiatives
• Global chemical prices and demand trends
Risk Monitoring:
• A break below 920 levels would invalidate the bullish setup
• Broader market sentiment and global risk-off scenarios
• Sector rotation away from chemicals and industrials
• Company-specific news flow and management commentary
My Take:
The combination of technical breakout, strong fundamentals, and positive sector outlook makes NSE:TATACHEM an attractive investment proposition at current levels, with the cup and handle pattern suggesting potential for significant upside over the next 6-12 months.
Keep in the Watchlist and DOYR.
NO RECO. For Buy/Sell.
📌Thank you for exploring my idea! I hope you found it valuable.
🙏FOLLOW for more
👍BOOST if you found it useful.
✍️COMMENT below with your views.
Meanwhile, check out my other stock ideas on the right side until this trade is activated. I would love your feedback.
Disclaimer: "I am not a SEBI REGISTERED RESEARCH ANALYST AND INVESTMENT ADVISER."
This analysis is intended solely for informational and educational purposes and should not be interpreted as financial advice. It is advisable to consult a qualified financial advisor or conduct thorough research before making investment decisions.
TATAchem double correction for more than 6 monthsTatachem was in double correction for more than 6 months
done w-x-y corrective move
Now need to break above 1113 level (resistance trendline)
for resuming uptrend..
more upside if breaks 1162
MACD +ve crossover
Disclaimer : I AM NOT SEBI REGISTERED. Post is only educational purpose of elliott wave analysis.

"Retailer Trap in Action? | TATAMOTORS✅"Tata Motors (-3.8%) has hit its lowest point since January, down 28% from July highs. Are you buying the dip?"
✅"Inducement is a process where market movements are manipulated to encourage traders to take positions that are likely to fail. The idea is that large institutions can influence price movements to attract various traders and trap them in losing trades."
💡Insight:
📍Business Split: Tata Motors is separating its Passenger and Commercial Vehicle businesses to streamline operations, with a Jaguar Land Rover IPO expected soon
📍Sales Boosting Discounts: October 2024 sees major festive discounts on models like the Nexon and Harrier to regain market share
📍Sales Performance: A 2% year-over-year increase in Q1 FY25, led by strong growth in commercial vehicles despite slight dips in passenger vehicles
💡✍️Applied Tools:-
1️⃣Trap Trading
2️⃣Strong order block zone
3️⃣Fake channel breakout
4️⃣Inducement Strategy
✅Check out my TradingView profile to see how we analyze charts and execute trades.
⭕️ Swing Trading opportunity: Price Action Analysis Alert !!!⭕️
💡FNO Stocks📉📈📊
🙋♀️🙋♂️If you have any questions about this stock, feel free to reach out to me.
📍📌Thank you for exploring our idea! We hope you found it valuable.
🙏FLLOW for more !
👍LIKE if useful !
✍️COMMENT Below your view !

TATA CHEMICALS - Short Term Price consolidate since March 2024 and price is near long term support line. Price breakout this week and we can expect 100 Rs profit in this stock in short term. Also, fundamentally strong stock.

Tata Chemicals Above 1120, Targeting 1400+Details:
Asset: Tata Chemicals Limited (TATACHEM)
Breakout Level: Above 1120
Potential Target: 1400+
Stop Loss: Below 1120 or as per risk tolerance
Timeframe: Medium to long-term
Rationale: Tata Chemicals has been consolidating for months, and a potential breakout above the 1120 level could signal a strong upward move. The stock has shown resilience and is primed for a bullish breakout that could take it toward the 1400 mark.
Market Analysis:
Technical Setup: After months of consolidation, the breakout level of 1120 is a key resistance point. A move above this level could indicate a renewed bullish trend with significant upside potential.
Consolidation Phase: The prolonged consolidation phase indicates that Tata Chemicals has been building strength, and a breakout could lead to rapid price appreciation.
Price Target:
The target for Tata Chemicals is set at 1400+, based on the potential breakout above 1120 and the stock’s ability to capitalize on positive market momentum.
Risk Management:
A stop loss below 1120 is recommended to manage risk in case the breakout fails to materialize or market conditions change.
Timeframe:
The move toward 1400+ is expected over the medium to long-term, but the pace of the breakout will depend on market conditions and investor sentiment.
Risk-Reward Ratio: The setup offers a favorable risk-reward ratio with a clear breakout level and a significant upside target, making it an attractive opportunity for medium to long-term investors.
As with any investment, ensure thorough analysis of market trends, company fundamentals, and appropriate risk management strategies before making trading decisions.


TATA Steel LtdImportant points are marked in the chart.
*Do own research before investing in Equity market.

Falling Wedge pattern breakout in TATACHEMTATA CHEMICALS LTD
Key highlights: 💡⚡
✅On 1 Day Time Frame Stock Showing Breakout of Falling Wedge Pattern.
✅Strong Bullish Candlestick Form on this timeframe.
✅It can give movement up to the Breakout target of 1295+.
✅Can Go Long in this Stock by placing a stop loss below 1040-.

TATACHEM Breakout analysis to buyTata Chemicals Ltd manufactures and exports basic chemistry and specialty products
If we look at the chart:
The market has broken descending triangle to upside. Price also has taken 200 EMA support recently. RSI also indicates the bullish trend sign. There is also dividend date coming which might boost the buy for Tata Chemicval.
you can execute the trade with R:R of 1:3.
Plan of Action:
Buy: above 1123
Stop loss: 1069
Target: 1317

TATA CHEMICALS - Swing Trade Analysis - 11th April #stocksTATA CHEMICALS (1W TF) Update - 11th April, 2024
- The stock is still in a clear uptrend on a Weekly Time Frame
- It needs to break the 1200 Levels and consolidate before another solid upmove till around 1350 & 1450
- Please ensure to keep your SL and Risk Management in play constantly
~ TradeRyte ~

Tata Chemicals Resistance near 1300 LevelTata Chemicals Limited (nse: tatachem) stock may face the next resistance barrier around the critical 1300 level. Closely monitor this zone. The stock's price action near 1300 remains a focal point, influencing strategic trading decisions.

TATACHEM: BULLISH REVERSAL SETUP NSE:TATACHEM
Tata Chemicals Ltd. is a holding company, which engages in the manufacture and sale of inorganic chemicals.
Technical View
Trading at major support zones and there are multiple confluences.
1. Weekly timeframe trendline support.
2. horizontal support formation from last one year.
3. Bull channel Support.
on top of that Stochastic indicator also shows reversal.
Here look at the daily chart and it has formed a turbo breakout.
Stoploss shall be below the green zone and on a weekly candle-closing basis otherwise it would be just a liquidity grab situation.
It can continue this range foe few more days so keep on radar.
Keep Learning,
Happy trading.

Momentum Swing Idea| Large Cap chemical StockTata Chemicals Ltd
Incorporated in 1939, Tata Chemicals Ltd manufactures and exports basic chemistry and specialty products
Financial : strong
Market Cap ₹ 30,007 Cr. Current Price ₹ 1,178
Stock P/E 17.3 ROCE 11.6 % ROE 12.0 % Debt to equity 0.28
Promoter holding 38.0 % Quick ratio 0.79 Current ratio 1.22
Piotroski score 9.00 Profit Var 3Yrs -30.9 % Sales growth 3Years 17.5 %
Pledged percentage 0.00 % Return on assets 6.93 %
this stock from large cap with well known trusted brand . also in momentum with huge volume.
please read this chart and make some sense.
Note: I am not SEBI registered financial Adviser. I solely present my views on chart .I do not charge any kind of service. This is not buy sell recommendation.
If you like my ideas than like boost and follow me for more ideas.
Thanks and comment freely

TATA Chemicals taking support at TL for 3 Years.Tata Chemicals of course is a long term bet company and recently has seen some correction. It is to take in consideration that on weekly TF, this stock has taken many supports on the Trendline mentioned in the chart since Jan 2021.
Seeing the boom in chemical sector currently, the stock hasn't performed as much as it should have. Expecting a good up move in the stock subject to supported by market and relevant indices.
CMP: 963
T1 : 1016
T2 : 1150
T3 : ATH
Stay informed and stay invested.
Kindly note that I am not a SEBI registered analyst. Perform your own analysis before taking any trade.

TATACHEMTATA CHEMICALS is breaking the weekly zone. Keep an eye on this for a stunning move in coming sessions. 20-30% is expected.
NOTE: I'm not a SEBI REG. Study before you invest.

TataChemTatachem is forming Distribution Schematic #2 Wyckoff
presently it is in Phase C
Phase D may give the first bearish action
