COFFEE - Wide Awake Hi all,
I am here again to give you something valuable:)
Observed the coffee future chart which is trading in the multi year resistance zone. This is the fourth time now that it is into that zone and owing to increase in the prices of other commodities it may break the resistance this time.
Stocks of FMCG segment will benefit from it. One stock which I see benefitting from it is TATA COFFEE. I will post the chart of it soon, till then do your own due diligence.
Happy Learning!
TATACOFFEE
Tata Coffee Tata Coffee
Breakout on weekly chart
Weekly RSI heading towards 70 zone
Daily chart is also looking good
Daily RSI 64
above 220 can touch 240++
SL 205 closing basis
TATA COFFEE - Channel Breakout. NSE:TATACOFFEE
TATA Coffee has given a breakout. Buy above 220 for target of 240.
TATA COFFEE - DARK HORSEthe chart here is on a downtrend but currently holding well at support. breaking either side of the horizontal lines the move will trigger short or long side as guided in the charts. use a strict stoploss for this stock and respect your discipline
TATACOFFEE Very Bullish Trend AlertTATACOFFEE Very Bullish Trend Alert
1. long time covering zone breakout
2 buy entry right time target level resistance 1 and 2
Breakout in Tata Coffee...Chart is self explanatory. Entry, Targets and Stop Loss are mentioned on the chart.
Disclaimer: This is for demonstration and educational purpose only.
TATA COFFEE LOOKING BULLISHStock Of The month: Buy Tata Coffee: SL 203 Tgt 215, 220, 235, Global shortage of coffee, but in India bumper crop to benefit, Coffee prices up by 35% in one month. 1) Cup with handle breakout 2) Bullish market structure 3) RSI, ADX, MACD R Bullish...
TATACOFFEE Flag and Pennet, Possible Breakout ViewTATACOFFEE Flag and Pennet, wait for breakout. The breakout will lead to All Time High.
#TATACOFFEE .. 10-20% move is coming .. 2.43R Check the chart...strong price consolidation and hidden bullish divergence... RR on the trade is 2.43
TATACOFFEE potential breakoutTATACOFFEE has been consolidating in this range for a few sessions now.
we can expect a breakout out of 195 if its accompanied by good volumes.
1HR chart also shows the same.
kindly perform your own analysis and enter trade above 195.
Target 1 (32%) achieved in Tata Coffee. Target 2 is ON...This is follow-up on Tata Coffee. Can check link to related ideas.
Target 1 achieved. More than 32%. Target 2 is ON.
Chart is self explanatory. Entry, Targets and Trailing Stop Loss are mentioned on the chart.
Disclaimer: This is for demonstration and educational purpose only. This is not buying or selling recommendations. I am not SEBI registered. Please consult your financial advisor before taking any trade.
TATA STEELTata Steel Double Top Pattern the Amazing Moment. if Tata Steel
break out this level and market stand in 1260 upside then we will be got 1300+ level few months
Tata Steel is poised for the next phase of growth even as it continues to stay the course on deleveraging.
Over the next five years, the average India capital expenditure is estimated at Rs 10,000-12,000 Crore per annum and that excludes potential acquisitions. As against a $1 billion annual debt reduction target, the company is likely to reduce gross debt by over $2 billion in FY22.
Koushik Chatterjee, executive director and chief financial officer, Tata Steel, told investors on Tuesday that the company would continue to deleverage and make its balance sheet stronger in order to position for the next phase of growth.
“This year, I can certainly say that it will be much more than our announced policy of $1 billion,” he said during the investor meet.
The investor presentation mentioned that among FY22 deleveraging priorities, over $2 billion gross debt reduction and Prioritising offshore debt pre-payments.
In the June quarter also, the company had made material repayments in the Singapore and European balance-sheets, said Chatterjee.
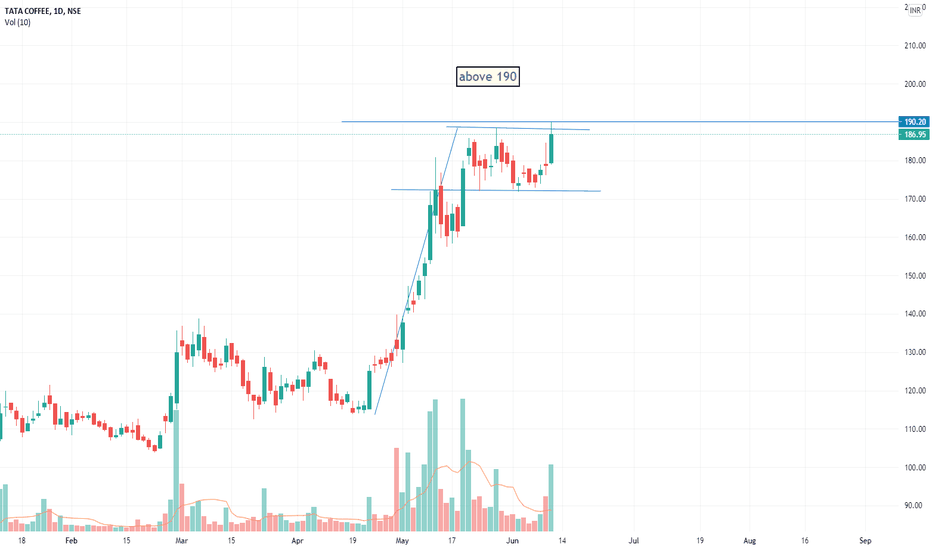
Triangle PATTERN#Tatacoffee
Triangle PATTERN BREAKOUT signal on daily chart Time frame
Happy LEARNING
watch for resistance breakoutbuy above 190
for swing sl 180 for positional sl 170
For Intraday
For stoploss use 5 minute chart and see nearest support.
for target use 5 min chart and fibonacci pivots as i don't keep predefined target.
try to book partially and trail.
NOTE: For Gapup or bo before 9:20
If gapup is more than 1% from bo level than avoid completely.
if less than 1% or gives bo before 9:20 than wait for
first 5 minute candle and entry above 5 minute candle
and revised SL below candle Low.
Tata Coffee Rounding Bottom PatternHey everyone! I'm a neophyte in the world of Stock Market. This is my first post. If you think this analysis is absurd or has some mistakes please blow me up in the comments. What do you think is the target price here?
Suggestions are most welcome!


