BTCUSD 1D Time frame📈 Price Action
Previous Close: $113,897.00
Day’s Range: $112,204.00 – $114,451.00
Current Price: $113,897.00
🔧 Technical Indicators
Relative Strength Index (14): 55.39 — Indicates neutral momentum.
MACD: Positive — Suggests upward trend.
Moving Averages:
5-day MA: $112,545.50
20-day MA: $112,519.63
50-day MA: $114,828.28
100-day MA: $109,519.30
200-day MA: $101,144.13
Stochastic Oscillator (14): 67.91% — Indicates bullish momentum.
Average True Range (ATR): $3,177.03 — Suggests moderate volatility.
Directional Movement Index (ADX): 10.23 — Indicates a weak trend.
📊 Support & Resistance Levels
Immediate Support: $112,000
Immediate Resistance: $115,000
🧠 Trend Analysis
Trend: Neutral to bullish
Momentum: Positive
Volatility: Moderate
Summary: Bitcoin is currently trading near $113,897, showing a neutral to bullish trend with positive momentum. The 50-day moving average is above the current price, indicating potential upward movement. Traders should monitor the support level at $112,000 and resistance at $115,000 for potential breakout opportunities.
Tatagroup

KOTAKBANK 1D Time frame📊 Price Action
Previous Close: ₹1,973.30
Day’s Range: ₹1,963.30 – ₹1,985.00
Volume: 1,694,935 shares
VWAP: ₹1,975.06
52-Week Range: ₹1,679.05 – ₹2,301.90
🔧 Technical Indicators
RSI (14): 55.59 — Indicates neutral to bullish momentum.
MACD: 5.67 — Suggests a positive trend.
ADX (14): 37.42 — Confirms a strong trend.
Stochastic RSI: 18.53 — Indicates oversold conditions.
CCI (14): 50.23 — Neutral, with potential for upward movement.
Ultimate Oscillator: 58.25 — Signals bullish momentum.
Rate of Change (ROC): 0.72 — Positive, indicating upward price movement.
Williams %R: -54.58 — Neutral, neither overbought nor oversold.
Bull/Bear Power (13): 13.35 — Indicates buying pressure.
📈 Moving Averages
MA5: ₹1,976.44 — Sell signal.
MA10: ₹1,973.57 — Buy signal.
MA20: ₹1,968.21 — Buy signal.
MA50: ₹1,956.95 — Buy signal.
MA100: ₹1,964.72 — Buy signal.
MA200: ₹1,979.20 — Sell signal.
Summary: Out of 12 moving averages, 8 indicate a buy signal, and 4 indicate a sell signal, suggesting a generally bullish trend.
📌 Support & Resistance Levels
Immediate Support: ₹1,963
Immediate Resistance: ₹1,985
🧠 Trend Analysis
Trend: Bullish
Momentum: Positive
Volatility: Moderate
Conclusion: Kotak Mahindra Bank's stock is exhibiting a bullish trend with positive momentum and moderate volatility. The technical indicators suggest potential for upward movement, with key support at ₹1,963 and resistance at ₹1,985. Traders may consider these levels for potential entry or exit points.

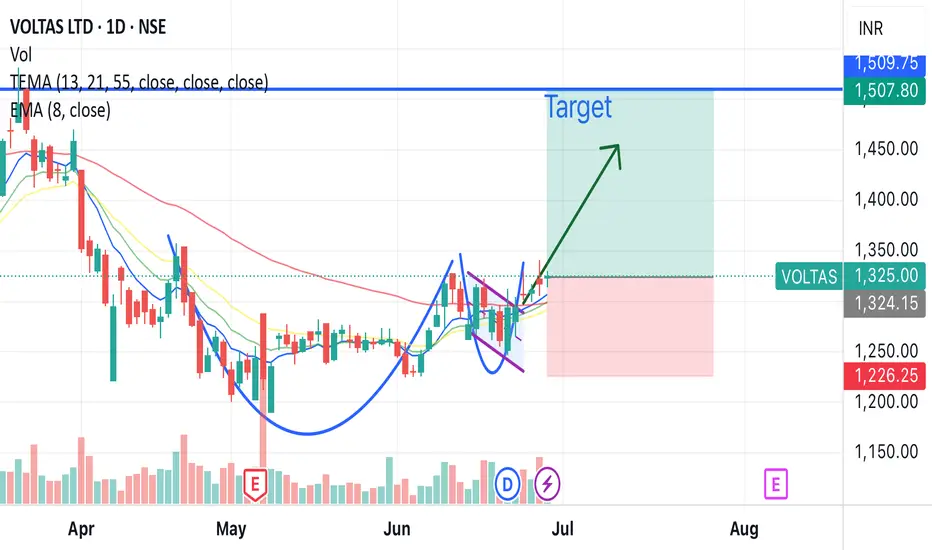
Voltas breakout soon cup and handle patternVoltas will soon be flying, cup and handle breakout pattern, pattern is very prominent, high chances of breakout in short term 15% profit.
Also reaching golden crossover
Buying range - 1310 - 1330
Target - 1507 (15%)
Hold duration - 1-2 month
Voltas belongs to Tata groups and have good fundamentals.
TAJGVK: POLE & FLAGTAJGVK in weekly time frame is showing a POLE and FLAG pattern. Expecting some good move in this stock. Targets are marked on the trendlines. Follow as per your risk/greed.
NOTE: I'm not a SEBI REG. Study before investing.

All Time High + Volume Huge SpikesKey Highlights : 🔰
🔷 Script Name : Rallis India
🔷 Script Symbol : NSE:RALLIS
🔶 Resistance Level : Need Weekly Close Above Resistance Line🔥
🔶 Volume : Huge Volume Spikes 💚
🔷 Tata Group Stock 🔥
🔷 Great Stock For Long Run 🔥
👉🏻 Rule No.1 : When You Get 100% , Exit 50% !!
👉🏻 Rule No.2 : Always Remember Rule No. #1
👉🏻 Rule No.3 : Always Do Basket Of 9 - 10 Stocks, Never Buy Solo Stock. 😊
Disclaimer : This is NOT Investment Advice. This Post is Meant for Learning Purposes Only. Invest Your Capital at Your Own Risk.
Happy Learning. Cheers!!
Shyorawat Arun Singh ❤️
(@Shyorawat_ArunSingh)
Founder : Shyorawat Investing School

TATA POWER FOR 465+Tata Power Company Limited is an Indian electric utility and electricity generation company based in Mumbai, India. It proudly stands as part of the illustrious Tata Group. Tata Power boasts an impressive installed electricity generation capacity of 14,707 megawatts (MW).
In past few weeks stock has consolidated and now I m expecting a bullish rally in this stock. NSE:TATAPOWER
CMP : 446
SL : 424
T1: 464
T2 : 480 :
T3 : 495
Note : This is not stock recommendation this is only for educational purpose.

Accumulation Phase Breakout seen in India's Top Automobile StockHello Everyone, I hope you all will be doing good. I have brought a stock which has given a breakout of accumuluation phase with huge volume spike. Stock name is Tata Motors and it is a leading global automobile manufacturer. Part of the illustrious multi-national conglomerate, the Tata group, it offers a wide and diverse portfolio of cars, sports utility vehicles, trucks, buses and defence vehicles to the world.
It has operations in India, the UK, South Korea, South Africa, China, Brazil, Austria and Slovakia through a strong global network of subsidiaries, associate companies and Joint Ventures (JVs), including Jaguar Land Rover in the UK and Tata Daewoo in South Korea.
Market Cap
₹ 4,00,627 Cr.
Current Price
₹ 1,091
High / Low
₹ 1,094 / 593
Stock P/E
12.4
Book Value
₹ 255
Dividend Yield
0.27 %
ROCE
20.1 %
ROE
49.4 %
Face Value
₹ 2.00
Industry PE
27.3
Debt
₹ 1,07,262 Cr.
EPS
₹ 94.5
Promoter holding
46.4 %
Intrinsic Value
₹ 644
Pledged percentage
0.00 %
EVEBITDA
6.98
Change in Prom Hold
0.00 %
Profit Var 5Yrs
93.1 %
Sales growth 5Years
7.72 %
Return over 5years
49.3 %
Debt to equity
1.26
Net profit
₹ 31,807 Cr.
ROE 5Yr
5.84 %
Profit growth
1,266 %
Earnings yield
8.42 %
Disclaimer:- Please always do your own analysis or consult with your financial advisor before taking any kind of trades.
Dear traders, If you like my work then do not forget to hit like and follow me, and guy's let me know what do you think about this idea in comment box, i would be love to reply all of you guy's.
Thankyou.

#BUYTCSToo much Ups and dows, Too much Consolidations Done.
Stock made stoploss hunting at bottom, now trend is established.
Buy for targets mentioned in chart

Long Setup in Tata Steel LongA bullish flag & pole Chart Pattern Breakout completed on the Daily Time frame of NSE:TATASTLLP
Price Action nees to be supported by volume.
The stock is currently in uptrend making higher highs and higher lows.
One can add this stock into their stocks to buy list and initiate the long trade as per the levels mentioned on the chart
Stop loss will be on a weekly closing basis.
Trend Analysis :- UP Trend
Chart Pattern :- Bullish flag & pole Chart Pattern
Technical Indicator :- Positive MACD Crossover
TLong

Tata Communictions Falg BreakoutA Bullish flag and Pole breakout has been confirmed with very huge volume on the daily chart of Tata Communications.
Daily & Weekly RSI both are in bullish zone.
One can crete fresh position in Tata Communcations at 1610 or below with a stop loss of Rs. 1510 for a target of Rs, 1910.
The risk to reward ration is 1:3
Exit the position if the stop loss triggered on DCB.
DO YOU WANT ALL MY RESEARCH FOR FREE THEN DON'T FORGET TO FOLLOW ME.
I AM EAGERLY WAITING FOR YOU COMMENTS ON THE STUDY...
Disclaimer: Content shared is for information and education purposes only and should not be treated as investment or trading advice. Please do your own analysis or take independent professional financial advice before making any investments based on your own personal circumstances. Investment in securities are subject to market risks, please carry out your due diligence before investing. And last but not the least, past performance is not indicative of future returns.

TataconsumerHere, is the chart of Tataconsumer which was in the range since so long...
What do you expect?

#Techm #Buy 1 Long year #Accumulation#BuyTechm #Techm
1 year of Consolidation was broken, #trend established, #retestdone. Stock will move higher.
#targets on chart.

Tata Communication - Breakout of consolidation📈 Key Details 📈
Tata Communication is a prominent member of the Tata group, a leading business conglomerate in India with a major presence in telecommunications.
The stock is currently trading at its all-time high levels, indicating strong bullish momentum.
After a consolidation phase lasting over 40 days, the stock has broken out.
📈 Technical Analysis 📈
Tata Communication's chart reveals an exciting trading opportunity. The stock has recently experienced a bullish breakout on the 75-minute timeframe, accompanied by significant trading volume. The breakout candle opened with a gap up and formed a Marubozu, indicating strong buying pressure throughout the session.
📊 Trade Plan 📊
To capitalize on this breakout, consider the following trade plan:
Enter a long trade above the high of the breakout candle.
Set a Stop Loss (SL) below the marked supply area on the chart to manage risk effectively.
Consider trailing your Stop Loss to protect potential profits as the trade progresses.
If you find this analysis helpful, don't forget to like and share your observations in the comments section. Your support, likes, follows, and feedback keep me motivated to write consistently.
📢🚀 Follow me on TradingView for more insightful articles and trade setups: in.tradingview.com
💪💹 Happy trading, and remember: every trade is an opportunity for growth! 💹💪
Please note that this analysis is for educational purposes only, and I am not a SEBI registered analyst.

Tanla Platforms Flag BreakoutA Bullish flag and Pole breakout has been confirmed with very huge volume on the daily chart of NSE:TANLA .
Daily & Weekly RSI both are in bullish zone.
One can crete fresh position in NSE:TANLA at 1090 or below with a stop loss of Rs. 1028 for 1st target of Rs, 1172, 2nd Target of 1244 and 3rd Target of 1316
The risk to reward ration is 1:3
Exit the position if the stop loss triggered on DCB.
DO YOU WANT ALL MY RESEARCH FOR FREE THEN DON'T FORGET TO FOLLOW ME.
I AM EAGERLY WAITING FOR YOU COMMENTS ON THE STUDY...
Disclaimer: Content shared is for information and education purposes only and should not be treated as investment or trading advice. Please do your own analysis or take independent professional financial advice before making any investments based on your own personal circumstances. Investment in securities are subject to market risks, please carry out your due diligence before investing. And last but not the least, past performance is not indicative of future returns.

TATA CHEMICALS trade setupTATA CHemicals is consolidating heavily since DEC2022 and can move in a single direction any day
* BUY above 1000-1020 levels for a target of 1140 levels
*Stock is forming a structure of rounding top hence SELL below 950 levels , target of 870 levels

TATA STEELTATA STEEL looking good for a short term swing , a good inverted head and shoulders pattern is formed and stock has broken out of the resistance of 108 levels , if sustains above , stock can move towards targets of 113/115 , with SL of 107

Supply Zone Breakout in Tata Motors (D)Tata Motors has finally broken the previous supply zone of 460-475. With stock approaching all-time high levels looks very bullish. We can buy at the current price with SL@ 425. Possible targets are mentioned on the chart.
Tata motors is one of the fundamentally strong companies which is a leading global automobile manufacturer. It is a formidable player in the CV segment in India and offers a broad portfolio of automotive products including trucks, buses, coaches and defense vehicles. It is the leading player in the CV segment, with a market share of 43.0% during FY20.
This is not a trade recommendation, Do your own analysis before investing.
Do share your views on this.

INDHOTEL following Darvas Box TheoryA TATA Group Company, INDIAN HOTEL is moving in Darvas Box. Swing traders keep this on radar because it looks like this stock is ready to break upper range of current Darvas Box and enter into a new one. Multifold increase in volume is clearly seen on the chart since last September. If it breaks upper range then it will be considered as volume accumulation. Add this stock in your watchlist without fail.

Tata Power : DWM Analysis.......No Buy / No sale :::: ONLY VIEW ::::
Its pure knowledge sharing Idea based on my study of Indicators which i follows...
Tata Power :
Daily : Near 50 DMA
Weekly : 193 good support on weekly closing basis
Monthly : Inverted Hammer
Currently Stock have strong support of 213 on daily @ which it take support twice last week n reversed
To me Stock is in Range of 213-253........
Needs to break either side....... to get momentum.......

TATA CHEMICAL AnalysisStock made a base at 880 price. Today's momentum is showing good bullish sentiment suggesting further upside potential. Support is at 880 & stock can see resistance at 980. Setup will be invalidated if crosses below 870.

Tata Consumer Seems Bullish..Tata Consumer Looking Bullish....
As we can see it is respecting its trend line and taking Support again again .....
Now wait For Breakout Above 884 and closin g ...
As We can see it is taking support from its 50 EMA and respecting trendline.......
If in upcoming days any Momentum Comes in FMCG secto r then ....Look for Trade in it....
Possitional Trade
Buy Above - 885
Target - 900/910/920
SL - Own SL

LONG TERM IDEA OF THE MONTH // Sunday April 4th 2021 // ARTSON LONG TERM IDEA OF THE MONTH // Sunday April 4th 2021 // BSE:ARTSONEN
// This is a Long Term Investment Idea and not a swing trade call nor an intra-day trade. Please do not expect the stock to go up on the same day of posting or within a few weeks. Please follow the notes along with the posting before, during and after entering the trade //
CMP / LTP: 40.4
TARGET: 60+ (50% Around)
STOP LOSS: 28 (30% Max)
Standard Notes:
- Please follow the Stop Loss strictly and preferably on a daily closing basis.
- Recommended Profit Booking / Exit is on 50% & If you still want to hold the stock, trail the SL once this target is achieved.
- Duration:1-2 Years suggested time frame is an indicative period.
- If SL / Target are not triggered and you still wish to hold the trade, this can be done as long as SL is followed or trailed.
Disclosure: I may or may not have a position in this trade.
Disclaimer: All the recommendations are subject to market conditions. Please trade at your own risks.
ALong

