Intraday Institution Trading in Nifty and Banknifty BANKNIFTY Institutional Behavior
BANKNIFTY moves faster due to lower liquidity + banking stock hedging.
Institutions:
Accumulate ATM options early
Trigger stop hunts near high OI strikes
Expand range post 11:30 AM when gamma pressure builds
High-Probability Institutional Intraday Trades
VWAP Reclaim + OI Unwinding → Trend day setup
High OI Rejection + IV Drop → Mean reversion
Break of Call-Writer Zone with Volume → Momentum expansion
Institutional Rulebook
Trade levels, not emotions
Follow option writers, not candles
Price moves to hurt the maximum number of option holders
Tatamotors

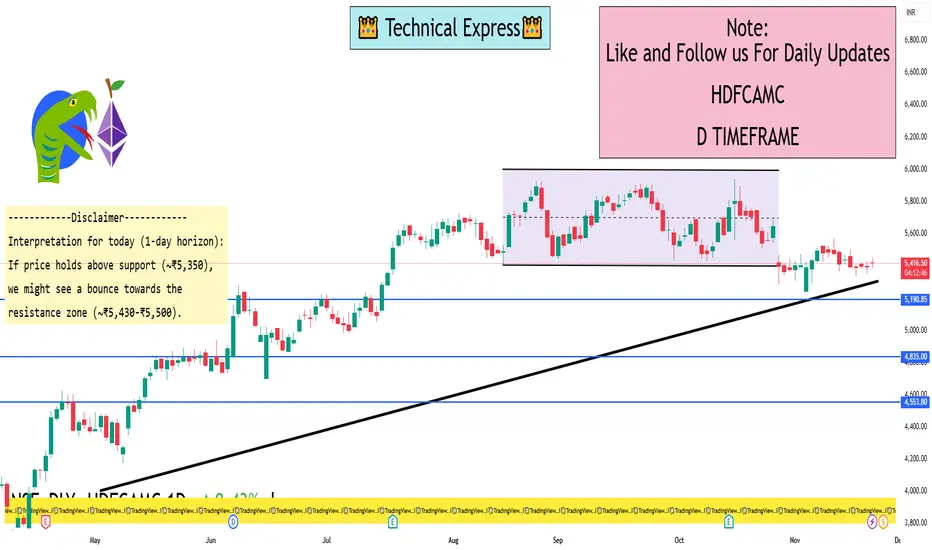
HDFCAMC 1 Day View Current price (approx): ₹5,444.50 as of 10:48 AM IST on 24 Nov 2025.
Day’s range: Low ~ ₹5,385.00, High ~ ₹5,447.00.
Recent support zone: ~ ₹5,354-₹5,316 (based on 5Paisa pivot levels)
Immediate resistance zone: ~ ₹5,428.83-₹5,502.83 (from same pivot table)
Interpretation for today (1-day horizon):
If price holds above support (~₹5,350), we might see a bounce towards the resistance zone (~₹5,430-₹5,500).
If price breaks below support decisively, downside risk opens up toward ~₹5,280 or lower.
Conversely, a breakout above the resistance zone could open further upside beyond ~₹5,500.
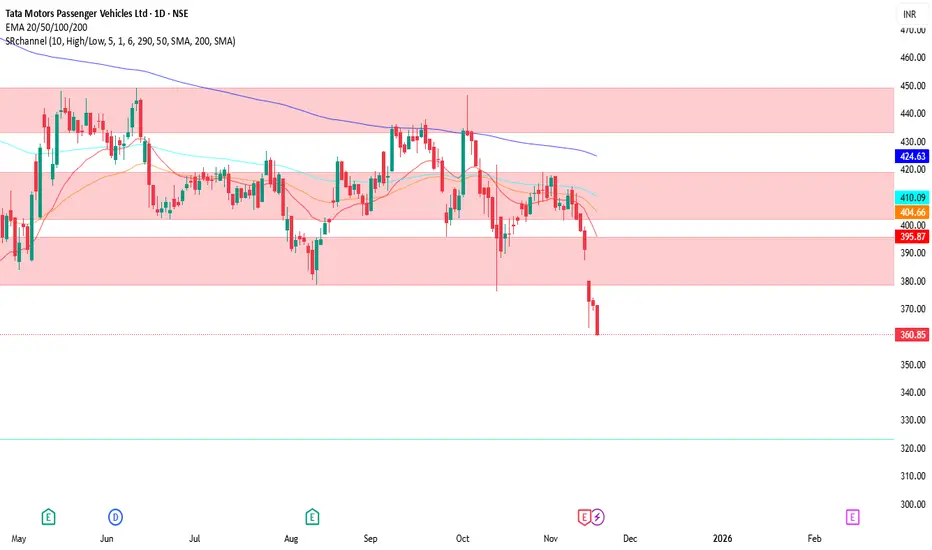
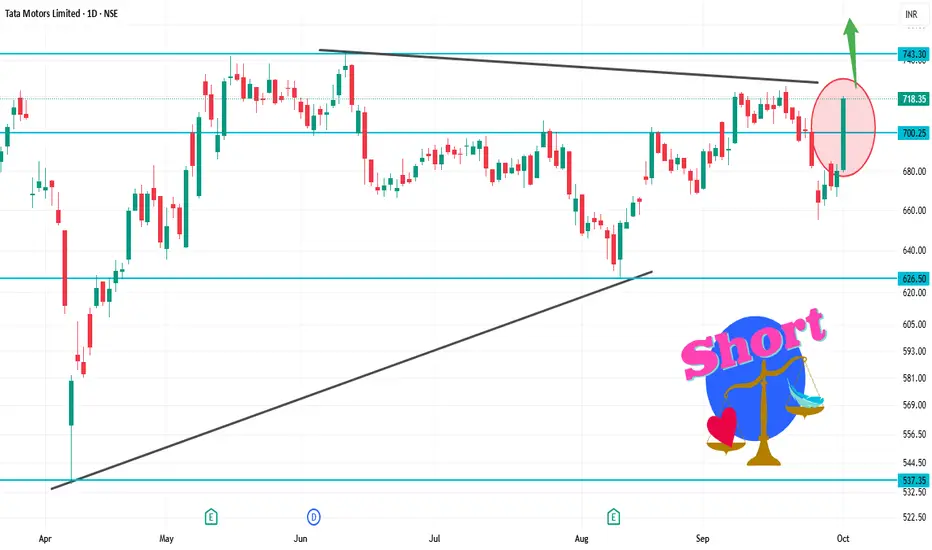
TMPV Short Setup: Expected Decline from 364 to 310 LevelThis trading idea revolves around Tata Motors Passenger Vehicles (TMPV), currently trading around 364 INR. Based on technical analysis and market sentiment, the stock is anticipated to decline towards the 310 INR level.
Analysis Walkthrough:
Current Price Action: The stock is trading near 364 INR, showing weakness with recent downward momentum. The price is below significant moving averages, suggesting bearish pressure.
Resistance and Support: Price action indicates strong resistance around current levels, with previous lows and support zones around 310 INR serving as a potential target area.
Indicators & Confirmation: Momentum indicators (such as RSI and MACD) likely signal bearish divergence or downward trend continuation, supporting the short bias.
Volume Analysis: Volume trends may confirm selling pressure, reinforcing the probability of a downside move.
Trade Setup:
Entry: Initiate a short position near the current level (around 364 INR).
Target: Set a profit target near the key support at 310 INR, which aligns with historical price reactions and expected market behavior.
Stop Loss: Place a stop loss above recent swing highs, ideally around 375-380 INR, to protect against unexpected bullish reversals.
Part 7 Trading Master Class Basics of Options in India
An option is a derivative contract that gives the holder the right but not the obligation to buy or sell an underlying asset (like Nifty, Bank Nifty, or a stock) at a predetermined price (called the strike price) before or on a specified date (expiry).
Call Option (CE): Gives the right to buy.
Put Option (PE): Gives the right to sell.
Traders use options for:
Hedging (protecting portfolio losses)
Speculation (betting on price movements)
Income generation (using premium decay)
In India, options are traded on exchanges like NSE and BSE, primarily on indices (Nifty, Bank Nifty, FinNifty) and individual stocks.

Real Knowledge of MarketCore Foundational Knowledge
Derivatives Basics: Options are derivative contracts, meaning their value is derived from an underlying asset (stocks, indices, commodities, etc.).
Key Terminology: A trader must be fluent in terms like call options (right to buy), put options (right to sell), strike price, premium, expiration date, intrinsic value, and time value.
Rights vs. Obligations: Understanding that option buyers have the right, but not the obligation, to exercise, while option sellers (writers) have the obligation if exercised, is fundamental to risk assessment.
Leverage: Options offer significant leverage, meaning a small amount of capital can control a large position in the underlying asset, which amplifies both potential profits and losses.

Full Replay Breakdown! From Planning to Execution of a TradeWatch as I use the Bar Replay feature to walk you through the planning, execution, and post-trade phases of a real swing trade. Don’t miss these actionable insights, mindsets, and mistakes from start to finish for smarter trading decisions!
Chart used is older than 3 months for explanation

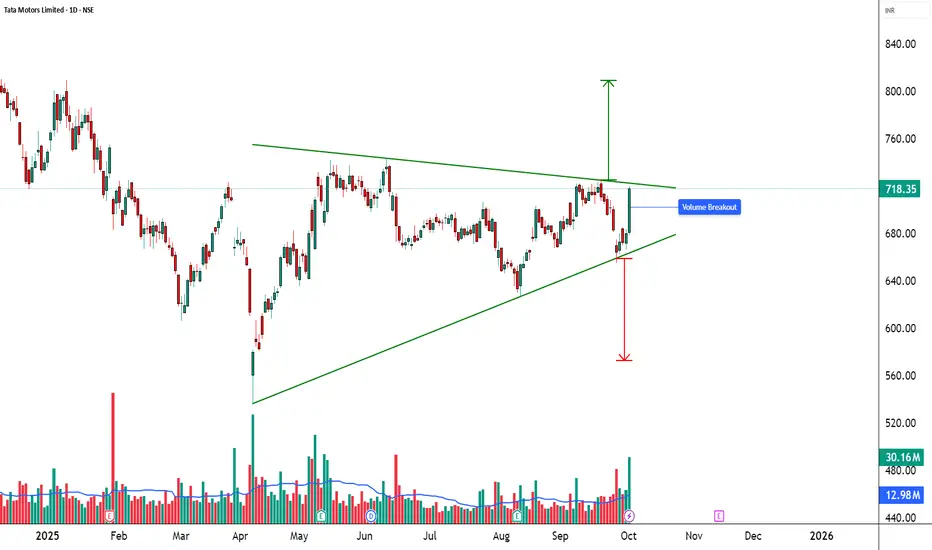
TATAMOTORS - Symmetrical Triangle Breakout Watch________________________________________
🚀 Tata Motors Ltd (NSE: TATAMOTORS) | Symmetrical Triangle Breakout Watch
________________________________________
🏢 Company Overview
Tata Motors Ltd is one of India’s leading automobile manufacturers, producing cars, SUVs, electric vehicles, and commercial vehicles. After an extended consolidation phase, the stock is trading inside a symmetrical triangle formation, indicating a possible strong directional move ahead.
________________________________________
📊 Current Market Snapshot
CMP: ₹718.35
Sector: Automobiles & Commercial Vehicles
Pattern Observed: 🔺 Symmetrical Triangle
Candlestick Signal: Bullish Marubozu + Strong Momentum Candle
Strength Rating: ⭐⭐⭐⭐ (Bullish Breakout Watch)
________________________________________
📈 Price Action & Chart Pattern
The stock has been consolidating within a symmetrical triangle, where buyers are defending higher lows while sellers cap gains at the resistance zone. The latest session witnessed a powerful bullish candle with extremely high volume, suggesting institutional participation.
Support Trendline: ₹665 – ₹670
Resistance Trendline: ₹720 – ₹725
Breakout Zone: Above ₹725 with strong volume
Breakdown Zone: Below ₹665 may invite fresh selling pressure
🔍 Why Important? Symmetrical triangles act as springboards for big moves once a breakout/breakdown occurs with confirmation.
________________________________________
🔎 Technical Indicators
RSI (14): 59.75 → Turning bullish with upside room.
EMA Support: Price reclaimed EMA levels, signaling renewed strength.
Volume: Recent upmove supported by 3x average volumes, a strong confirmation factor.
________________________________________
📍 Key Levels to Watch
Immediate Support: ₹665 – ₹670
Immediate Resistance: ₹720 – ₹725
Upside possible (if breakout): ₹770 – ₹800
Downside possible (if breakdown): ₹620 – ₹600
________________________________________
🔮 Bullish & Bearish Scenarios
✅ Bullish Case: A strong close above ₹725 with volume can trigger a rally towards ₹770–₹800.
⚠️ Bearish Case: Rejection at resistance and breakdown below ₹665 may drag the stock back to ₹620.
________________________________________
📝 STWP Trade Analysis
Entry: ₹718.35
Stop-loss: ₹665.75 (just below triangle support)
Risk: 52.60 points
Strength: ⚡ Strong Bullish Momentum + Extremely High Volume
Demand Zone: ₹666.65 – ₹683 | SL: 665.75
📌 Note: Strong momentum setup with excellent volume confirmation. Traders must stay disciplined with SL.
________________________________________
🎯 Final Outlook
Tata Motors is at a decisive breakout point. If the stock sustains above ₹725 with strong volumes, it could fuel a sharp rally towards ₹800. Failure to hold this zone may lead to renewed consolidation or a pullback towards ₹665. Patience and strict discipline are essential here.
________________________________________
💡 Learning Note: Symmetrical triangles with heavy-volume breakouts often lead to trend continuation setups. Combining price action, candlestick strength, and volume surge improves the accuracy of trade setups.
________________________________________
⚠️ Disclosure & Disclaimer – Please Read Carefully
The information shared here is meant purely for learning and awareness. It is not a buy or sell recommendation and should not be taken as investment advice. I am not a SEBI-registered investment adviser, and all views expressed are based on personal study, chart patterns, and publicly available market data.
Trading—whether in stocks or options—carries risk. Markets can move unexpectedly, and losses can sometimes exceed the money you have invested. Past performance or past setups do not guarantee future results.
If you are a beginner, treat this as a guide to understand how the market works and practice on paper trades before risking real money. If you are experienced, always assess your own risk, position sizing, and strategy suitability before entering trades.
Consult a SEBI-registered financial adviser before making any real trading decision. By engaging with this content, you acknowledge full responsibility for your trades and investments.
💬 Found this useful?
🔼 Give this post a Boost to help more traders discover clean, structured learning.
✍️ Drop your thoughts, questions, or setups in the comments — let’s grow together!
🔁 Share with fellow traders and beginners to spread awareness.
👉 “If you liked this breakdown, follow for more clean, structured setups with discipline at the core.”
🚀 Stay Calm. Stay Clean. Trade With Patience.
Trade Smart | Learn Zones | Be Self-Reliant 📊
________________________________________
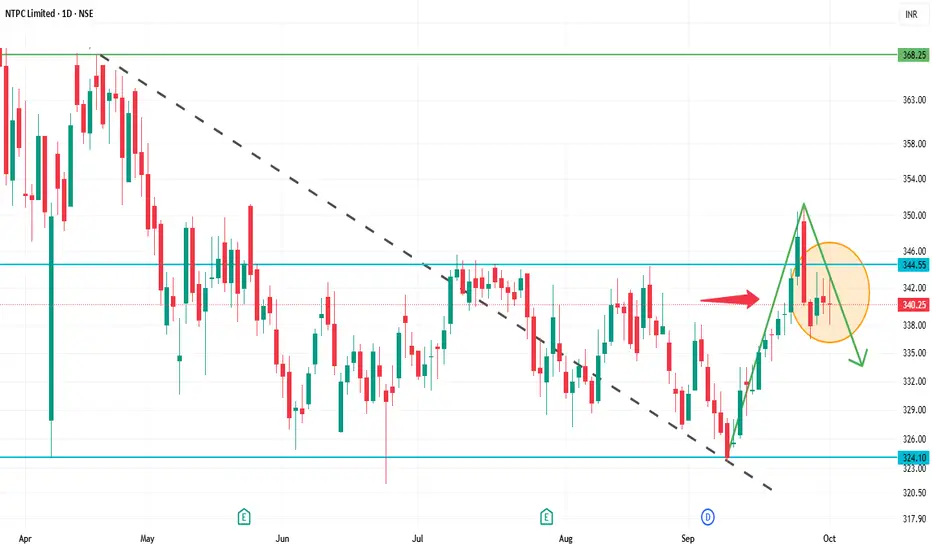
NTPC 1D Time frameCurrent Snapshot
Current Price: ₹340.25
52-Week High: ₹447.75
52-Week Low: ₹292.80
Strategy & Outlook
Bearish Bias: The stock is in a short-term downtrend with negative momentum indicators.
Selling Opportunity: Consider selling near resistance zones (₹343–₹345) with a target towards ₹335–₹340.
Risk Management: Place stop-loss orders above the resistance levels to manage potential upside risks.
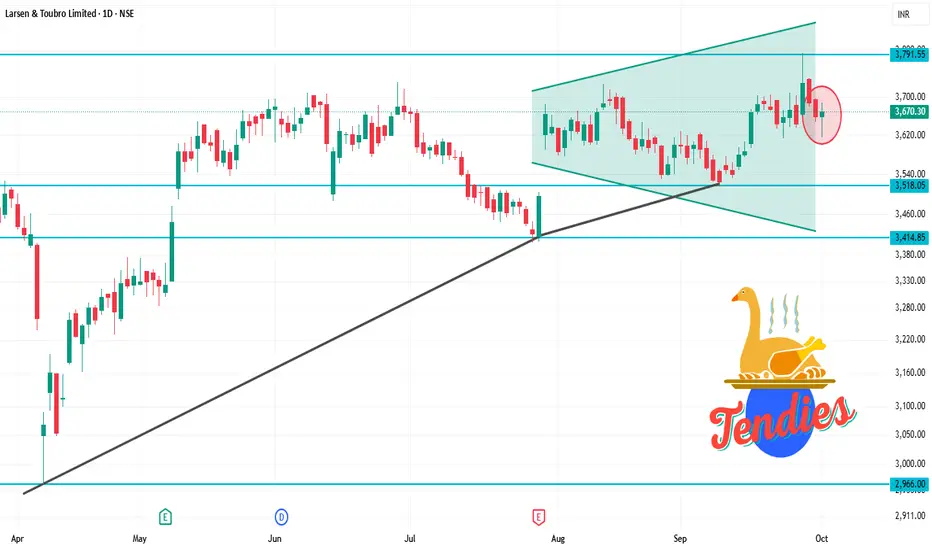
LT 1D Time frameCurrent Snapshot
Current Price: ₹3,670.30
52-Week High: ₹3,963.50
52-Week Low: ₹2,965.30
Strategy & Outlook
Bullish Bias: The stock is in a short-term uptrend with positive momentum indicators.
Buying Opportunity: Consider entering near support zones (₹3,600–₹3,650) with a target towards ₹3,700–₹3,750.
Risk Management: Place stop-loss orders below the support levels to manage potential downside risks.
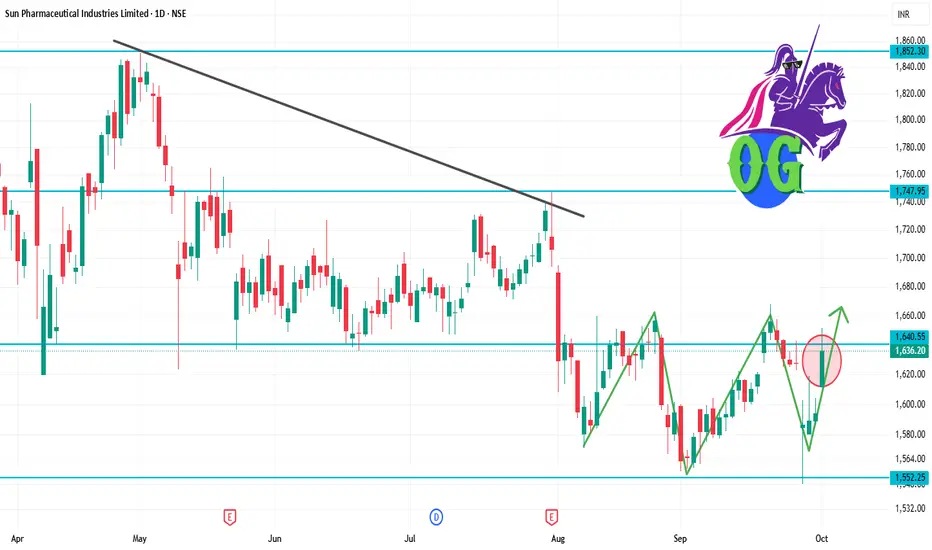
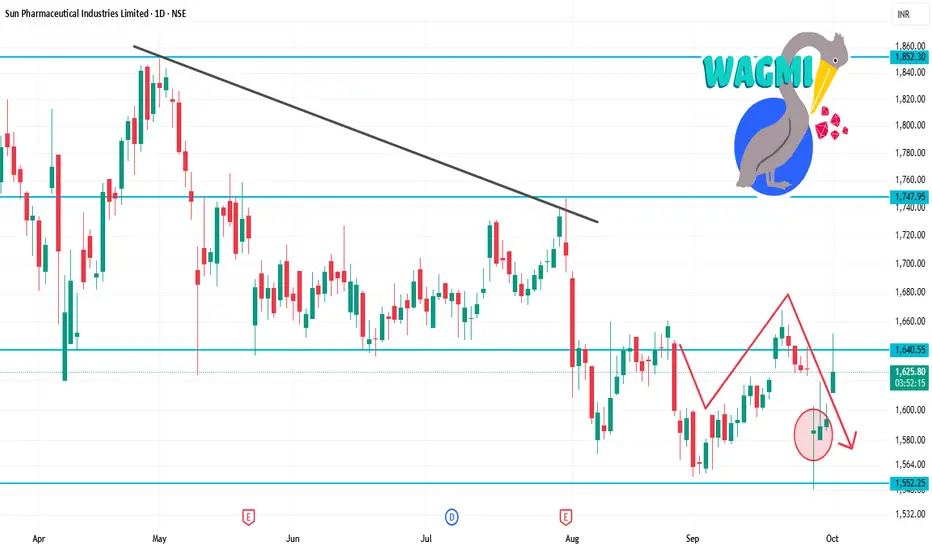
SUNPHARMA 1D Time frameCurrent Snapshot
Current Price: ₹1,636.20
52-Week High: ₹1,952.25
52-Week Low: ₹1,548.00
Strategy & Outlook
Bullish Bias: The stock is in a short-term uptrend with positive momentum indicators.
Buying Opportunity: Consider entering near support zones (₹1,600–₹1,610) with a target towards ₹1,650–₹1,670.
Risk Management: Place stop-loss orders below the support levels to manage potential downside risks.
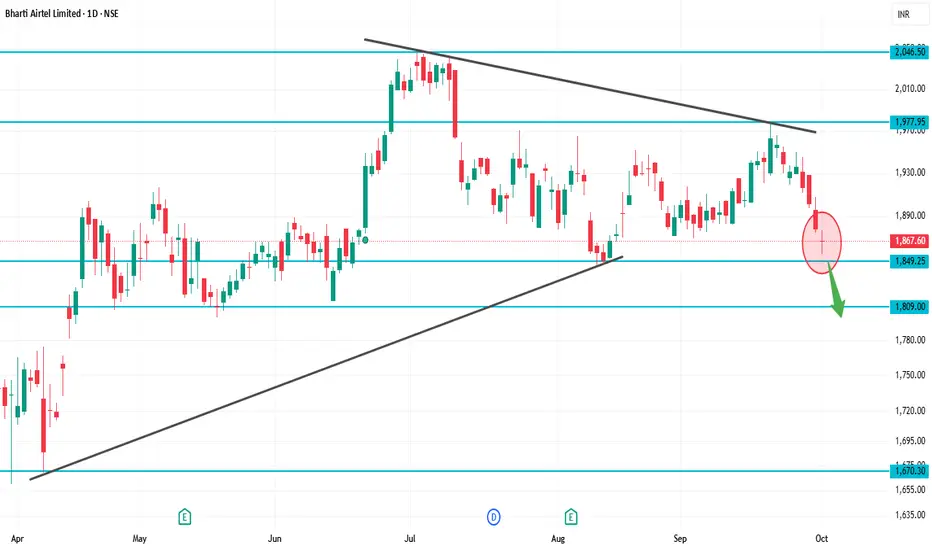
BHARTIARTL 1D Time frameCurrent Price: ~₹1,867
52-Week High: ~₹2,045
52-Week Low: ~₹1,511
Explanation
At ₹1,867, Airtel is just above immediate support (₹1,840–1,850).
If buyers hold this support, stock may bounce back toward ₹1,900+.
But if ₹1,840 breaks, then downside may open toward ₹1,800–1,750.
For bulls, a clean breakout above ₹1,920–2,000 is needed for fresh rally.
TATAMOTORS 1D Time frameCurrent Price: ₹718
Day Range (today): Around ₹705 – ₹725
52-Week Range: ₹535 – ~₹1,000
📏 Key Levels with ₹718 in focus
Immediate Resistance: ₹750 – ₹800 (needs breakout above this zone)
Current Level: ₹718 → price is right between support and resistance
Immediate Support: ₹700 – ₹705 (if broken, could fall further)
Next Support: ₹650 – ₹660 (major zone to watch)
🧠 What this means
Since price is just above support (₹705) and below resistance (₹750), it’s at a decision point.
If Tata Motors holds above ₹705–₹710, buyers may try to push toward ₹740–₹750.
If it fails and breaks below ₹705, price may revisit ₹660 levels.
BRITANNIA 1D Time frameCurrent Price: ~₹5,953.50
Day’s Range: ₹5,939.50 – ₹6,036.00
52-Week Range: ₹4,506.00 – ₹6,469.90
📏 Key Levels
Immediate Resistance: ~₹6,300
Next Resistance: ~₹6,470 (52-week high)
Immediate Support: ~₹5,800
Next Supports: ~₹5,600 and ₹5,300
🧠 Insights
If Britannia breaks above ₹6,300 with volume, it may push toward ₹6,470+ (new highs).
If it fails to break resistance, expect sideways movement or a pullback toward ₹5,800.
A break below ₹5,800 would signal weakness and can drag it down toward ₹5,600–₹5,300 levels.

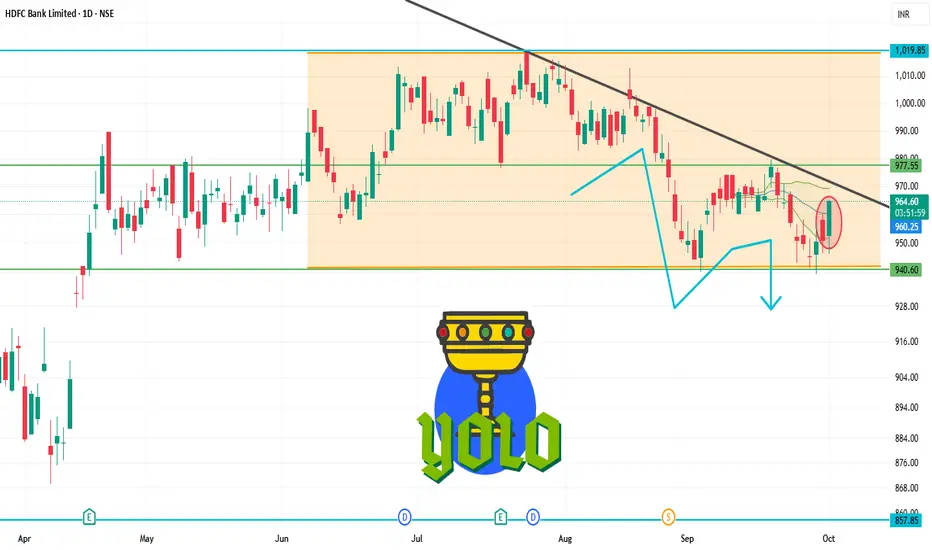
HDFCBANK 1D Time frameOpening Price: ₹950.30
Closing Price: ₹960.45
Day Range: ₹946.00 – ₹961.40
Previous Close: ₹950.30
🧠 Price Action Insights
The stock is trading below key moving averages, confirming the bearish trend.
No significant reversal pattern has formed, suggesting the downtrend may continue.
Watch for a breakout above ₹970.00 for a potential trend reversal.
SUNPHARMA 1D Time frameOpening Price: ₹1,611.90
Closing Price: ₹1,628.20
Day Range: ₹1,611.90 – ₹1,651.50
Previous Close: ₹1,594.30
📉 Trend Analysis
Short-Term Trend: Bearish — The stock is trading below key moving averages, confirming the bearish trend.
Medium-Term Trend: Neutral — The stock is in a consolidation phase, characterized by lower highs and lower lows.
Long-Term Trend: Neutral — No significant trend identified; the stock is trading within a range.
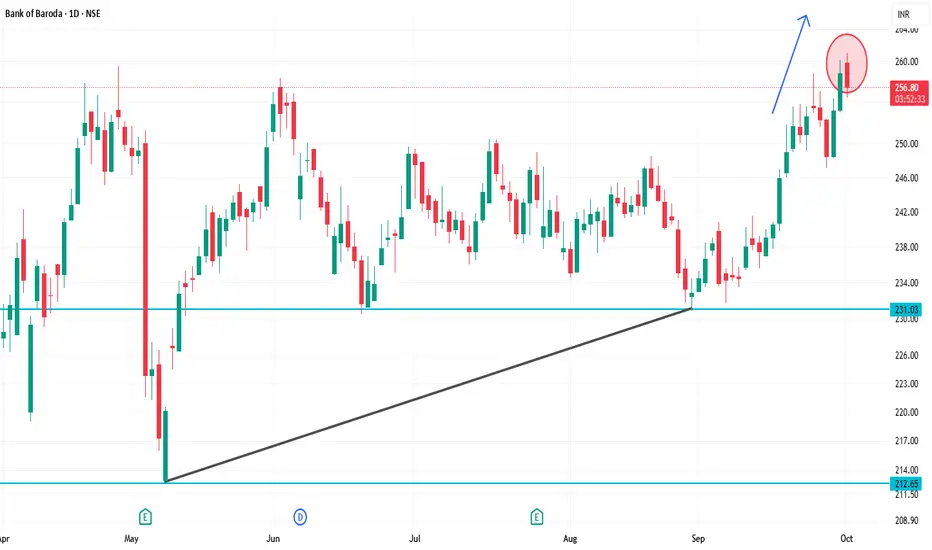
BANKBARODA 1D Time frameClosing Price: ₹257.60
Day Range: ₹253.70 – ₹260.00
Previous Close: ₹258.54
📉 Trend Analysis
Short-Term Trend: Bearish — The stock is trading below key moving averages, confirming the bearish trend.
Medium-Term Trend: Neutral — The stock is in a consolidation phase, characterized by lower highs and lower lows.
Long-Term Trend: Neutral — No significant trend identified; the stock is trading within a range.
🔮 Conclusion
Bank of Baroda is in a bearish trend with weak momentum.
Break below ₹250.00 could lead to further decline toward ₹245.00.
Break above ₹265.00 would indicate a potential trend reversal.
HEROMOTOCO 1D Time frame📌 Current Status
Closing Price: ₹5,410
Day Change: –35 points (–0.64%)
Day’s High: ₹5,470
Day’s Low: ₹5,380
52-Week Range: ₹4,800 – ₹6,050
🔍 Chart & Price Action Insights
Price is moving sideways, bouncing between support and resistance.
Bulls are defending ₹5,380
Sellers resist above ₹5,470
Watch for a break above ₹5,470 for potential upward momentum
Break below ₹5,380 may trigger a short-term decline toward ₹5,330

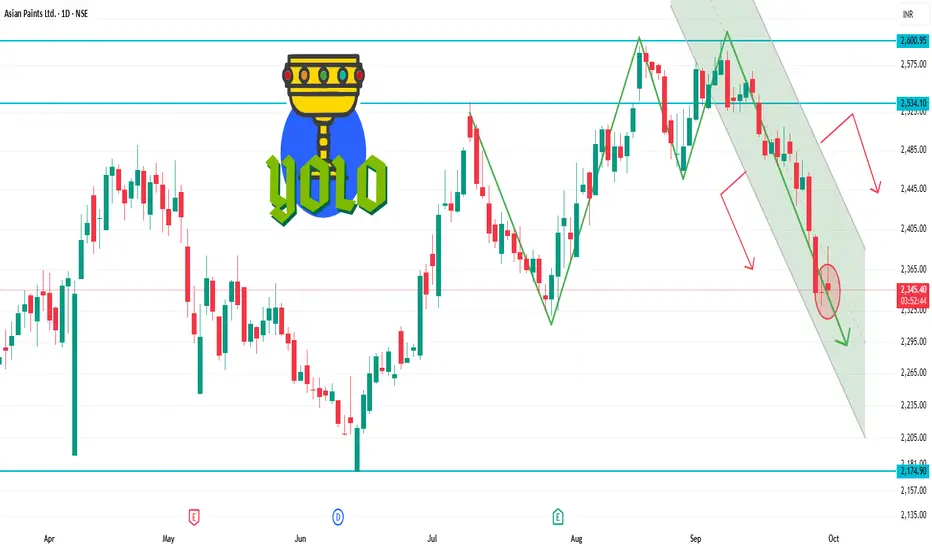
ASIANPAINT 1D Time frameCurrent Price Snapshot
Current Price: ₹2,345.50
Day’s Range: ₹2,342.00 – ₹2,388.80
52-Week Range: ₹2,124.75 – ₹3,358.00
Technical Indicators
RSI (14-day): 44.19 — indicates a neutral to slightly bearish momentum.
MACD: -4.010 — suggests bearish momentum.
Moving Averages:
5-day: ₹2,396.00 — indicates a Sell signal.
50-day: ₹2,389.00 — indicates a Sell signal.
200-day: ₹2,350.00 — indicates a Neutral signal.
Technical Summary: Predominantly Sell signals across various indicators.
Summary
Above ₹2,388.80: Potential rise toward ₹2,400 – ₹2,420.
Below ₹2,342.00: Potential fall toward ₹2,320 – ₹2,300.
Between ₹2,300 – ₹2,380: Likely range-bound movement.
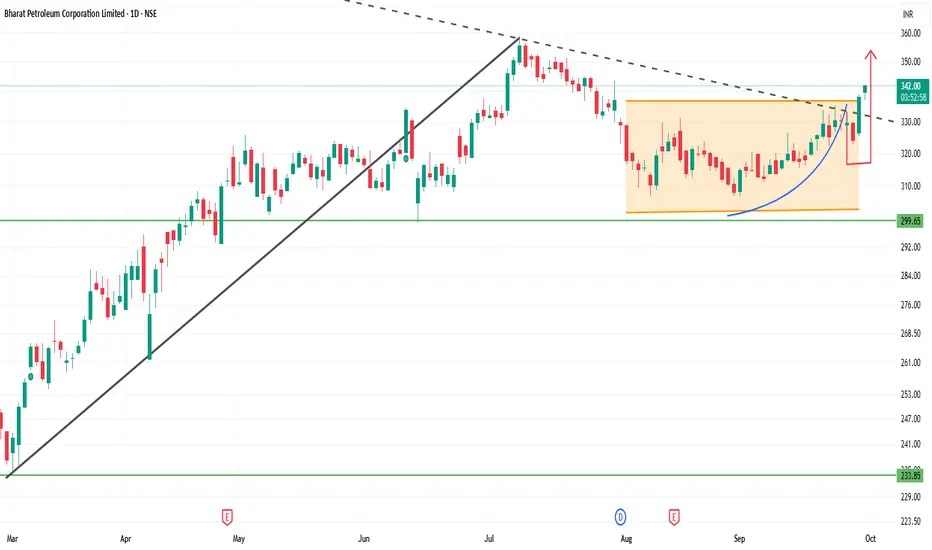
BPCL 1D Time frameCurrent Price Snapshot
Last Traded Price: ₹340.20
Day’s Range: ₹337.15 – ₹340.85
52-Week Range: ₹234.01 – ₹373.35
Technical Indicators
RSI (14-day): 53.27 — indicates a neutral momentum.
MACD: 2.49 — suggests a bullish trend.
Moving Averages:
5-day: ₹327.97 — indicates a Sell signal.
50-day: ₹322.14 — indicates a Buy signal.
200-day: ₹296.14 — indicates a Buy signal.
Pivot Points:
Support: ₹327.13
Resistance: ₹337.93
Summary
Above ₹340.85: Potential rise toward ₹345 – ₹350.
Below ₹337.15: Potential fall toward ₹330 – ₹325.
Between ₹330 – ₹340: Likely range-bound movement.
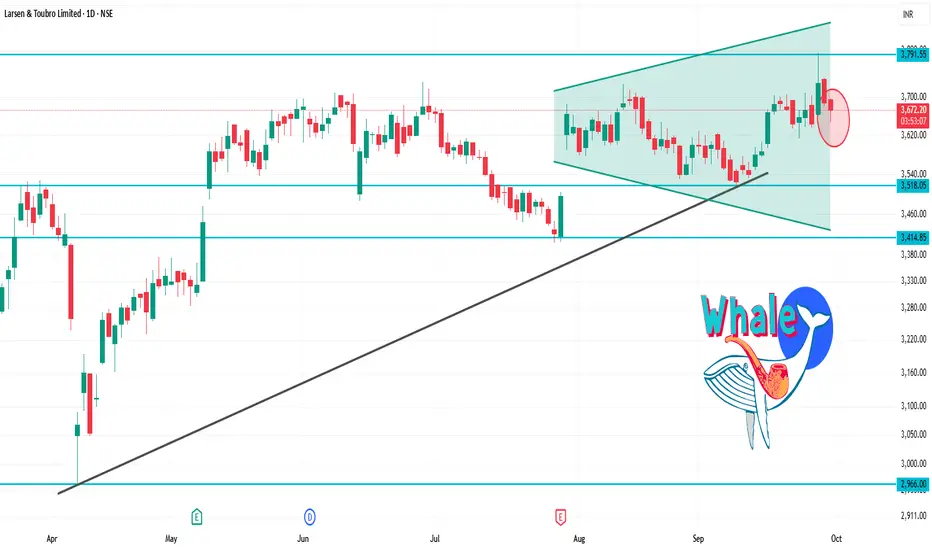
LT 1D Time frameCurrent Price: ₹3,655.30
Day’s Range: ₹3,648.00 – ₹3,696.60
52-Week Range: ₹2,965.30 – ₹3,963.50
Technical Indicators
RSI (14-day): 41.19 — indicates a neutral to slightly bearish momentum.
MACD: -1.47 — suggests bearish momentum.
Moving Averages: Mixed signals — short-term averages are bearish, while long-term averages are bullish.
Technical Summary: Predominantly Sell signals across various indicators.
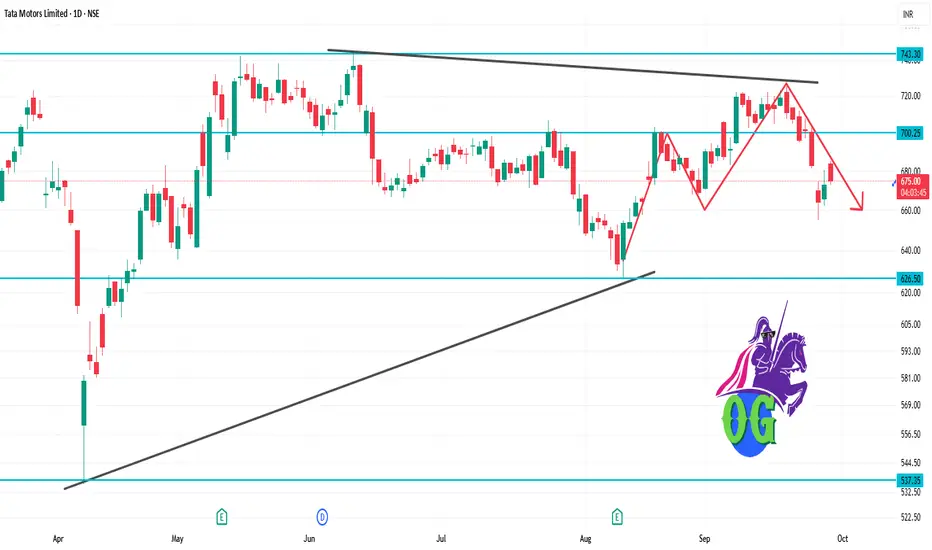
TATAMOTORS 1D Time frameCurrent Market Snapshot
Current Price: ₹675.60
Opening Price: ₹684.00
Day’s Range: ₹673.00 – ₹685.00
Previous Close: ₹672.90
🔑 Technical Indicators
Relative Strength Index (RSI): 48.5 – indicating a neutral condition.
Moving Average Convergence Divergence (MACD): -3.20 – suggesting bearish momentum.
Moving Averages: Trading below the 50-day and 200-day moving averages, indicating a bearish trend.
📈 Key Support & Resistance Levels
Immediate Support: ₹673
Immediate Resistance: ₹685
Pivot Point: ₹679
📉 Market Sentiment
Trend: The stock is trading below its 50-day and 200-day moving averages, indicating a bearish trend.
Volume: Trading volume is higher than average, suggesting increased investor activity.
📈 Strategy (1D Timeframe)
1. Bullish Scenario
Entry: Above ₹685
Stop-Loss: ₹673
Target: ₹690 → ₹695
2. Bearish Scenario
Entry: Below ₹673
Stop-Loss: ₹685
Target: ₹665 → ₹660
⚠️ Risk Management
Limit risk to 1% of capital per trade.
Always use stop-loss to protect against unexpected market movements.
Monitor broader market trends and sector-specific news that may impact stock performance.
SENSEX 1D Time frameOpening Level: ₹80,500
Current Level: ₹80,15.23
Day's Range: ₹80,300 – ₹80,800
🔑 Key Support & Resistance Levels
Immediate Support: ₹80,500
Immediate Resistance: ₹81,000
Pivot Point: ₹80,745.23
📊 Market Sentiment
Trend: The Sensex has experienced a six-day losing streak, indicating bearish momentum.
Reuters
Volume: Trading volume is significantly higher than its 20-day average, suggesting increased investor activity.
📈 Strategy (1D Timeframe)
1. Bullish Scenario
Entry: Above ₹81,000
Stop-Loss: ₹80,500
Target: ₹81,300 → ₹81,500
2. Bearish Scenario
Entry: Below ₹80,500
Stop-Loss: ₹81,000
Target: ₹80,200 → ₹80,000
⚠️ Risk Management
Limit risk to 1% of capital per trade.
Always use stop-loss to protect against unexpected market movements.
Monitor broader market trends and sector-specific news that may impact index performance.

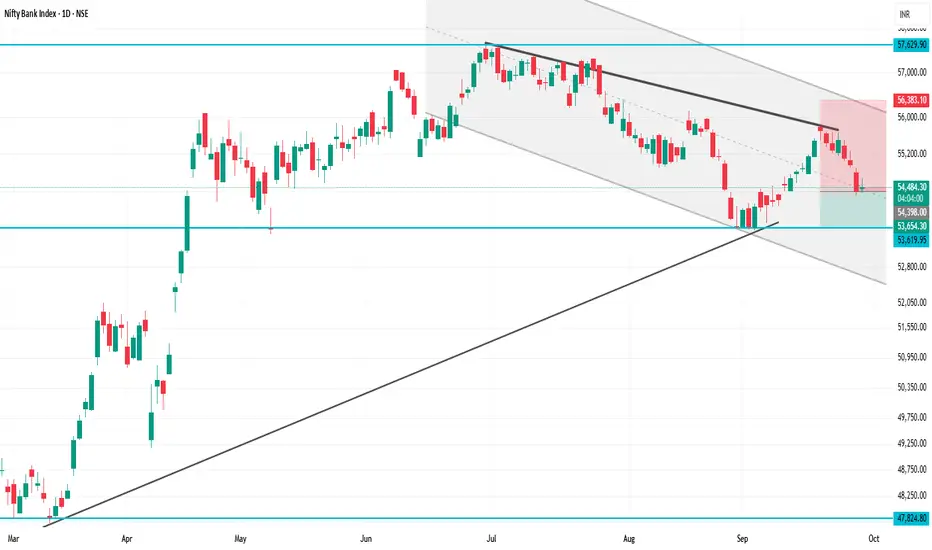
BANKNIFTY 1D Time frameCurrent Level: ₹54,651
Opening Level: ₹54,460
Day’s Range: ₹54,366 – ₹54,686
🔑 Key Support & Resistance
Immediate Support: ₹54,500
Immediate Resistance: ₹54,800
Pivot Point: ₹54,651
📈 Strategy (1D Timeframe)
1. Bullish Scenario
Entry: Above ₹54,800
Stop-Loss: ₹54,500
Target: ₹55,100 → ₹55,300
2. Bearish Scenario
Entry: Below ₹54,500
Stop-Loss: ₹54,800
Target: ₹54,300 → ₹54,100
⚠️ Risk Management
Limit risk to 1% of capital per trade.
Always use stop-loss to protect against unexpected market moves.
Watch sector news and broader market trends that can impact BANKNIFTY.