Trading With AI Is Easy1. AI Simplifies Market Analysis
One of the biggest challenges in trading is understanding the market. Human traders spend hours studying charts, indicators, and historical data. AI solves this challenge by processing vast amounts of information within seconds. Machine learning algorithms can analyze:
Price trends
Volume patterns
Global news
Social media sentiment
Economic indicators
Historical correlations
This allows AI systems to provide a deeper and more accurate view of market conditions. Instead of manually reading dozens of charts, traders simply rely on AI-generated insights that highlight trends, warn of risks, and predict probable outcomes. This drastically reduces the time and effort required to make decisions.
2. AI-Powered Predictions Improve Accuracy
AI excels at recognizing patterns that humans often overlook. Advanced models such as neural networks observe millions of data points simultaneously and forecast price movements based on probability. Although AI cannot guarantee 100% accuracy, it significantly improves the reliability of predictions compared to traditional manual analysis.
For example:
AI can identify early signs of trend reversals before they appear clearly on charts.
Predictive algorithms can estimate the strength of momentum, volatility, and breakout potential.
Sentiment analysis tools can detect market mood shifts in real time.
These capabilities help traders make more informed decisions and avoid emotional pitfalls like fear, greed, and panic.
3. Automation Makes Trading Easier
AI's greatest advantage lies in automation. Automated trading—often called algorithmic trading—uses AI systems to execute trades without human intervention. Traders simply set the rules, and the AI executes them flawlessly. This leads to:
Faster order execution
Reduced slippage
Removal of emotional bias
Consistent performance
24/7 trading even when the trader is offline
Automated systems handle multiple indicators, timeframes, and markets simultaneously, something humans cannot manage manually. This makes trading easier and more efficient for both beginners and professionals.
4. AI Helps Eliminate Emotional Trading
Humans are naturally influenced by emotions such as fear, hope, and excitement. These emotions often lead to bad decisions—entering trades too early, exiting too late, or over-trading.
AI, on the other hand, is emotionless.
It operates purely on data and logic, ensuring:
Discipline
Consistency
Accuracy
Strict adherence to strategy
This helps traders avoid common psychological traps and maintain a stable, long-term approach.
5. AI Reduces the Learning Curve
For beginners, trading can feel overwhelming. Understanding technical indicators, chart patterns, and market fundamentals usually requires months of learning. AI tools simplify this process by offering:
Ready-made strategies
Automated signals
Visual dashboards
Clear buy/sell suggestions
Real-time risk assessment
Instead of learning everything manually, traders can rely on AI tools to guide them. This shortens the learning curve and makes trading accessible even to those without deep financial knowledge.
6. AI Enhances Risk Management
Risk management is the foundation of successful trading. Many traders fail not because their strategy is wrong, but because their risk management is weak. AI enhances risk control by:
Automatically adjusting position sizes
Setting optimal stop-loss and take-profit levels
Predicting potential drawdowns
Detecting high-risk market conditions
Avoiding trades during unpredictable volatility
AI’s ability to quantify and manage risk makes trading far safer and more predictable.
7. Real-Time Market Monitoring
Markets change quickly. A sudden news event can cause massive price movements. No human can monitor markets every second, but AI can. It constantly scans:
Charts
Data feeds
News
Economic calendars
Sentiment trends
AI then instantly alerts traders or automatically executes strategies. This ensures traders never miss opportunities or fail to react during major events.
8. AI Provides Personalized Trading Experience
Modern AI tools learn from each trader’s behavior. They adjust based on:
Trading style
Risk tolerance
Preferred markets
Timeframe selection
Past performance
This personalization creates a trading system that evolves over time and becomes smarter every day. Beginners get guidance, while experienced traders get advanced insights tailored to their strategies.
9. AI Supports All Markets
AI is not limited to one market. It works across:
Stocks
Forex
Cryptocurrencies
Commodities
Indices
Derivatives (options & futures)
The same AI engine can track global markets simultaneously, giving traders a diversified edge.
10. Backtesting and Strategy Optimization Become Easy
Before using a trading strategy, it must be tested. AI makes this easy by running backtests using years of historical data. It can simulate thousands of trades within minutes. Traders can instantly see:
Profit and loss potential
Drawdowns
Win rate
Strategy performance in different market conditions
AI can also fine-tune strategies by optimizing parameters automatically, producing better results over time.
11. Time-Saving and Efficient
Trading used to require hours of chart analysis daily. With AI:
Daily analysis takes seconds
Signals are instant
Trades can run automatically
Risk is calculated in real time
This allows traders to maintain their career, studies, or business while trading part-time or passively.
12. AI Levels the Playing Field
Earlier, only big institutions had access to advanced tools. Now AI technology is widely available through:
Trading platforms
Mobile apps
Cloud-based systems
Retail AI bots
Online broker tools
This gives small traders the same processing power previously available only to hedge funds.
Conclusion: Trading With AI Is Easier, Smarter, and More Accessible
AI does not eliminate all risks, and it does not guarantee profits. But it dramatically simplifies the entire process of trading by providing:
Deep market insights
Advanced predictions
Automated decision-making
Personalized strategies
Emotion-free execution
24/7 monitoring
Optimized performance
Trading will always involve uncertainty, but with AI, traders can navigate markets with far more confidence, clarity, and efficiency. AI has changed trading forever—making it easier, smarter, and more accessible for everyone.
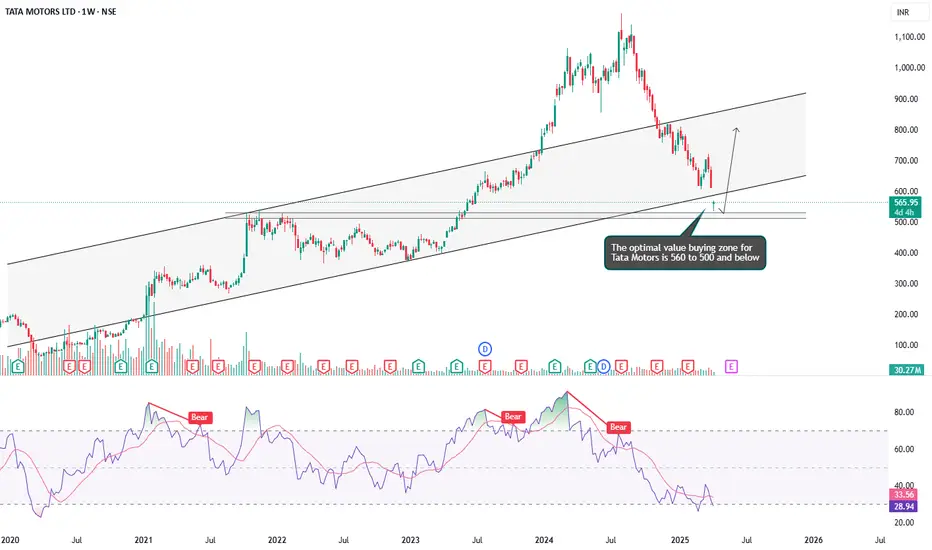
Tatamotorslong

PCR Trading StrategyMoneyness of Options
Moneyness shows whether the option has intrinsic value:
In the Money (ITM): Already profitable if exercised.
At the Money (ATM): Strike price = market price.
Out of the Money (OTM): No intrinsic value, only time value.
Factors Affecting Option Prices (Option Greeks)
Options are influenced by multiple factors:
Delta: Sensitivity to underlying price changes.
Gamma: Sensitivity of Delta.
Theta: Time decay – options lose value as expiry nears.
Vega: Sensitivity to volatility.
Rho: Sensitivity to interest rates.
Payoff Profiles
Buyer of Call/Put: Limited loss (premium), unlimited profit.
Seller of Call/Put: Limited profit (premium), unlimited or large risk.

Tata Motos ltdTATA MOTORS LTD – Weekly Chart Analysis (For Learning Purpose Only)
(This analysis is only for educational purposes and is not any kind of investment advice)
-Chart Overview
The screenshot shows TATA MOTORS weekly chart with a Descending Trendline (red dashed line) and an Ascending Channel (blue lines).
The price is currently testing the channel support area.
🧭 1. Trend Analysis
Long-Term Trend: Continuous decline since the 2022 top, but attempting a reversal since 2023.
Short-Term Trend: Selling pressure from the recent high (correction phase).
📈 2. Chart Pattern
Ascending Channel Breakdown Risk:
Price is near the lower trendline of the channel, and a breakdown could lead to a sharp fall.
Bearish Flag Possibility:
After the previous down move, a small uptrend channel has formed, which could act as a bearish flag if broken.
📉 3. Key Levels
Level (₹) Type Description
1,065.60 🔺 Major Resistance Top of the downtrend
921.20 🔺 Secondary Resistance Recent swing high
723.05 🔺 Minor Resistance Support before breakdown
635.45 ⚠️ Current Price Near channel support
593.00 🛑 Support Price bounce zone
490.25 🔻 Critical Support Break below could lead more declinw
🧠 4. Possible Scenarios
Scenario 1 – Support Holds:
If price bounces from ₹635–₹593 support zone, a move towards ₹723–₹921 is possible.
Scenario 2 – Support Breaks:
If price sustains below ₹593, it could open the path for a fall towards ₹490.
⚠️ Disclaimer
This analysis is only for educational and learning purposes.
It is not an investment or trading advice.
Stock market investing is risky – please consult a SEBI-registered financial advisor before making any decisions.
#StockMarket #TechnicalAnalysis #TataMotors #PriceAction #TradingView #ChartAnalysis #LearningPurpose #StockMarketEducation #NoInvestmentAdvice

TATA Motors : Buy if 1st monthly closing happen above 678 levelLevels are mentioned in the chart . TATA MOTORS might fall below 495 once.
It will be a buying level though .
Note : I am not a SEBI registered adviser . Please consider my analysis only for education purpose .

IS TATA MOTORS READY TO REV UP? A SOLID PICK FOR INVESTORSSymbol - TATAMOTORS
CMP - 539
TATA Motors, a leading global automobile manufacturer with brands like Jaguar and Land Rover, has been on a downtrend in recent months. However, it is now approaching an important demand zone, making it an attractive opportunity for medium to long-term investors. The stock is currently trading at a good valuation, offering significant value at these levels.
Despite the recent decline, TATA Motors boasts solid fundamentals, with a diversified business model in both passenger and commercial vehicles. The company’s growing focus on electric vehicles (EVs) positions it well for long-term growth. As the global demand for EVs increases, TATA Motors is likely to benefit, making the stock an appealing pick for investors.
The downside risk appears limited, and a recovery or consolidation at these levels is highly likely. This creates a strong entry point for investors seeking long-term value. Overall, TATA Motors presents a solid investment opportunity given its strong market position and growth potential in the evolving automotive industry.
Disclaimer - Do not consider this as a buy/sell recommendation. I'm sharing my analysis & my trading position. You can track it for educational purposes. Thanks!
Tata Motors breakout from parallel channel looking goodTata motors breakout from parallel channel
and also nifty50 looking good now i think from now short covering is coming
to near upside levels marked on chart
breakout and sustaining out side of channel
anybody can clearly see the break off structure in 15 Min chart
but be cautious with strict SL
:- do your own research before investing and this is not a buy/sell call
am not a sebi registered

#TATAMOTORS IDEAWeekly TF:- Inverse H&S breakout on #TATAMOTORS , one can enter on retest level. Tata motors is headings for 1000+ in coming 12-15 months.

Tata motors- BullishEntered in already tested supply zone
Possibly it wont hold
Expecting 1175 in coming days
1170 strong support now
Looks Good

TATA Motors Multibagger for next 4 years after Monthly breakoutTATA Motors is about to break above Monthly H&S Pattern --> Breakout will make it Multibagger for coming 3-4 Years Price can touch 4000+

TATA MOTORS LOOKING GOOD FOR MORE UPSIDETatamotors have given the breakout of previous high @ 1066 levels and closed above that. Further rally can be expected in the stock if it sustains above 1095 towards 1150 and upper marked levels until 967 is intact on the downside.
To motivate us, Please like the idea If you agree with the analysis.
Happy Trading!
InvestPro India

TATAMOTORS - Ichimoku Breakout📈 Stock Name - Tata Motors Limited
🌐 Ichimoku Cloud Setup:
1️⃣ Today's close is above the Conversion Line.
2️⃣ Future Kumo is Turning Bullish.
3️⃣ Chikou span is slanting upwards.
All these parameters are shouting BULLISH at the Current Market Price and even more bullishness anticipated AFTER crossing 1091.
🚨Disclaimer: This is not a Buy or Sell recommendation. It's for educational purposes and a guiding light to learn trading in the market.
#CloudTrading
#IchimokuCloud
#IchimokuFollowers
#Ichimokuexpert
Excited about this analysis? Share your thoughts in the comments below!
👍 Like, Share, and Subscribe for daily market insights! 🚀
*Disclaimer : Invested 👍
#StockAnalysis #MarketWatch #TradingEducation #ichimoku #midcap #smallcap #TATAMOTORS

Tata Motors - Strong Bullish BreakoutStock finally breaking out after long consolidations
Targetiing new highs
Showing Good Strength
Breaking out with good volumes
1000 can act as new strong support area
can reach 1200 in coming days

Tata Motors : Swing Trade#tatamotors #vcpsetup #breakoutcandidate #swingtrade
Tata Motors : Swing Trade
>> Multiple VCP setup
>> Breakout Soon
>> Trending setup
>> Good Risk Reward Trade
Swing Traders can lock 10% profit & keep trailing
Please give a Boost or comment if u r Liking the analysis & Learning from it. Keep showing ur Love by following
Disclaimer : This is not a Trade Recommendations & Charts/ stocks Mentioned are for Learning/Educational Purpose. Do your Own Analysis before Taking positions.

Tata Motors Flag and Pole Pattern Breakout Above 1050Details:
Asset: Tata Motors Limited (TATAMOTORS)
Breakout Level: Above 1050
Potential Target: Significant upside momentum expected
Stop Loss: Below breakout level or as per risk tolerance
Timeframe: Short to medium-term
Rationale: Tata Motors Limited (TATAMOTORS) is poised to give a breakout from a flag and pole pattern if it sustains above the 1050 level. This breakout could indicate a shift to bullish sentiment and potential for significant upward movement.
Market Analysis:
Technical Breakout: A breakout above 1050 from the flag and pole pattern suggests strong bullish momentum, likely to attract increased buying interest and drive the price higher.
Market Sentiment: Positive market sentiment or company-specific catalysts may be supporting the anticipated breakout in TATAMOTORS.
Potential Target:
The potential upside target is not specified but is expected to be significant given the flag and pole pattern breakout.
Risk Management:
Implementing a stop loss strategy below the breakout level is essential to manage risk in case of unexpected price reversals.
Timeframe:
The projected move for TATAMOTORS is based on a short to medium-term outlook, but actual timing may vary based on market dynamics.
Risk-Reward Ratio: Consider individual risk tolerance and adjust position size accordingly to maintain a favorable risk-reward ratio.
As with any investment opportunity, conduct thorough analysis and consider factors such as market trends, company fundamentals, and risk management strategies before making trading decisions.

Tata Motors Ltd - Breakout OpportunityDate : 10-May-2024
Rating : Buy - Positional Trade
LTP : Rs. 1,046.65
Targets: (1) Rs. 1,065 --> (2) Rs. 1,155
SL : Rs. 977 on daily close basis
Technical View:
• NSE:TATAMOTORS is in its primary uptrend and was recently going through it's secondary downtrend.
• After touching the high of 1,065.60 on 5-Mar-2024, it has retraced 14% to 921.20 level.
• On 10-May-2024, NSE:TATAMOTORS has broke out from its secondary down trend with higher than average volume.
• NSE:TATAMOTORS has also closed above 20 DMA and 21 DEMA on 8-May-2024.
• RSI is trading at 63.72 and MACD is trading at 11.28.
• Looking good to continue upward journey.
Disclaimer : I am not a SEBI registered analyst/consultant and not recommending anyone to take any BUY or SELL position in stock market. Investing in stock market is risky and one should do a self analysis and validation before investing in stock market. Ideas are published for learning purpose only.

Tata Motors Ltd - Breakout OpportunityDate : 6-May-2024
Rating : Buy - Positional Trade
LTP : Rs. 1,016.20
Targets: (1) Rs. 1,065 --> (2) Rs. 1,155
SL : Rs. 995.00 on daily close basis
Technical View:
• NSE:TATAMOTORS is in its primary uptrend and was recently going through it's secondary downtrend.
• After touching the high of 1,065.60 on 5-Mar-2024, it has retraced 14% to 921.20 level.
• On 2-May-2024, NSE:TATAMOTORS has broke out from its secondary down trend with higher than average volume.
• Since 25-Apr-2024, NSE:TATAMOTORS is trading above 20 DMA and 21 DEMA.
• RSI and MACD has already given cross over and trading at 58.43 and 8.93 respectively, indicating bullish momentum in coming days.
Disclaimer : I am not a SEBI registered analyst/consultant and not recommending anyone to take any BUY or SELL position in stock market. Investing in stock market is risky and one should do a self analysis and validation before investing in stock market. Publishing the ideas for learning purpose only.

Tata Motors head and shoulder breakoutTata Motors inverse head and shoulder breakout on monthly tf
closing above 650 can lead to 830 and final 950+
risk reward ration will be 4.1
dc : only for educational and learning purpose

Bullish Breakout in Tata MotorsA bullish flag & pole Chart Pattern Breakout on the Weekly Time frame of NSE:TATAMOTORS
Price Action supported by very good volume.
The stock is currently in uptrend making higher highs and higher lows.
One can add this stock into their stocks to buy list and initiate the long trade as per the levels mentioned on the chart
Stop loss will be on a Weekly closing basis.
Trend Analysis :- UP Trend
Chart Pattern :- Bullish flag & pole Chart Pattern
Technical Indicator :- Positive MACD Crossover
Disclaimer: This is for educational purpose only.

Diwali pics (TATA MOTOR)DIWALI PICS of stocks with the target of 1000/1100|+ holdingd period more than a year
stoploss near 550-570
buying range near 630-660

weekly bullish patter in BGR EnergyA Inverted Head & Shoulder Chart Pattern Breakout happened on the Weekly Time frame of NSE:BGRENERGY
Price Action supported by volume.
The stock is currently in uptrend making higher highs and higher lows.
One can add this stock into their stocks to buy list.
One can initiate the long trade as per the level mentioned on the chart
Stop loss will be on a Daily closing basis.
Trend Analysis :- UP Trend
Chart Pattern :- Bullish Inverted Head & Shoulder Chart Pattern
Technical Indicator :- Positive MACD Crossover
Disclaimer: This is for Educational Purpose only.

TATAMOTORS Long for Medium TermThe stock has been in consolidation mode since July 2023 in the range of 600/- to 660/-.
It broke out of this consolidation range and closed at 671.55 today the 15th Nov 2023 with a daily volume of 11.32 mil shares against the average daily volume of 9.03mil shares.
The stock has been consolidating above its all time high of 603.80 reached on 3rd Feb 2015, however it is still inside the daily sell zone of 666/- to 678/-
INFERENCE: The stock shows strength in the current state and one can go long after a close above 678/-.
Medium Term Target: We are looking at a medium term (4 to 6 months) target of 860/-. This is about 26% on 678/-.

Tata Motors 1:5 setup*Swing Trade*
Buy Tata Motors between 673-675
SL 674
Target 1: 687
Target 2: 695
Target 3: 700
Duration 1-3 Weeks
RR: 1:5 Trade as per you risk taking capacity

TATAMETALI may consolidate/fall for a whileI am not holding
Disclaimer: This analysis is solely for educational purposes and does not make me a SEBI registered analyst.
If you found this analysis helpful, I encourage you to like and share it. Your observations and comments are also welcomed below. Your support, likes, follows, and comments motivate me to consistently share valuable insights with you.
🔍 More Analysis & Trade Setups 🔍
For more technical analysis and trade setups, make sure to follow me on TradingView: www.tradingview.com
