Tata MotorsTata Motors Passenger Vehicles Long-term Analysis
Tata Motors Demand Zone----
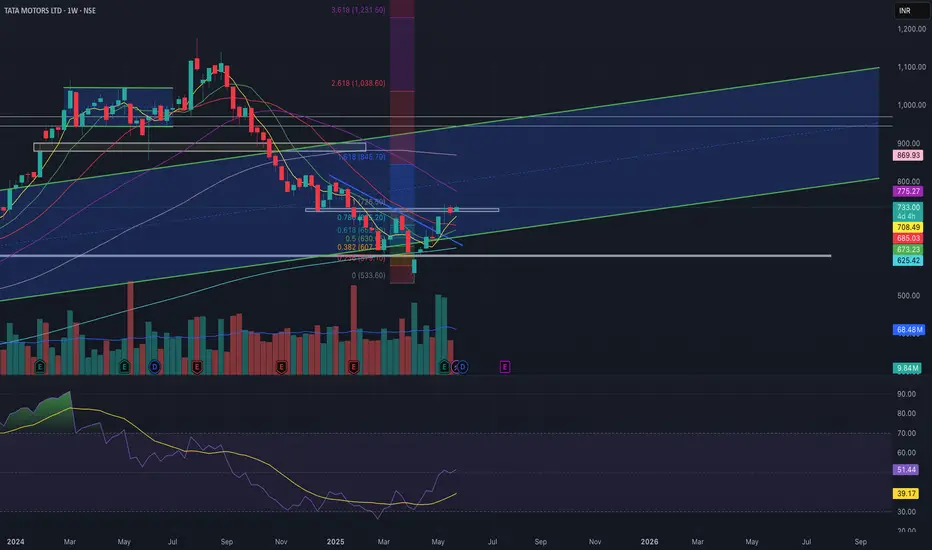
Tata Motors Chart Support Fibonacci Level- 0.5, 0.61
Tatamotorstrendanalysis

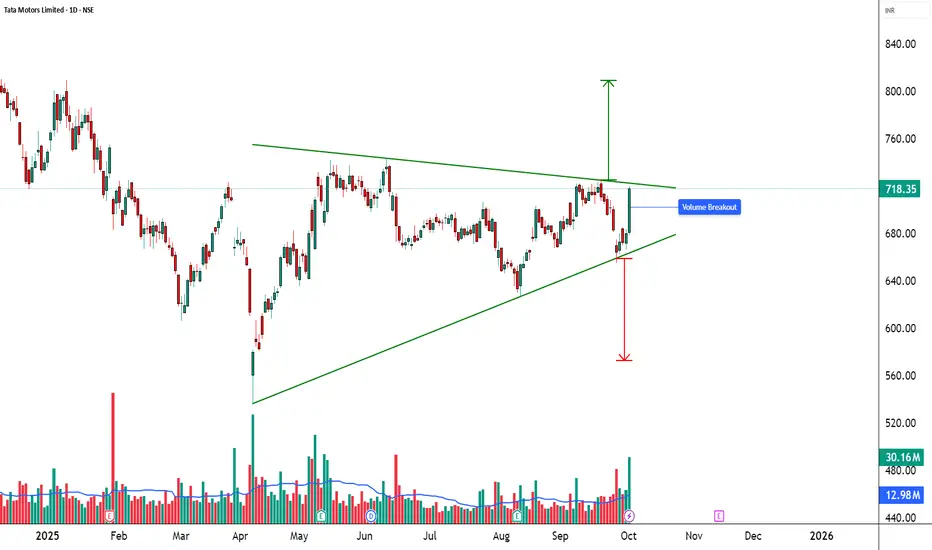
TATAMOTORS - Symmetrical Triangle Breakout Watch________________________________________
🚀 Tata Motors Ltd (NSE: TATAMOTORS) | Symmetrical Triangle Breakout Watch
________________________________________
🏢 Company Overview
Tata Motors Ltd is one of India’s leading automobile manufacturers, producing cars, SUVs, electric vehicles, and commercial vehicles. After an extended consolidation phase, the stock is trading inside a symmetrical triangle formation, indicating a possible strong directional move ahead.
________________________________________
📊 Current Market Snapshot
CMP: ₹718.35
Sector: Automobiles & Commercial Vehicles
Pattern Observed: 🔺 Symmetrical Triangle
Candlestick Signal: Bullish Marubozu + Strong Momentum Candle
Strength Rating: ⭐⭐⭐⭐ (Bullish Breakout Watch)
________________________________________
📈 Price Action & Chart Pattern
The stock has been consolidating within a symmetrical triangle, where buyers are defending higher lows while sellers cap gains at the resistance zone. The latest session witnessed a powerful bullish candle with extremely high volume, suggesting institutional participation.
Support Trendline: ₹665 – ₹670
Resistance Trendline: ₹720 – ₹725
Breakout Zone: Above ₹725 with strong volume
Breakdown Zone: Below ₹665 may invite fresh selling pressure
🔍 Why Important? Symmetrical triangles act as springboards for big moves once a breakout/breakdown occurs with confirmation.
________________________________________
🔎 Technical Indicators
RSI (14): 59.75 → Turning bullish with upside room.
EMA Support: Price reclaimed EMA levels, signaling renewed strength.
Volume: Recent upmove supported by 3x average volumes, a strong confirmation factor.
________________________________________
📍 Key Levels to Watch
Immediate Support: ₹665 – ₹670
Immediate Resistance: ₹720 – ₹725
Upside possible (if breakout): ₹770 – ₹800
Downside possible (if breakdown): ₹620 – ₹600
________________________________________
🔮 Bullish & Bearish Scenarios
✅ Bullish Case: A strong close above ₹725 with volume can trigger a rally towards ₹770–₹800.
⚠️ Bearish Case: Rejection at resistance and breakdown below ₹665 may drag the stock back to ₹620.
________________________________________
📝 STWP Trade Analysis
Entry: ₹718.35
Stop-loss: ₹665.75 (just below triangle support)
Risk: 52.60 points
Strength: ⚡ Strong Bullish Momentum + Extremely High Volume
Demand Zone: ₹666.65 – ₹683 | SL: 665.75
📌 Note: Strong momentum setup with excellent volume confirmation. Traders must stay disciplined with SL.
________________________________________
🎯 Final Outlook
Tata Motors is at a decisive breakout point. If the stock sustains above ₹725 with strong volumes, it could fuel a sharp rally towards ₹800. Failure to hold this zone may lead to renewed consolidation or a pullback towards ₹665. Patience and strict discipline are essential here.
________________________________________
💡 Learning Note: Symmetrical triangles with heavy-volume breakouts often lead to trend continuation setups. Combining price action, candlestick strength, and volume surge improves the accuracy of trade setups.
________________________________________
⚠️ Disclosure & Disclaimer – Please Read Carefully
The information shared here is meant purely for learning and awareness. It is not a buy or sell recommendation and should not be taken as investment advice. I am not a SEBI-registered investment adviser, and all views expressed are based on personal study, chart patterns, and publicly available market data.
Trading—whether in stocks or options—carries risk. Markets can move unexpectedly, and losses can sometimes exceed the money you have invested. Past performance or past setups do not guarantee future results.
If you are a beginner, treat this as a guide to understand how the market works and practice on paper trades before risking real money. If you are experienced, always assess your own risk, position sizing, and strategy suitability before entering trades.
Consult a SEBI-registered financial adviser before making any real trading decision. By engaging with this content, you acknowledge full responsibility for your trades and investments.
💬 Found this useful?
🔼 Give this post a Boost to help more traders discover clean, structured learning.
✍️ Drop your thoughts, questions, or setups in the comments — let’s grow together!
🔁 Share with fellow traders and beginners to spread awareness.
👉 “If you liked this breakdown, follow for more clean, structured setups with discipline at the core.”
🚀 Stay Calm. Stay Clean. Trade With Patience.
Trade Smart | Learn Zones | Be Self-Reliant 📊
________________________________________
Part 1 Candle Stick Pattern Understanding Option Trading
Option trading is a segment of financial markets that allows investors to buy or sell the right to buy or sell an underlying asset at a predetermined price within a specific time frame. Unlike traditional stock trading, options provide leverage, flexibility, and risk management tools, making them appealing for both hedging and speculative purposes.
Options are derivatives, meaning their value is derived from an underlying asset, such as stocks, indices, commodities, or currencies. An option does not grant ownership of the asset itself but gives the holder the right to engage in a transaction involving the asset.
Types of Options
Options are broadly categorized into two types:
Call Options
A call option gives the buyer the right (but not the obligation) to buy the underlying asset at a specified price, called the strike price, before or on the expiration date.
Buyers of call options generally expect the underlying asset’s price to rise, allowing them to purchase the asset at a lower price than the market value.
Sellers (writers) of call options receive the option premium upfront but take on the obligation to sell the asset if the buyer exercises the option.
Put Options
A put option gives the buyer the right (but not the obligation) to sell the underlying asset at the strike price before or on the expiration date.
Buyers of put options generally expect the underlying asset’s price to fall, allowing them to sell the asset at a higher price than the market value.
Sellers of put options receive the premium but face the obligation to buy the asset if exercised.
Key Components of Options
To understand option trading, one must know the following components:
Underlying Asset – The security or asset on which the option is based (e.g., a stock like Apple or an index like Nifty 50).
Strike Price (Exercise Price) – The predetermined price at which the option can be exercised.
Expiration Date – The date on which the option expires. After this date, the option becomes worthless.
Premium – The price paid by the buyer to the seller for the rights conferred by the option.
Intrinsic Value – The difference between the underlying asset’s current price and the strike price, representing the real, immediate value of the option.
Time Value – The portion of the premium that reflects the possibility of the option gaining value before expiration. Time decay reduces this value as the expiration date approaches.
How Options Work
Let’s illustrate with an example:
Suppose a stock is trading at ₹1,000, and you buy a call option with a strike price of ₹1,050, expiring in one month, paying a premium of ₹20.
If the stock rises to ₹1,100 before expiration, you can exercise the option to buy at ₹1,050, making a profit of ₹50 per share minus the premium, i.e., ₹30 per share.
If the stock stays below ₹1,050, you would not exercise the option, losing only the premium of ₹20.
This example highlights two key advantages of options:
Leverage: You control more assets with less capital compared to buying the stock outright.
Limited Risk: The maximum loss for the buyer is the premium paid, unlike stock trading where losses can be higher.

Tata Motos ltdTATA MOTORS LTD – Weekly Chart Analysis (For Learning Purpose Only)
(This analysis is only for educational purposes and is not any kind of investment advice)
-Chart Overview
The screenshot shows TATA MOTORS weekly chart with a Descending Trendline (red dashed line) and an Ascending Channel (blue lines).
The price is currently testing the channel support area.
🧭 1. Trend Analysis
Long-Term Trend: Continuous decline since the 2022 top, but attempting a reversal since 2023.
Short-Term Trend: Selling pressure from the recent high (correction phase).
📈 2. Chart Pattern
Ascending Channel Breakdown Risk:
Price is near the lower trendline of the channel, and a breakdown could lead to a sharp fall.
Bearish Flag Possibility:
After the previous down move, a small uptrend channel has formed, which could act as a bearish flag if broken.
📉 3. Key Levels
Level (₹) Type Description
1,065.60 🔺 Major Resistance Top of the downtrend
921.20 🔺 Secondary Resistance Recent swing high
723.05 🔺 Minor Resistance Support before breakdown
635.45 ⚠️ Current Price Near channel support
593.00 🛑 Support Price bounce zone
490.25 🔻 Critical Support Break below could lead more declinw
🧠 4. Possible Scenarios
Scenario 1 – Support Holds:
If price bounces from ₹635–₹593 support zone, a move towards ₹723–₹921 is possible.
Scenario 2 – Support Breaks:
If price sustains below ₹593, it could open the path for a fall towards ₹490.
⚠️ Disclaimer
This analysis is only for educational and learning purposes.
It is not an investment or trading advice.
Stock market investing is risky – please consult a SEBI-registered financial advisor before making any decisions.
#StockMarket #TechnicalAnalysis #TataMotors #PriceAction #TradingView #ChartAnalysis #LearningPurpose #StockMarketEducation #NoInvestmentAdvice

TATAMOTORS ready to give 100 points upsideW pattern in Weekly TF.
RSI divergence along with strength.
Presently at resistance & may consolidate for a few more days.
immediate target of 780.
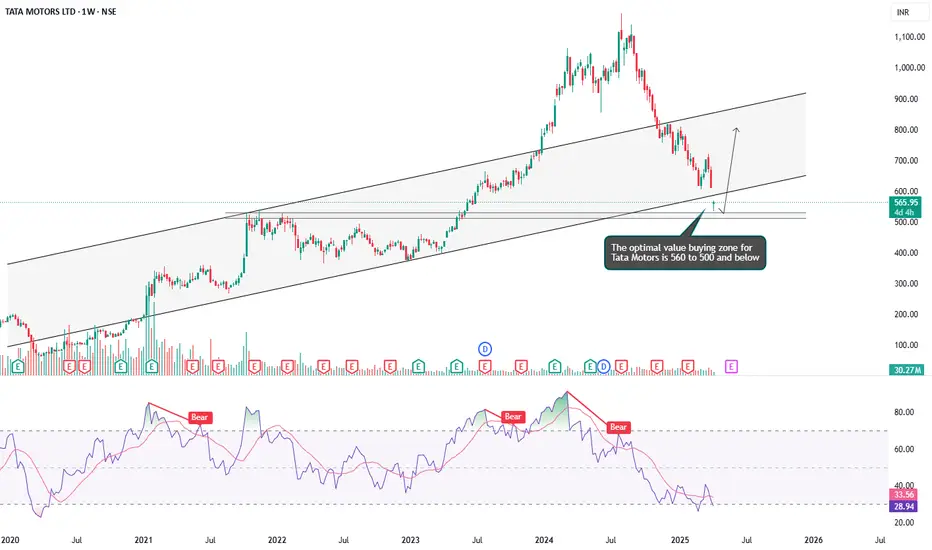
IS TATA MOTORS READY TO REV UP? A SOLID PICK FOR INVESTORSSymbol - TATAMOTORS
CMP - 539
TATA Motors, a leading global automobile manufacturer with brands like Jaguar and Land Rover, has been on a downtrend in recent months. However, it is now approaching an important demand zone, making it an attractive opportunity for medium to long-term investors. The stock is currently trading at a good valuation, offering significant value at these levels.
Despite the recent decline, TATA Motors boasts solid fundamentals, with a diversified business model in both passenger and commercial vehicles. The company’s growing focus on electric vehicles (EVs) positions it well for long-term growth. As the global demand for EVs increases, TATA Motors is likely to benefit, making the stock an appealing pick for investors.
The downside risk appears limited, and a recovery or consolidation at these levels is highly likely. This creates a strong entry point for investors seeking long-term value. Overall, TATA Motors presents a solid investment opportunity given its strong market position and growth potential in the evolving automotive industry.
Disclaimer - Do not consider this as a buy/sell recommendation. I'm sharing my analysis & my trading position. You can track it for educational purposes. Thanks!
Tata Motors Intraday Ideas for December first wek 2024hi! this is Kapil,
Traders know the Secret of intraday trading in Tata Motors.
One candle close above with volume will result into targets
of both sides in Tata motors in 2024 Dec first week.
Disclaimer - Before making any actual investment or trading decisions, it is strongly recommended that you consult a qualified broker or financial advisor.

Tata Motors breakout from parallel channel looking goodTata motors breakout from parallel channel
and also nifty50 looking good now i think from now short covering is coming
to near upside levels marked on chart
breakout and sustaining out side of channel
anybody can clearly see the break off structure in 15 Min chart
but be cautious with strict SL
:- do your own research before investing and this is not a buy/sell call
am not a sebi registered

TATA MOTORS If weekly closing couldn't sustain above that red line then possibly it could 📉📉
828 level marked is pending, chances are it could test within 21st Oct 2024
Disclaimer:
It's a personal view not a financial advice and I assume no responsibility and liability whatever outcome arises.

TATA MOTORS Tata Motors is approaching the support area at 1050. We should consider a long trade near the 1050 price level.

Tata motors- BullishEntered in already tested supply zone
Possibly it wont hold
Expecting 1175 in coming days
1170 strong support now
Looks Good

Tata Motors Ltd - Positional TradeDate : 11-Aug-2024
LTP : Rs. 1068.10 (on 9-Aug-2024)
Next Resistances: (1) Rs. 1,179 --> (2) Rs. 1,284
SL : Rs. 950 on daily close basis
Technical View:
• NSE:TATAMOTORS is in it's primary uptrend and currently going through it's secondary uptrend.
• After breaking out from it's previous secondary uptrend on 25-Jul-2024, NSE:TATAMOTORS had touched the high of 1,179 on 30-Jul-2024.
• From it's previous high of 1,179 NSE:TATAMOTORS has retraced 14% to 1,008.40 level. NSE:TATAMOTORS has re-tested the previous secondary downtrend line and started the upward movement after taking a support at 50 DMA.
• On 9-Aug-2024, NSE:TATAMOTORS has closed above 20 DMA.
• RSI has re-entered buy zone on 9-Aug-2024 and trading at 54.16.
• MACD is trading at 14.21.
• Looking good from here onwards.
If you like the analysis, Boost/Like the idea and follow my ID.
Disclaimer : I am not a SEBI registered analyst/consultant and not recommending anyone to take any BUY or SELL position in stock market. Investing in stock market is risky and one should do a self analysis and validation before investing in stock market. My ideas are published for learning purpose only and are available to everyone at no cost/charge.

medium term Investment opportunity in Tata Motor for >30% upsideHi,
NSE:TATAMOTORS has given a Bullish Flag Breakout on Weekly charts with very good volume.
MACD is also on the bullish side on Daily and Monthly time frames. RSI is also on the bullish side on daily, weekly and monthly time frames.
In the current market scenario, I am expecting that the bullish momentum will continue.
Complete price projection like entry, stop loss and targets mentioned on the charts for educational purpose.
Don't Forget to Follow me to get all the updates.
Please share your feedback or any queries on the study.
Disclaimer: Please consult your financial advisor before making any investment decision.

TATA MOTORS LOOKING GOOD FOR MORE UPSIDETatamotors have given the breakout of previous high @ 1066 levels and closed above that. Further rally can be expected in the stock if it sustains above 1095 towards 1150 and upper marked levels until 967 is intact on the downside.
To motivate us, Please like the idea If you agree with the analysis.
Happy Trading!
InvestPro India

Tata Motors - Strong Bullish BreakoutStock finally breaking out after long consolidations
Targetiing new highs
Showing Good Strength
Breaking out with good volumes
1000 can act as new strong support area
can reach 1200 in coming days

Tata Motors Flag and Pole Pattern Breakout Above 1050Details:
Asset: Tata Motors Limited (TATAMOTORS)
Breakout Level: Above 1050
Potential Target: Significant upside momentum expected
Stop Loss: Below breakout level or as per risk tolerance
Timeframe: Short to medium-term
Rationale: Tata Motors Limited (TATAMOTORS) is poised to give a breakout from a flag and pole pattern if it sustains above the 1050 level. This breakout could indicate a shift to bullish sentiment and potential for significant upward movement.
Market Analysis:
Technical Breakout: A breakout above 1050 from the flag and pole pattern suggests strong bullish momentum, likely to attract increased buying interest and drive the price higher.
Market Sentiment: Positive market sentiment or company-specific catalysts may be supporting the anticipated breakout in TATAMOTORS.
Potential Target:
The potential upside target is not specified but is expected to be significant given the flag and pole pattern breakout.
Risk Management:
Implementing a stop loss strategy below the breakout level is essential to manage risk in case of unexpected price reversals.
Timeframe:
The projected move for TATAMOTORS is based on a short to medium-term outlook, but actual timing may vary based on market dynamics.
Risk-Reward Ratio: Consider individual risk tolerance and adjust position size accordingly to maintain a favorable risk-reward ratio.
As with any investment opportunity, conduct thorough analysis and consider factors such as market trends, company fundamentals, and risk management strategies before making trading decisions.

Tata Motors Ltd - Breakout OpportunityDate : 10-May-2024
Rating : Buy - Positional Trade
LTP : Rs. 1,046.65
Targets: (1) Rs. 1,065 --> (2) Rs. 1,155
SL : Rs. 977 on daily close basis
Technical View:
• NSE:TATAMOTORS is in its primary uptrend and was recently going through it's secondary downtrend.
• After touching the high of 1,065.60 on 5-Mar-2024, it has retraced 14% to 921.20 level.
• On 10-May-2024, NSE:TATAMOTORS has broke out from its secondary down trend with higher than average volume.
• NSE:TATAMOTORS has also closed above 20 DMA and 21 DEMA on 8-May-2024.
• RSI is trading at 63.72 and MACD is trading at 11.28.
• Looking good to continue upward journey.
Disclaimer : I am not a SEBI registered analyst/consultant and not recommending anyone to take any BUY or SELL position in stock market. Investing in stock market is risky and one should do a self analysis and validation before investing in stock market. Ideas are published for learning purpose only.

Tata Motors Ltd - Breakout OpportunityDate : 6-May-2024
Rating : Buy - Positional Trade
LTP : Rs. 1,016.20
Targets: (1) Rs. 1,065 --> (2) Rs. 1,155
SL : Rs. 995.00 on daily close basis
Technical View:
• NSE:TATAMOTORS is in its primary uptrend and was recently going through it's secondary downtrend.
• After touching the high of 1,065.60 on 5-Mar-2024, it has retraced 14% to 921.20 level.
• On 2-May-2024, NSE:TATAMOTORS has broke out from its secondary down trend with higher than average volume.
• Since 25-Apr-2024, NSE:TATAMOTORS is trading above 20 DMA and 21 DEMA.
• RSI and MACD has already given cross over and trading at 58.43 and 8.93 respectively, indicating bullish momentum in coming days.
Disclaimer : I am not a SEBI registered analyst/consultant and not recommending anyone to take any BUY or SELL position in stock market. Investing in stock market is risky and one should do a self analysis and validation before investing in stock market. Publishing the ideas for learning purpose only.

Tata Motors head and shoulder breakoutTata Motors inverse head and shoulder breakout on monthly tf
closing above 650 can lead to 830 and final 950+
risk reward ration will be 4.1
dc : only for educational and learning purpose

Bullish Breakout in Tata MotorsA bullish flag & pole Chart Pattern Breakout on the Weekly Time frame of NSE:TATAMOTORS
Price Action supported by very good volume.
The stock is currently in uptrend making higher highs and higher lows.
One can add this stock into their stocks to buy list and initiate the long trade as per the levels mentioned on the chart
Stop loss will be on a Weekly closing basis.
Trend Analysis :- UP Trend
Chart Pattern :- Bullish flag & pole Chart Pattern
Technical Indicator :- Positive MACD Crossover
Disclaimer: This is for educational purpose only.

SHORT TATAMOTORS @ 730 - 740Tata Motors trading in a channel and facing resistance near upper line of the channel. Sell trade can be initiated @ 730 - 740 with SL above 760 for the targets of 680 & 650.
To motivate us, Please like the idea If you agree with the analysis.
Happy Trading!

Tata Motors Stocks to BuyHi friends this is my technical analysis on Tata motors please have a look on this. Buy above 631 for target of T1-660, T2-680 and T3-700 and SL-590.

Bullish Bat In TatamotorsBullish Bat In Tatamotors
Buy PRZ - 610.7/613.65
SL - 606.9
Target - 621/627
Sell Tatamotors If Breaks 606.9
SL - 625.1
Target - 580/570
