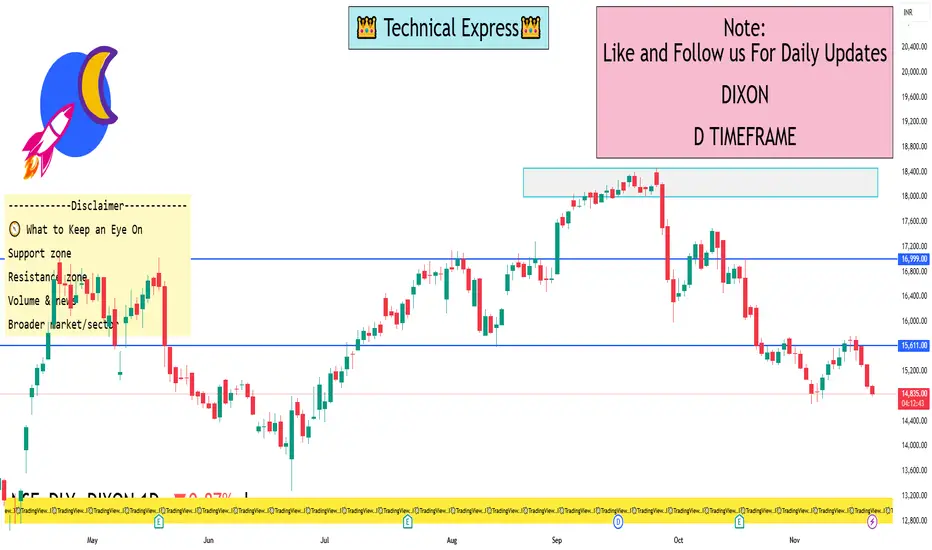
DIXON 1 Day Time Frame 🔍 Price & Pivot Levels to Watch
1. Latest live price: ~ ₹14,825 (as of intraday in India) from Groww.
2. Pivot levels (classic) for the day (based on Moneycontrol data):
Pivot ~ ₹15,065
S1 ~ ₹14,820
R1 ~ ₹15,209
3. Key moving-average resistances:
50-day SMA ~ ₹15,578 (price is below)
200-day SMA ~ ~₹15,738 – ~₹15,789 range (price is well below).
🧭 What to Keep an Eye On
Support zone: Near the S1 pivot (~₹14,820) and possibly the intra-day low zone (~₹14,700-14,800)
Resistance zone: The pivot (~₹15,065) and then R1 (~₹15,209) and the nearby moving averages (~₹15,500-15,600)
Volume & news: A sharp uptick in volume or a positive corporate/catalyst event could change the short-term dynamic.
Broader market/sector: Since Dixon is in electronics manufacturing, macro sentiment, export incentives, and input cost changes matter.
TATAPOWER
Consumption Trends Unveiled1. Digital-First Consumer Behavior
One of the most significant modern trends is the shift toward digital-first consumption. With widespread internet accessibility and smartphone use, consumers increasingly prefer online channels for shopping, content consumption, financial transactions, and communication.
E-commerce has become a dominant retail model. Consumers now expect convenience, instant access to products, and seamless delivery systems. Online marketplaces are expanding rapidly due to personalized recommendations, competitive pricing, and wider product varieties. Additionally, social commerce—shopping directly through social media platforms—is gaining momentum, especially among younger generations who trust peer reviews and influencer endorsements.
Beyond retail, digital consumption includes streaming platforms for entertainment, digital banking, telemedicine, and online education. Every sector is witnessing a digital transformation as consumers adopt technology for efficiency, comfort, and lower costs.
2. Personalization and Customization
Modern consumers crave personalization. They want experiences, products, and services tailored specifically to their preferences. This trend is driven by AI-powered recommendation engines, data-driven marketing, and a deeper understanding of customer behavior.
Companies are using analytics to segment consumers based on browsing patterns, purchase history, lifestyle choices, and social media behavior. Personalized subscription boxes, curated shopping experiences, customized nutrition plans, and smart home devices that learn user habits are prime examples.
Moreover, consumers are increasingly involved in the creation process. Brands that offer customizable options—such as personalized shoes, tailored skincare, or adjustable meal plans—gain a competitive edge. Personalization not only enhances customer satisfaction but also builds strong brand loyalty.
3. Sustainability and Conscious Consumption
Environmental awareness is reshaping global consumption patterns. Today’s consumers, particularly Millennials and Gen Z, are more conscious of climate change, resource scarcity, and environmental impact. This has led to the rise of eco-friendly products, sustainable packaging, and ethical manufacturing.
Consumers prefer brands that adopt green practices, source responsibly, and maintain transparency in their supply chains. The shift toward plant-based foods, renewable energy products, slow fashion, and biodegradable items reflects this growing eco-conscious mindset.
Secondhand marketplaces, recycling initiatives, and circular economy models (where products are reused, refurbished, or recycled) are also becoming mainstream. As sustainability influences purchasing decisions, companies must adapt to remain relevant and trustworthy.
4. Health, Wellness, and Holistic Living
Health and wellness have evolved from niche trends to global consumption drivers. Consumers increasingly prioritize physical fitness, mental well-being, and preventive healthcare. This shift accelerated due to the pandemic, which heightened awareness of health risks.
Demand for nutrition-rich foods, organic products, immunity-boosting supplements, and wellness services has surged. Fitness apps, wearable devices, and virtual workout platforms have gained popularity due to convenience and personalization.
Mental health has also emerged as a key focus, with consumers seeking mindfulness apps, relaxation products, therapy services, and work-life balance solutions. The wellness economy has expanded to include sleep technology, ergonomic home products, and wellness tourism.
5. Experience-Driven Consumption
Another major trend is the shift from product ownership to experience-driven consumption. Consumers now value memorable experiences—travel, entertainment, dining, adventure, and cultural activities—over material possessions.
The “experience economy” is thriving:
Travel and tourism industries focus on curated, immersive experiences.
Restaurants emphasize unique concepts and ambiance.
Events, festivals, and pop-up activities attract large audiences.
Virtual reality and augmented reality are creating new entertainment formats.
Younger consumers especially prioritize experiences that reflect self-expression and social identity. Sharing experiences online amplifies this trend, as people seek activities that are “social media worthy.”
6. Rise of Subscription-Based Models
Subscription services have grown exponentially across various industries. Consumers prefer ongoing access over one-time purchases because subscriptions offer convenience, value, and regular upgrades.
Popular examples include:
Streaming platforms like Netflix and Spotify
Subscription boxes for beauty, fashion, and fitness
Cloud storage and software services
Meal kits and grocery subscriptions
Auto-subscription for household essentials
Businesses benefit from predictable revenue streams, while consumers enjoy flexibility, personalization, and frequent content or product updates.
7. Other Emerging Trends
The Sharing Economy
Consumers increasingly participate in shared consumption models, such as ride-sharing, coworking spaces, community rentals, and shared mobility solutions. This trend reduces ownership costs and supports sustainability.
Localism and Hyper-Localization
Many consumers prefer locally produced goods due to their freshness, authenticity, and community support. Pandemic-driven supply chain disruptions accelerated this trend.
Financial Consciousness
Economic uncertainty has made consumers more value-driven. They seek discounts, compare prices across platforms, and prioritize financial planning tools. Buy Now Pay Later (BNPL) services, digital wallets, and micro-investing platforms are growing.
8. Drivers Behind Changing Consumption Patterns
Several key forces are influencing modern consumption trends:
Technological Advancements
AI, machine learning, IoT, and big data have transformed how businesses understand and target consumers.
Demographic Shifts
A younger, tech-savvy generation is reshaping consumption priorities, while aging populations create demand for healthcare services and age-friendly products.
Globalization
Consumers have access to global brands, ideas, and experiences, leading to diverse preferences.
Socioeconomic Changes
Rising incomes in developing nations and middle-class expansion influence spending power and lifestyle aspirations.
Cultural Evolution
Social media, global trends, and peer influence redefine consumption norms and expectations.
9. Implications for Businesses and Markets
Understanding consumption trends is critical for companies to stay competitive. Businesses must:
Adopt digital-first strategies
Enhance personalization efforts
Focus on sustainability
Innovate new customer experiences
Strengthen e-commerce capabilities
Build trust through transparency
Offer flexible subscription or hybrid models
Companies that fail to recognize these changes risk losing relevance in an economy driven by dynamic consumer expectations.
Conclusion
Consumption trends today are shaped by a combination of technology, demographics, values, and global economic shifts. As consumers evolve, businesses must rethink their strategies, products, and services to meet emerging demands. The future will belong to organizations that understand their customers deeply, innovate continuously, and prioritize sustainability, personalization, and digital transformation.
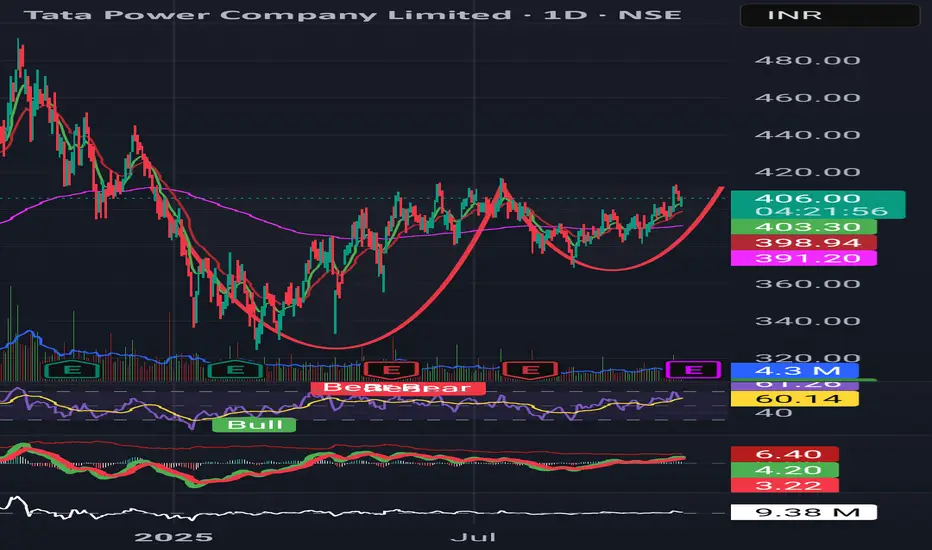
Tata Power (CMP ₹404.9)Pattern: Cup and Handle nearing breakout.
Structure: Handle formation visible near ₹400–₹410 zone; consolidation on low volume.
Indicators:
RSI at 59, gradually rising.
MACD turning positive with histogram expansion.
Trade Plan:
📈 Buy above: ₹416
🛑 Stoploss: ₹410
🎯 Targets: ₹440 / ₹459
View: Breakout potential high; confirmation needed above ₹416 with strong close.
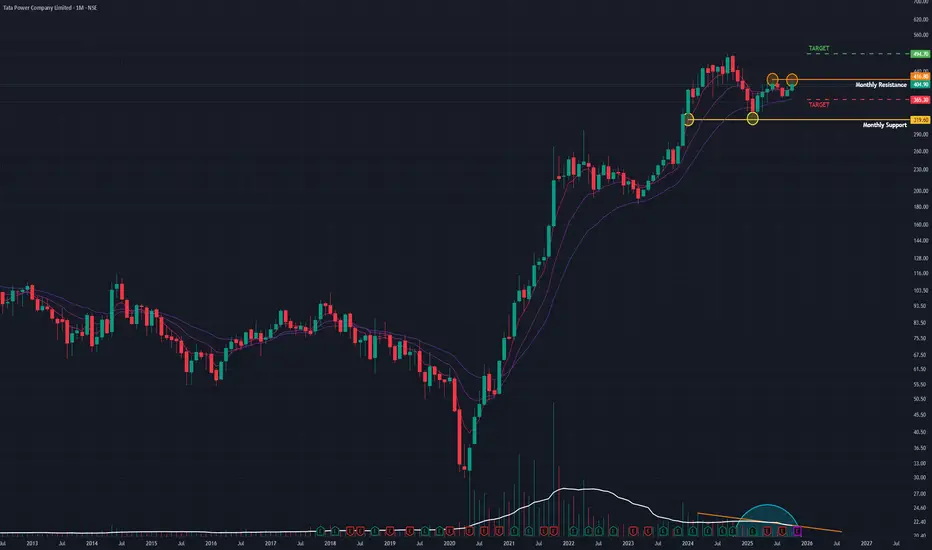
Tata Power (M): Coiling Spring Ready for an ATH Breakout?Tata Power is displaying a classic and very clean technical setup. After its parabolic run to an All-Time High (ATH) in September 2024 (around ₹490 ), the stock has entered a healthy, multi-month sideways consolidation. This is a bullish "coiling spring" or "accumulation" pattern.
📊 The Technicals
1. The Range (The "Box"):
The battle lines are clearly drawn.
- Resistance: A strong horizontal supply zone at the ATH, around ₹405 - ₹415 .
- Support: A firm demand zone and the bottom of the range at ₹365 .
2. Volume is Key:
The most bullish signal here is the volume contraction . Throughout this sideways "box," the volume has been drying up. This indicates that sellers are becoming scarce, and the stock is being absorbed by buyers in preparation for the next move.
3. Momentum Indicators:
- EMAs: Short-term EMAs are in a "PCO" (Price Crossover) state, showing bullish momentum.
- RSI: The RSI is rising, indicating that buying strength is building up under the surface.
4. Recent Price Action:
The surge in October (+4.18% on high volume) was an attempt to break this resistance. It failed, which confirms that the ₹415 level is a formidable barrier that will require significant volume to overcome.
🎯 The Scenarios
This is a "wait and watch" setup where we let the price tell us what to do next.
- 🐂 THE BULLISH CASE (Trigger)
I am watching for a decisive daily close above the ₹415 resistance level . This must be accompanied by a high-volume spike (higher than the October attempt) to confirm that the supply has finally been absorbed.
- Target 1: ₹490 .
- Next Target: Price discovery.
- 🐻 THE BEARISH CASE (Invalidation)
If the stock fails to break out and instead breaks down with conviction, the setup is invalidated.
- Trigger: A daily close below the ₹365 support level .
- Target: A deeper correction.
Conclusion:
The indicators and volume profile suggest a bullish resolution. The stock is coiling, and the pressure is building. The smart money is waiting for the high-volume breakout above ₹415 for confirmation.
Part 2 Candle Stick PatternParticipants in Options Trading
Options markets consist of four main participants:
Buyers of Calls – Expect the underlying asset’s price to rise. Risk limited to premium.
Buyers of Puts – Expect the underlying asset’s price to fall. Risk limited to premium.
Sellers (Writers) of Calls – Expect prices to remain below the strike price. Risk is theoretically unlimited for naked calls.
Sellers (Writers) of Puts – Expect prices to remain above the strike price. Risk is substantial if the asset falls sharply.
Options Strategies
Option trading is highly versatile. Traders can employ strategies ranging from conservative hedging to speculative bets:
Covered Call: Holding the underlying asset while selling call options to generate income from premiums.
Protective Put: Buying puts while holding the asset to protect against downside risk.
Straddle: Buying a call and a put with the same strike price and expiration, expecting high volatility.
Strangle: Buying out-of-the-money call and put options for lower cost but with a wider price movement range.
Spreads: Combining multiple options to limit risk and potential profit (e.g., bull call spread, bear put spread).
Option Pricing Factors
Option prices are influenced by several variables:
Underlying Asset Price: Higher asset prices increase call values and decrease put values.
Strike Price: The proximity of the strike to the current asset price affects intrinsic value.
Time to Expiration: More time increases time value and option price.
Volatility: Greater market volatility increases the likelihood of significant price changes, raising premiums.
Interest Rates & Dividends: Rising interest rates increase call values and reduce put values; dividend payouts impact stock options.
The most widely used pricing model is the Black-Scholes Model, which calculates theoretical option prices based on these factors.
Advantages of Option Trading
Leverage: Control a larger position with a smaller capital outlay.
Hedging: Protect portfolios against adverse price movements.
Flexibility: Execute a wide range of strategies for bullish, bearish, or neutral markets.
Defined Risk: Maximum loss for buyers is limited to the premium paid.
Profit in Any Market: Options allow for profit in rising, falling, or sideways markets.
Risks of Option Trading
Options are complex and involve risks:
Premium Loss: Buyers can lose the entire premium if the option expires worthless.
Leverage Risk: While leverage amplifies gains, it also amplifies losses for sellers or advanced strategies.
Time Decay (Theta): Options lose value as expiration nears if the underlying price does not move favorably.
Volatility Risk (Vega): Changes in market volatility affect option prices.
Complexity: Advanced strategies can involve multiple positions and require careful monitoring.

SBIN 1D Time frame🔢 Current Level
Trading around ₹823.65
🔑 Key Resistance & Support Levels
Resistance Zones:
₹825.00 – ₹830.00 (recent highs; breakout above this may lead to further upside)
₹835.00 – ₹840.00 (stronger resistance above)
Support Zones:
₹815.00 – ₹820.00 (immediate support; failure to hold above this may lead to a decline)
₹810.00 – ₹815.00 (short-term support; a break below this could indicate weakness)
₹800.00 – ₹805.00 (deeper support zone if price dips further)
📉 Outlook
Bullish Scenario: If SBIN holds above ₹820.00, upward momentum may continue. Break above ₹830.00 can open the way toward ₹840.00+.
Bearish Scenario: If it falls below ₹800.00, risk increases toward ₹790.00 – ₹795.00.
Neutral / Range: Between ₹820.00 – ₹830.00, SBIN may consolidate before a directional move.

Physiology of Trading in the AI Era1. Human Physiology and Trading: The Foundations
1.1 Stress and the Fight-or-Flight Response
When humans trade, they are not just using rational logic; they are also battling their physiological responses. Every trade triggers an emotional and bodily reaction. For example:
Adrenaline release when markets move rapidly in one’s favor or against them.
Increased heart rate and blood pressure during volatile sessions.
Sweating palms and muscle tension as risk builds.
This “fight-or-flight” response, mediated by the sympathetic nervous system, has been part of human survival for millennia. In trading, however, it can impair rational decision-making. A surge of cortisol (the stress hormone) may lead to panic selling, hesitation, or impulsive buying.
1.2 Dopamine and Reward Pathways
Trading can be addictive. Each win activates dopamine in the brain’s reward circuitry, similar to gambling or gaming. Traders often “chase” that feeling, even when logic dictates restraint. Losses, on the other hand, trigger stress chemicals, leading to cycles of overtrading, revenge trading, or withdrawal.
1.3 Cognitive Load and Fatigue
Traditional trading involves constant information processing—charts, news, market data, risk assessments. This consumes enormous cognitive energy. Long sessions can lead to decision fatigue, reducing accuracy and discipline.
Thus, before AI, trading was fundamentally a battle of human physiology against the demands of complex markets.
2. The AI Disruption in Trading
2.1 Rise of Algorithmic and High-Frequency Trading (HFT)
AI-driven systems can execute thousands of trades per second, scan global markets, detect patterns invisible to humans, and adjust strategies in real-time. These machines do not suffer from fear, greed, or fatigue.
For human physiology, this means:
Reduced direct execution stress (since machines handle it).
Increased monitoring stress (humans must supervise systems).
Psychological dislocation (traders may feel less control).
2.2 Machine Learning in Decision Support
AI models analyze sentiment from social media, evaluate economic indicators, and forecast price moves. Instead of staring at multiple screens, traders increasingly interpret AI dashboards and signals. This shifts the physiological strain from reaction-based stress to interpretation-based stress.
2.3 Automation and Human Role Redefinition
In the AI era, humans are less about execution and more about strategy, oversight, and risk management. Physiology adapts to:
Lower manual workload.
Higher demand for sustained attention.
Possible under-stimulation leading to boredom and disengagement.
3. Physiological Challenges of Trading with AI
3.1 Stress of Oversight
Even though AI reduces execution stress, it creates new types of anxiety:
“What if the algorithm fails?”
“What if there is a flash crash?”
“What if my model is outdated?”
This “meta-stress” is often harder to manage because the trader is not directly in control. Cortisol levels may remain high over long periods, contributing to chronic stress.
3.2 Cognitive Overload from Complexity
AI outputs are highly complex—probability charts, heatmaps, predictive models. Interpreting them requires intense concentration, taxing the prefrontal cortex (responsible for logic and planning). Prolonged exposure leads to cognitive fatigue, headaches, and reduced analytical clarity.
3.3 Screen Time and Physical Health
AI-based trading often demands sitting for long hours in front of multiple screens. This leads to:
Eye strain (computer vision syndrome).
Poor posture and musculoskeletal stress.
Reduced physical activity, increasing long-term health risks.
3.4 Emotional Detachment vs Overreliance
Some traders experience emotional detachment because AI reduces the “thrill” of trading. Others, however, become overly reliant, experiencing anxiety when AI signals conflict with personal judgment. Both conditions alter physiological balance—either numbing dopamine pathways or overstimulating stress responses.
4. Positive Physiological Impacts of AI in Trading
4.1 Reduced Acute Stress
Since AI handles rapid execution, traders are spared the intense “fight-or-flight” responses of old floor trading. Heart rate variability (HRV) studies show that algorithmic traders often experience lower peak stress events compared to manual traders.
4.2 Better Sleep and Recovery (Potentially)
If managed well, AI systems allow for reduced night sessions and improved rest. However, this is true only when traders trust their systems.
4.3 Cognitive Augmentation
By filtering noise and providing data-driven insights, AI reduces raw information overload. Traders can focus on strategic thinking, which may be less physiologically taxing than high-speed execution.
5. Neurophysiology of Human-AI Interaction
5.1 Brain Plasticity and Adaptation
Just as the brain adapted to calculators and computers, it is adapting to AI in trading. Neural pathways reorganize to prioritize pattern recognition, probabilistic thinking, and machine-interpretation skills.
5.2 The Stress of Uncertainty
The human brain dislikes uncertainty. AI, by nature, operates probabilistically (e.g., “there is a 70% chance of price rise”). This constant probabilistic feedback keeps traders in a state of anticipatory stress, leading to sustained low-level cortisol release.
5.3 Trust and the Oxytocin Factor
Neuroscience shows that trust is mediated by oxytocin. When traders trust their AI systems, oxytocin reduces stress. But if trust breaks (due to errors or losses), physiological stress spikes significantly higher than in traditional trading.
6. The Future of Trading Physiology in the AI Era
6.1 Neural Interfaces and Brain-Computer Trading
As AI advances, direct brain-computer interfaces may allow traders to interact without keyboards or screens. This will blur the line between human physiology and machine execution.
6.2 AI as Physiological Regulator
AI could not only trade but also monitor the trader’s physiological state—detecting stress, suggesting breaks, or even auto-reducing risk exposure when cortisol levels spike.
6.3 From Physiology to Philosophy
Ultimately, the AI era forces us to ask: What is the role of human physiology in a world where machines outperform us? Perhaps the answer lies not in competing, but in complementing—using uniquely human traits while allowing AI to handle mechanical execution.
Conclusion
The physiology of trading in the AI era is a fascinating intersection of biology and technology. Human bodies, wired for survival in primal environments, now face markets dominated by machines that never fatigue or feel fear. While AI reduces some physiological burdens—like execution stress—it introduces new forms of stress, such as oversight anxiety, cognitive overload, and emotional detachment.
The challenge for modern traders is not to resist AI but to manage their physiology in harmony with it. By using mindfulness, ergonomic design, physical health practices, and new neuro-adaptive tools, traders can maintain resilience.
In the long run, the physiology of trading will evolve. The human brain adapts, neural pathways shift, and AI itself may become an ally in regulating our stress. Trading in the AI era is no longer just about markets—it is about the integration of human physiology with machine intelligence.
Part 4 Learn Institutional Trading Option Greeks (Risk Measures)
Greeks are mathematical tools that measure how sensitive an option is to different factors:
Delta: Sensitivity to price change. (How much option moves if stock moves ₹1).
Gamma: Rate of change of delta.
Theta: Time decay (how much option loses value as expiry nears).
Vega: Sensitivity to volatility.
Rho: Sensitivity to interest rates.
Traders use Greeks to build precise strategies.
Option Strategies
Options can be combined into powerful strategies:
Single-leg: Buy call, Buy put, Sell call, Sell put.
Spreads: Bull call spread, Bear put spread.
Neutral strategies: Iron condor, Butterfly spread, Straddle, Strangle.
Advanced: Calendar spread, Ratio spread.
Each strategy suits different market conditions (bullish, bearish, sideways, volatile).

Intraday vs Swing Trading1. Understanding Intraday Trading
Definition
Intraday trading means entering and exiting positions within the same trading day. A trader does not hold any position overnight to avoid overnight risks such as news announcements, earnings reports, or global market volatility.
Characteristics of Intraday Trading
Short Holding Period: Minutes to hours, always squared-off before market close.
High Frequency: Multiple trades per day depending on opportunities.
Focus on Liquidity: Traders choose highly liquid stocks or instruments.
Leverage Usage: Intraday traders often use margin to amplify profits.
Technical Analysis Driven: Relies heavily on charts, price action, and indicators.
Goals of Intraday Traders
Capture small price movements (scalping 0.5–2% moves).
Consistent daily profits rather than waiting for big gains.
Quick decision-making, discipline, and risk management.
2. Understanding Swing Trading
Definition
Swing trading refers to holding positions for a few days to weeks, aiming to capture medium-term price swings. Traders ride upward or downward trends without reacting to every tick.
Characteristics of Swing Trading
Longer Holding Period: From 2–3 days up to several weeks.
Lower Frequency: Fewer trades, but larger profit targets.
Combination of Technical & Fundamental Analysis: Uses chart patterns, moving averages, and sometimes earnings or macroeconomic events.
Tolerance for Overnight Risk: Accepts gaps due to news or global events.
Less Screen Time: Traders analyze at the end of the day and monitor broadly.
Goals of Swing Traders
Catch larger moves (5–20% swings).
Trade with the trend, not intraday noise.
Balance between active trading and long-term investing.
3. Key Differences Between Intraday and Swing Trading
Aspect Intraday Trading Swing Trading
Holding Period Minutes to hours, closed same day Days to weeks
Frequency Many trades daily Few trades monthly
Capital Requirement Lower due to leverage Higher, requires holding without leverage
Risk Level Very high (market noise, leverage) Moderate (overnight risk, but less noise)
Profit Target Small per trade (0.5–2%) Larger per trade (5–20%)
Tools Intraday charts (1-min, 5-min, 15-min) Daily/weekly charts
Time Commitment Full-time, glued to screen Part-time, end-of-day monitoring
Stress Level High, fast decisions needed Lower, patience-based
Best for Aggressive, disciplined traders Patient, trend-following traders
4. Tools & Techniques
Tools for Intraday Trading
Short-term Charts – 1-min, 5-min, 15-min candles.
Indicators – VWAP, RSI, MACD, Bollinger Bands.
Order Types – Market orders, stop-loss, bracket orders.
News Feeds – Corporate announcements, economic data.
Scanners – For identifying stocks with volume and volatility.
Tools for Swing Trading
Daily/Weekly Charts – Identify broader trends.
Indicators – Moving averages (50, 200), RSI, Fibonacci retracement.
Patterns – Head & shoulders, flags, double tops/bottoms.
Fundamentals – Earnings reports, sector trends.
Portfolio Management – Diversification across sectors.
5. Risk & Reward
Intraday Trading Risks
Sudden intraday volatility.
High leverage leading to amplified losses.
Emotional stress leading to overtrading.
Market manipulation in low-volume stocks.
Swing Trading Risks
Overnight gaps due to news or events.
Holding during earnings or geopolitical announcements.
Misjudging long-term trend direction.
Reward Potential
Intraday: Small but frequent gains.
Swing: Fewer but larger gains.
6. Psychology Behind Each Style
Intraday Trader Psychology
Must be quick, disciplined, unemotional.
Can’t afford hesitation; seconds matter.
Needs mental stamina for long hours.
Swing Trader Psychology
Requires patience and conviction in the analysis.
Should handle overnight anxiety calmly.
Avoids micromanaging every tick.
7. Which Style Suits You?
Intraday Trading Suits If:
You can dedicate 6–7 hours daily.
You thrive in fast decision-making.
You handle stress well.
You prefer quick profits.
Swing Trading Suits If:
You have a job or business, can’t sit full-time.
You are patient and prefer analyzing trends.
You’re comfortable holding overnight risk.
You seek balanced trading with less stress.
8. Real-World Example
Imagine Stock XYZ at ₹1000:
Intraday Trader: Buys at ₹1000, sells at ₹1010 same day, booking 1% profit. May repeat 5–10 trades.
Swing Trader: Buys at ₹1000, holds for a week till ₹1150, booking 15% profit. Only 1 trade, but larger reward.
9. Pros & Cons
Pros of Intraday Trading
Quick returns.
Leverage available.
Daily learning experience.
No overnight risk.
Cons of Intraday Trading
Extremely stressful.
High brokerage costs.
Demands full-time attention.
High failure rate for beginners.
Pros of Swing Trading
Less screen time.
Larger profits per trade.
Flexibility to combine with job.
Trend-friendly.
Cons of Swing Trading
Overnight risk.
Requires patience.
Slow capital turnover.
Emotional swings if market gaps down.
10. Conclusion
Intraday and swing trading are two distinct paths to profit from markets. Neither is inherently better — it depends on one’s personality, risk appetite, and lifestyle.
If you thrive in fast-paced environments, can manage stress, and want quick daily profits, intraday trading is suitable.
If you prefer patience, less stress, and bigger swings, and don’t want to monitor markets constantly, swing trading is more fitting.
Ultimately, the best traders often experiment with both, learn their strengths, and settle into the style that complements their psychology. Success depends not just on the strategy, but on discipline, money management, and continuous learning.
Part 10 Trading Masterclass With ExpertsTypes of Options
There are two fundamental types of options:
(a) Call Option
A call option gives the buyer the right to buy the underlying asset at a fixed strike price before or on expiration.
Buyers of calls expect the price to rise.
Sellers of calls expect the price to stay flat or fall.
Example:
Suppose you buy a call option on TCS with a strike price of ₹3,500, expiring in one month. If TCS rises to ₹3,800, you can exercise the option and buy at ₹3,500, making a profit. If TCS stays below ₹3,500, you lose only the premium.
(b) Put Option
A put option gives the buyer the right to sell the underlying asset at the strike price before or on expiration.
Buyers of puts expect the price to fall.
Sellers of puts expect the price to rise or stay stable.
Example:
You buy a put option on Infosys with a strike of ₹1,500. If Infosys drops to ₹1,200, you can sell at ₹1,500 and earn profit. If Infosys stays above ₹1,500, you lose only the premium.
The Four Basic Positions
Every option trade can be boiled down to four core positions:
Long Call – Buying a call (bullish).
Short Call – Selling a call (bearish/neutral).
Long Put – Buying a put (bearish).
Short Put – Selling a put (bullish/neutral).
All advanced strategies are combinations of these four.

Part 7 Trading Masterclass With ExpertsOptions Greeks and Their Role
Every strategy depends heavily on the Greeks:
Delta: Sensitivity to price changes.
Gamma: Rate of change of delta.
Theta: Time decay of option value.
Vega: Sensitivity to volatility.
Rho: Sensitivity to interest rate changes.
Traders use Greeks to fine-tune strategies and manage risk exposure.
Risk Management in Options
Risk control is crucial. Key principles:
Never risk more than you can afford to lose.
Use spreads instead of naked options.
Monitor Greeks daily.
Diversify across strikes and expiries.
Set stop-loss and exit plans.

Part 3 Institutional Trading Popular Basic Strategies
(a) Covered Call
Buy the underlying stock and sell a call option.
Used to earn extra income if you already own shares.
Risk: Stock price falls.
Reward: Premium + limited upside.
(b) Protective Put
Buy stock and simultaneously buy a put option.
Acts like insurance — protects against downside risk.
Example: If you own TCS stock at ₹3500, buy a 3400 put.
Risk: Premium paid.
Reward: Unlimited upside with limited downside.
(c) Long Call
Buy a call option expecting the price to rise.
Limited risk (premium paid), unlimited reward.
Example: Buy Nifty 20,000 CE at 100 premium.
(d) Long Put
Buy a put option expecting a fall in price.
Limited risk (premium), large profit potential in downturns.

Premier Energies Ltd 1 Day ViewIntraday Price Snapshot
As of the latest update, the stock is trading at approximately ₹1,011.90, reflecting an up move of around 0.07% over the previous close
Another source confirms a similar performance: a rise of ~0.73% in the past 24 hours, placing the price near ₹1,011.20
Daily Price Range & Volume
The Day’s High reached ₹1,019.00, while the Day’s Low dipped to ₹981.30
Trading volume for the day stood around 1.43 million shares
What This Means for You
The stock experienced modest intraday movement, staying within a relatively narrow band. This suggests a period of consolidation combined with limited market-driven volatility.
If you're monitoring technical indicators (like intraday support/resistance or moving averages), reviewing detailed intraday charts on platforms such as NSE, TradingView, or Moneycontrol can help—these platforms offer minute-by-minute price action, volume bars, and technical overlays.
Let me know if you’d like to compare this intraday performance with other intervals—like 1 week or 1 month—or if you’d like to analyze technical indicators like RSI, MACD, or intraday moving averages!

GIFT Nifty & Global Market LinkageIntroduction
The Indian stock market has undergone a remarkable transformation in the past two decades. From being a largely domestic-focused equity market, India has steadily moved into the global financial arena. A very important step in this journey was the creation of GIFT City (Gujarat International Finance Tec-City) and the launch of GIFT Nifty, which has become India’s bridge to global markets.
GIFT Nifty is not just a derivative product; it is a symbolic step that integrates India’s financial markets more closely with global capital flows. At the same time, it creates a transparent and efficient platform for international investors to participate in India’s growth story.
But to fully understand its importance, one needs to see how GIFT Nifty is linked to global markets. Markets today are interconnected like never before—movements in Wall Street, European bourses, or Asian markets ripple across Indian indices. GIFT Nifty acts as a mirror and predictor of India’s domestic market sentiment while being shaped by international factors such as U.S. Fed policy, global interest rates, oil prices, and geopolitical risks.
This detailed explanation will cover:
What is GIFT Nifty?
The journey from SGX Nifty to GIFT Nifty.
The significance of GIFT City as India’s international financial hub.
GIFT Nifty’s role in India’s global financial integration.
Global market linkages – how global events influence GIFT Nifty.
Correlations with U.S., Europe, and Asia-Pacific markets.
Opportunities and challenges ahead.
The future of GIFT Nifty in shaping India’s financial markets.
1. What is GIFT Nifty?
GIFT Nifty is a derivative contract (futures and options) based on the Nifty 50 index, but traded on the NSE International Exchange (NSE IX) located in GIFT City, Gujarat.
It allows foreign investors to participate in India’s benchmark index without going through complex registration processes like FPI (Foreign Portfolio Investor) rules in the domestic market.
The contracts are USD-denominated, meaning global traders can easily buy and sell without worrying about INR conversion.
GIFT Nifty runs for almost 21 hours a day, covering Asian, European, and U.S. trading hours—making it one of the most globally accessible contracts linked to India.
In short, GIFT Nifty provides a real-time pulse of how global investors view India, almost around the clock.
2. From SGX Nifty to GIFT Nifty
Earlier, India’s Nifty futures were traded heavily on the Singapore Exchange (SGX), called SGX Nifty.
For nearly two decades, SGX Nifty was the main offshore gateway for international investors to take exposure to Indian equities.
Traders around the world would look at SGX Nifty quotes to predict the opening direction of the Indian stock market.
In fact, SGX Nifty became so popular that even Indian retail traders tracked it overnight to guess how the domestic Nifty would open.
However, in 2018, NSE and SGX had a legal tussle over licensing rights. Finally, in 2022, both parties agreed to shift all SGX Nifty contracts to GIFT City under a “Connect” model.
Now, SGX Nifty is history, and GIFT Nifty is the only official offshore Nifty derivative product. This transition brought trading volumes back under Indian jurisdiction, strengthening India’s position as a global financial hub.
3. GIFT City: India’s International Financial Hub
GIFT City is a special economic zone (SEZ) located in Gandhinagar, Gujarat. Its vision is to create a global financial and IT services hub on par with Singapore, Dubai, and London.
GIFT City offers tax incentives, world-class infrastructure, and a favorable regulatory environment.
The NSE International Exchange (NSE IX) operates here, hosting products like GIFT Nifty.
Banks, insurers, brokers, and global funds are setting up units in GIFT City to tap both Indian and global opportunities.
For India, GIFT City represents a strategic move: instead of foreign investors trading Indian products overseas, they now trade in India itself. This not only boosts financial flows but also gives regulators more oversight.
4. GIFT Nifty’s Role in Global Financial Integration
GIFT Nifty is more than just a futures contract—it symbolizes India’s growing integration with global markets.
Here’s how:
International Accessibility: Investors in New York, London, Hong Kong, or Dubai can trade GIFT Nifty almost anytime, making India’s equity market more globally visible.
Price Discovery: Since trading happens across time zones, GIFT Nifty reflects both global and domestic investor sentiment in near real time.
Hedging Tool: Foreign portfolio investors (FPIs) can hedge their India equity exposure more efficiently.
Liquidity & Volumes: Global participation in GIFT Nifty brings higher liquidity, tighter spreads, and deeper markets.
5. Global Market Linkages – How World Events Affect GIFT Nifty
The beauty (and complexity) of GIFT Nifty lies in its sensitivity to global developments. Because it trades almost continuously, it reacts instantly to global news.
Some of the most important global factors influencing GIFT Nifty are:
U.S. Federal Reserve Policy
Interest rate hikes or cuts in the U.S. directly impact global equity flows.
A hawkish Fed (raising rates) usually hurts risk assets like Indian equities.
GIFT Nifty futures often fall sharply after Fed announcements.
Global Economic Data
U.S. inflation, jobs data, GDP growth, and corporate earnings set the tone for global risk appetite.
Similarly, China’s growth numbers and Europe’s economic indicators affect global sentiment.
Oil Prices
India imports more than 80% of its crude oil needs. A rise in global oil prices usually weakens Indian equities.
GIFT Nifty reacts immediately to Brent crude movements.
Currency Fluctuations
A strong U.S. dollar and weak rupee reduce foreign investor returns.
GIFT Nifty often mirrors INR-USD volatility.
Geopolitical Risks
Wars, conflicts, sanctions, or supply-chain disruptions cause risk-off sentiment globally.
GIFT Nifty, like other emerging market indices, tends to fall under such conditions.
Global Equity Trends
If Wall Street has a strong rally, GIFT Nifty usually trades higher in the U.S. session.
If Asian markets crash early morning, GIFT Nifty shows weakness in the Asian session.
6. Correlation with Global Markets
Let us break down the interconnectedness between GIFT Nifty and major global markets.
a. Link with U.S. Markets (Wall Street)
The U.S. markets (Dow Jones, S&P 500, Nasdaq) are the most influential for GIFT Nifty.
After U.S. closing, GIFT Nifty in the U.S. time zone reacts sharply to tech earnings, Fed speeches, or macro data.
Example: If Nasdaq falls 2% overnight, GIFT Nifty usually opens lower in the Asian session.
b. Link with European Markets
During European hours, GIFT Nifty trades alongside FTSE (UK), DAX (Germany), and CAC (France).
Eurozone recession fears or ECB rate moves affect GIFT Nifty sentiment.
c. Link with Asian Markets
In the morning, GIFT Nifty trades in sync with Nikkei (Japan), Hang Seng (Hong Kong), and Shanghai Composite (China).
A sell-off in China often triggers weakness in GIFT Nifty.
Conversely, optimism in Asian markets boosts Indian sentiment.
7. Opportunities Created by GIFT Nifty
Better Price Discovery for India’s Market
Instead of relying on SGX Nifty, Indian markets now have their own offshore derivative hub.
Boost to GIFT City Ecosystem
Trading volumes, jobs, and financial services activity in GIFT City have surged.
Global Participation in India’s Growth
India is one of the fastest-growing economies. GIFT Nifty allows global funds to participate directly.
Hedging Benefits for FPIs
Foreign investors can protect themselves against Indian market volatility.
Strengthening Rupee’s Global Role
Even though contracts are in USD, India gains visibility as a financial center.
8. Challenges Ahead
Despite its success, GIFT Nifty faces challenges:
Liquidity Migration: Ensuring that volumes remain strong compared to global exchanges.
Awareness: Many global traders still see SGX Nifty as their reference, though it no longer exists.
Competition: Other financial hubs like Singapore and Dubai remain strong competitors.
Volatility Risk: High global interconnectedness means sudden shocks (like COVID-19 or geopolitical events) affect GIFT Nifty instantly.
9. The Future of GIFT Nifty
Looking forward, GIFT Nifty is set to become a cornerstone of India’s financial globalization.
Volumes are rising every month as more global institutions migrate to GIFT City.
New products (like GIFT Bank Nifty, sectoral derivatives, ETFs) may be introduced.
India’s inclusion in global bond and equity indices will further increase offshore demand.
Over the next decade, GIFT City could evolve into a mini-Singapore for Asia.
Conclusion
GIFT Nifty is more than just a trading contract—it is a symbol of India’s financial maturity. By shifting from SGX to GIFT City, India ensured that its financial products are traded on its own soil, strengthening sovereignty and transparency.
At the same time, GIFT Nifty remains deeply connected with global markets. Whether it’s the U.S. Fed, crude oil prices, China’s slowdown, or geopolitical tensions, GIFT Nifty reflects the pulse of global investor sentiment toward India in real time.
In a world where capital moves at the speed of light, GIFT Nifty serves as India’s window to the world and the world’s window to India. Its success will not only strengthen India’s equity markets but also position GIFT City as a major international financial hub in the decades to come.

Part 3 Trading Master ClassHow Options Work in Practice
Let’s take a real-life relatable scenario:
👉 Suppose you think Nifty (20,000) will rise in the next week.
You buy a Nifty Call Option 20,200 Strike at premium ₹100.
Lot size = 50, so total cost = ₹5,000.
Now:
If Nifty goes to 20,400 → Your option is worth ₹200 (profit ₹5,000).
If Nifty stays at 20,000 → Option expires worthless (loss = ₹5,000).
So, with only ₹5,000, you controlled exposure worth ₹10 lakhs. That’s leverage.
Participants in Options Market
There are four main categories of traders:
Call Buyer → Expects price to go UP.
Call Seller (Writer) → Expects price to stay flat or go DOWN.
Put Buyer → Expects price to go DOWN.
Put Seller (Writer) → Expects price to stay flat or go UP.

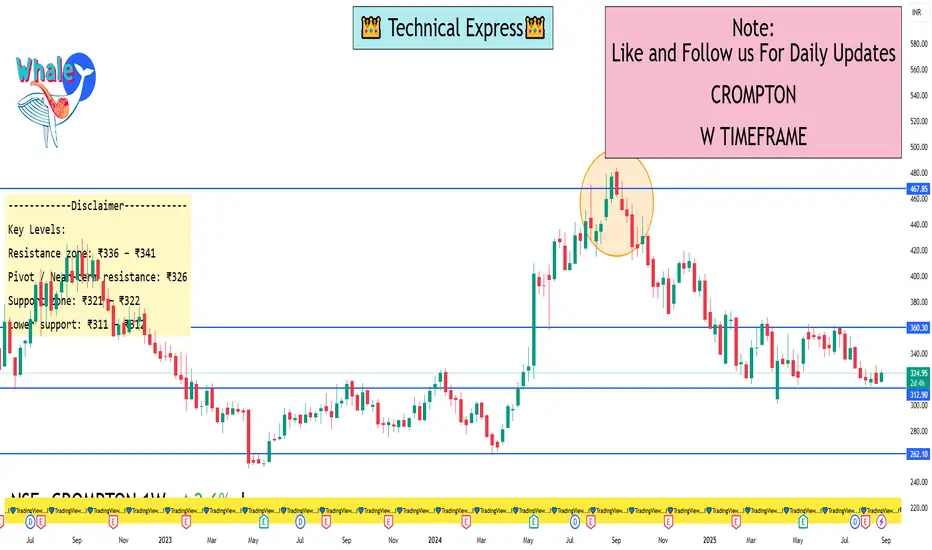
Crompton 1 Week ViewWeekly Levels
Immediate Support Zone: ₹325 – ₹330
Next Major Support: ₹305 – ₹310
Immediate Resistance Zone: ₹355 – ₹360
Major Resistance: ₹375 – ₹380
Observations
Price has been consolidating in a range roughly between ₹330 – ₹360 over recent weeks.
If the stock sustains above ₹360, momentum could push it toward ₹375–₹380.
On the downside, if ₹325 breaks, weakness may extend toward ₹305 levels.
Volumes are slightly picking up near supports, showing accumulation signs.
Bias
Neutral to mildly bullish as long as the stock holds above ₹330.
A breakout above ₹360 would strengthen bullish sentiment, while a breakdown below ₹325 may shift trend bearish.
Basics of Technical Analysis1. Philosophy Behind Technical Analysis
The foundation of technical analysis is based on three key assumptions:
a. Market Discounts Everything
This principle states that all known information—economic, political, and psychological—is already reflected in the current price of a security. Prices react immediately to news and events, so there is no need to analyze each piece of information individually. For example, if a company reports a better-than-expected quarterly result, its stock price will immediately adjust to reflect this news.
b. Prices Move in Trends
Technical analysts believe that prices follow trends, whether upward (bullish), downward (bearish), or sideways (consolidation). Recognizing these trends is crucial because “the trend is your friend.” Traders aim to align their trades with the prevailing trend rather than against it.
c. History Tends to Repeat Itself
Human psychology drives market behavior, and patterns of fear, greed, and optimism often repeat over time. Technical analysis relies on identifying these recurring patterns to predict potential price movements.
2. Core Components of Technical Analysis
Technical analysis consists of several tools and techniques. Understanding these fundamentals is essential for building an effective trading strategy.
a. Price Charts
Price charts are the most basic tool for technical analysts. They visually display the historical price movements of a security over time.
Line Chart: Shows a simple line connecting closing prices over time. Useful for spotting long-term trends.
Bar Chart: Displays open, high, low, and close (OHLC) for each period. Useful for analyzing volatility.
Candlestick Chart: Uses colored bars (candles) to indicate price movement. Highly popular due to its visual clarity and ability to display market sentiment.
Example of a Candlestick
Bullish Candle: Close is higher than open, indicating buying pressure.
Bearish Candle: Close is lower than open, showing selling pressure.
b. Support and Resistance
These are price levels where buying or selling pressure tends to prevent further movement.
Support: A level where demand exceeds supply, preventing the price from falling further.
Resistance: A level where supply exceeds demand, preventing the price from rising further.
Traders watch these levels to make entry and exit decisions. A breakout above resistance signals potential bullish momentum, while a breakdown below support indicates bearish momentum.
c. Trendlines and Channels
Trendlines connect price highs or lows to define the direction of the market. Channels are formed by drawing parallel lines above and below the trendline.
Uptrend: Higher highs and higher lows.
Downtrend: Lower highs and lower lows.
Sideways Trend: Prices fluctuate within a horizontal range.
Channels help traders identify potential reversal points or continuation of trends.
d. Technical Indicators
Indicators are mathematical calculations based on price, volume, or both. They help confirm trends, measure momentum, and identify potential reversals.
Popular Indicators:
Moving Averages: Smooth out price data to identify trends.
Simple Moving Average (SMA)
Exponential Moving Average (EMA)
Relative Strength Index (RSI): Measures the speed and change of price movements. Values above 70 indicate overbought conditions; below 30 indicate oversold.
MACD (Moving Average Convergence Divergence): Shows the relationship between two moving averages. Helps identify trend changes and momentum.
Bollinger Bands: Measure volatility by plotting upper and lower bands around a moving average. Prices touching the bands often signal potential reversals.
e. Volume Analysis
Volume indicates the number of shares or contracts traded in a given period. It confirms the strength of a trend:
Rising price with increasing volume → strong trend
Rising price with decreasing volume → weak trend, potential reversal
Falling price with increasing volume → strong bearish trend
Volume is often analyzed alongside price patterns to validate breakouts or breakdowns.
f. Chart Patterns
Chart patterns are formations created by price movements. They signal potential continuation or reversal of trends.
Common Patterns:
Head and Shoulders: Trend reversal pattern.
Double Top and Double Bottom: Indicate potential reversals.
Triangles (Ascending, Descending, Symmetrical): Represent consolidation before breakout.
Flags and Pennants: Short-term continuation patterns.
These patterns help traders predict the market’s next move based on historical price behavior.
g. Candlestick Patterns
Candlestick patterns provide insight into market sentiment over a short period.
Doji: Indicates indecision.
Hammer: Bullish reversal at the bottom of a downtrend.
Shooting Star: Bearish reversal at the top of an uptrend.
Engulfing Patterns: Strong reversal signals.
By combining candlestick patterns with support/resistance and indicators, traders enhance their decision-making accuracy.
3. Timeframes in Technical Analysis
Technical analysis can be applied across various timeframes:
Intraday: 1-minute, 5-minute, 15-minute charts.
Short-Term: Daily or weekly charts.
Long-Term: Monthly or yearly charts.
Traders choose timeframes based on their strategy:
Day Traders: Focus on intraday charts for quick trades.
Swing Traders: Use daily or weekly charts for holding positions for days or weeks.
Investors: Rely on long-term charts for position trades.
4. Combining Technical Tools
A single tool rarely provides a perfect trading signal. Successful technical analysis combines multiple tools:
Trend Identification: Determine if the market is trending or ranging.
Support/Resistance: Identify key price levels for entry or exit.
Indicators: Confirm momentum, strength, and potential reversals.
Volume Analysis: Validate the trend or breakout.
Patterns: Spot opportunities using chart or candlestick formations.
For example, a trader may buy a stock when the price breaks above a resistance level, the RSI is rising but not overbought, and the breakout is accompanied by high volume.
5. Risk Management in Technical Analysis
Even the best technical analysis cannot guarantee profits. Risk management ensures traders protect their capital.
Stop-Loss Orders: Automatically exit losing trades at a predetermined level.
Position Sizing: Adjust trade size according to risk tolerance.
Risk-Reward Ratio: Ensure potential reward is higher than potential risk (e.g., 2:1 ratio).
Diversification: Avoid concentrating all trades in one instrument or sector.
Proper risk management is critical for long-term trading success.
6. Psychological Aspect
Markets are influenced by human emotions—fear, greed, hope, and panic. Technical analysis helps traders remain objective:
Follow predefined rules for entry and exit.
Avoid trading based on emotions or news hype.
Stick to trend direction and signals.
Emotional discipline combined with technical tools improves consistency.
7. Limitations of Technical Analysis
While technical analysis is powerful, it has limitations:
No Fundamental Insight: Ignores company performance, earnings, and economic factors.
Subjectivity: Interpretation of charts and patterns can vary between analysts.
False Signals: Breakouts or reversals can fail.
Market Manipulation: Large participants can influence price temporarily.
Traders often combine technical and fundamental analysis to mitigate these limitations.
8. Practical Application: How to Start
Choose a Market: Stocks, commodities, Forex, or cryptocurrencies.
Pick a Charting Platform: TradingView, Zerodha Kite, MetaTrader, etc.
Learn Price Patterns and Indicators: Begin with support/resistance, trendlines, and moving averages.
Paper Trade: Practice without risking real money.
Develop a Strategy: Include entry/exit rules, stop-loss, and position sizing.
Analyze Performance: Keep a trading journal to track successes and failures.
9. Advanced Concepts
After mastering the basics, traders can explore:
Fibonacci Retracement: Identify potential reversal levels.
Elliott Wave Theory: Predict market cycles using waves.
Market Profile & Volume Profile: Advanced volume-based analysis.
Algorithmic Trading: Automated execution using technical indicators.
10. Summary
Technical analysis is a toolkit that allows traders to forecast market movements based on price and volume data. Its foundation lies in understanding trends, support/resistance, chart patterns, and indicators, combined with disciplined risk management and psychological control. While it does not guarantee success, a structured approach increases the probability of making profitable trades.
By consistently applying technical analysis, traders can:
Identify opportunities in trending and range-bound markets.
Time entries and exits effectively.
Minimize losses through disciplined risk management.
Improve confidence in trading decisions.

Part 3 Learn Institutional Trading Why Trade Options?
Options are popular for several reasons:
Leverage: You can control a large number of shares with a relatively small investment (premium).
Hedging: Protect your portfolio against downside risk using options as insurance.
Income Generation: Selling options can provide regular income (premium received).
Flexibility: Options allow you to profit from upward, downward, or sideways movements.
Risk Management: Losses can be limited to the premium paid.
Types of Options Strategies
Options strategies can be simple or complex, depending on the trader’s goal:
Basic Strategies
Long Call: Buy a call expecting the stock to rise.
Long Put: Buy a put expecting the stock to fall.
Covered Call: Hold the stock and sell a call to earn premium.
Protective Put: Buy a put to protect against downside risk on a stock you own.

Part 2 Ride The Big MovesDisadvantages of Options
Complexity for beginners
Time decay risk (premium can vanish)
Unlimited risk for sellers of uncovered options
Requires active monitoring for effective trading
Tips for Successful Options Trading
Understand the underlying asset thoroughly.
Start with basic strategies like long calls, puts, and covered calls.
Use proper risk management and position sizing.
Keep track of Greeks to understand sensitivity.
Avoid over-leveraging.
Monitor market volatility; high volatility can inflate premiums.
Use demo accounts or paper trading for practice.

Risk Management in Trading1. Introduction: Why Risk Management Matters
Trading in the stock market, forex, commodities, or crypto can be exciting. The charts move, opportunities appear every second, and profits can be made quickly. But at the same time, losses can also come just as fast. Many traders, especially beginners, enter the market thinking only about profits. They study chart patterns, indicators, or even copy trades from others. But what most ignore at the beginning is the one factor that separates successful traders from unsuccessful ones: Risk Management.
Risk management is not about how much profit you make; it’s about how well you protect your money when things go wrong. Trading is not about being right every time. Even the best traders in the world lose trades. What makes them profitable is that their losses are controlled and their winners are allowed to grow.
Without risk management, even the best strategy will eventually blow up your account. With risk management, even an average strategy can keep you in the game long enough to learn, improve, and grow your capital.
2. What is Risk Management in Trading?
Risk management in trading simply means the process of identifying, controlling, and minimizing the amount of money you could lose on each trade.
It’s not about avoiding risk completely (that’s impossible in trading). Instead, it’s about managing risk in such a way that:
No single trade can wipe out your account.
You survive long enough to take advantage of future opportunities.
You build consistency over time instead of gambling.
Think of trading like driving a car. Speed (profits) is fun, but brakes (risk management) keep you alive.
3. The Golden Rule of Trading: Protect Your Capital
The first rule of trading is simple: Don’t lose all your money.
If you lose 100% of your capital, you are out of the game forever.
Here’s the reality of losses:
If you lose 10% of your account, you need 11% profit to recover.
If you lose 50%, you need 100% profit to recover.
If you lose 90%, you need 900% profit to recover.
This shows how dangerous big losses are. The more you lose, the harder it becomes to get back to break-even. That’s why smart traders focus less on “How much profit can I make?” and more on “How much loss can I tolerate?”
4. Key Elements of Risk Management
Let’s go step by step through the major pillars of risk management in trading:
a) Position Sizing
This is about deciding how much money to risk in a single trade. A common rule is:
Never risk more than 1–2% of your account on one trade.
Example:
If your account size is ₹1,00,000 and you risk 1% per trade → maximum loss allowed = ₹1,000.
This way, even if you lose 10 trades in a row (which happens sometimes), you’ll still have 90% of your capital left.
b) Stop Loss
A stop loss is a price level where you accept that your trade idea is wrong and you exit automatically.
Without a stop loss, emotions take over. Traders hold losing trades, hoping they’ll turn profitable, but often the losses grow bigger.
Always set a stop loss before entering a trade.
Respect it. Don’t move it further away.
Example:
If you buy a stock at ₹500, you might set a stop loss at ₹480. If price drops to ₹480, your loss is controlled, and you live to trade another day.
c) Risk-to-Reward Ratio
Before entering any trade, ask yourself: Is the reward worth the risk?
If your stop loss is ₹100 away, your target should be at least ₹200 away. That’s a 1:2 risk-to-reward ratio.
Why is this important?
Because even if you win only 40% of your trades, you can still be profitable with a good risk-to-reward system.
Example:
Risk ₹1,000 per trade, aiming for ₹2,000 reward.
Out of 10 trades:
4 winners = ₹8,000 profit
6 losers = ₹6,000 loss
Net profit = ₹2,000
This shows you don’t need to win every trade. You just need to control losses and let winners run.
d) Diversification
Don’t put all your money in one stock, sector, or asset. Spread your risk.
If one trade goes bad, others can balance it.
Avoid overexposure in correlated assets (like buying 3 IT stocks at once).
e) Avoiding Over-Leverage
Leverage allows you to control big positions with small money. But leverage is a double-edged sword: it multiplies both profits and losses.
Beginners often blow accounts using high leverage. Rule of thumb:
Use leverage cautiously.
Never take a position so big that one wrong move wipes out your account.
5. Psychological Side of Risk Management
Risk management is not only about numbers; it’s also about mindset and discipline.
Greed makes traders risk too much for quick profits.
Fear makes them close trades too early or avoid good opportunities.
Revenge trading happens after a loss, when traders try to win it back immediately by increasing position size. This often leads to bigger losses.
Good risk management keeps emotions under control. When you know that your maximum loss is limited, you trade with a calm mind.
6. Practical Risk Management Techniques
Here are some practical tools and methods traders use:
Fixed % Risk Model – Always risk a fixed percentage (like 1% per trade).
Fixed Amount Risk Model – Always risk a fixed rupee amount (like ₹500 per trade).
Trailing Stop Loss – Adjusting stop loss as price moves in your favor, to lock in profits.
Daily Loss Limit – Stop trading for the day if you lose a set amount (say 3% of account). This prevents emotional overtrading.
Portfolio Heat – Total risk across all open trades should not exceed 5–6% of account.
7. Common Mistakes Traders Make in Risk Management
Not using stop losses.
Risking too much in one trade.
Moving stop losses further away to “give trade more room.”
Trading with borrowed money.
Doubling position after a loss (“martingale” strategy).
Ignoring position sizing.
These mistakes often lead to blown accounts.
8. Case Studies
Case 1: Trader Without Risk Management
Rahul has ₹1,00,000. He risks ₹20,000 in one trade (20% of account). If he loses 5 trades in a row, his account goes to zero. Game over.
Case 2: Trader With Risk Management
Anita has ₹1,00,000. She risks only 1% per trade (₹1,000). Even if she loses 10 trades in a row, she still has ₹90,000 left to keep trading and learning.
Who will survive longer? Anita.
And survival is the key in trading.
9. Risk Management Beyond Single Trades
Risk management is not only about one trade, but also about your whole trading career:
Set Monthly Risk Limits → e.g., stop trading if you lose 10% in a month.
Keep Emergency Funds → Never put all life savings into trading.
Withdraw Profits → Don’t leave all profits in the trading account. Take some out regularly.
Review Trades → Keep a trading journal to learn from mistakes.
10. The Connection Between Risk Management & Consistency
Consistency is what separates professionals from gamblers. Professional traders don’t look for a “big jackpot trade.” Instead, they look for consistent growth.
Risk management provides that consistency by:
Preventing big drawdowns.
Allowing small steady growth.
Giving confidence in the system.
Trading is like running a business. Risk management is your insurance policy. No business survives without managing costs and risks.
Final Thoughts
Risk management may not sound exciting compared to finding “hot stocks” or “sure-shot trades.” But in reality, it’s the most important part of trading.
Think of it this way:
Strategies may come and go.
Indicators may change.
Markets may behave differently.
But risk management principles stay the same.
The traders who last years in the market are not the ones who find secret formulas. They are the ones who respect risk.
If you master risk management, you can survive long enough to improve, adapt, and eventually succeed. Without it, no matter how smart or lucky you are, the market will take your money.
How to Read Price ActionIntroduction
Price Action (PA) is the art and science of reading market movement directly from price charts, without over-reliance on lagging indicators. Professional traders, institutional players, and prop firms often emphasize price action because it reflects the pure psychology of buyers and sellers.
Unlike trading based on technical indicators, price action trading relies on raw market data: candlesticks, support & resistance levels, chart structures, and volume context.
Learning to read price action is like learning a new language — once you master it, you can understand what the market is saying at any given moment.
Chapter 1: What is Price Action?
Price Action refers to analyzing the actual price movement of a financial instrument over time.
It does not depend on moving averages, oscillators, or complex indicators.
It studies patterns, trends, support/resistance zones, candlestick formations, and order flow behavior.
The ultimate goal is to understand the story behind each price move: who is in control (buyers or sellers), and where the next move might head.
Key Idea: Price action is the footprint of money. When large institutions buy or sell, they leave traces on the chart — PA traders learn to read these footprints.
Chapter 2: Why Read Price Action?
Clarity – It removes clutter from charts.
Universal Language – Works across all markets (stocks, forex, commodities, crypto).
Flexibility – Adapts to all timeframes, from scalping 1-min charts to investing on weekly charts.
Real-Time Decisions – Price action reacts instantly, unlike lagging indicators.
Psychology-Based – Helps traders understand market sentiment: fear, greed, indecision.
Chapter 3: Core Building Blocks of Price Action
Before diving into strategies, you need to master the foundations:
3.1 Candlesticks
Candlesticks are the backbone of price action. Each candle tells a story:
Open, High, Low, Close (OHLC) show how price moved within that time frame.
Long wicks = rejection.
Long body = strong momentum.
Small body = indecision.
3.2 Market Structure
Higher Highs & Higher Lows (HH, HL) = Uptrend.
Lower Highs & Lower Lows (LH, LL) = Downtrend.
Sideways movement = Consolidation.
3.3 Support and Resistance (S/R)
Support: A price level where buying pressure often appears.
Resistance: A price level where selling pressure often emerges.
These zones are not exact prices, but areas.
3.4 Trendlines & Channels
Connecting swing highs/lows creates visual guides.
Channels highlight when price is moving within a range.
3.5 Volume (Optional but Powerful)
Volume confirms price moves — high volume validates breakouts, while low volume signals weak trends.
Chapter 4: Candlestick Price Action Patterns
4.1 Reversal Patterns
Pin Bar (Hammer, Shooting Star): Signals rejection at support/resistance.
Engulfing Candle: Strong shift in momentum (bullish or bearish).
Morning Star / Evening Star: Trend reversal confirmation.
4.2 Continuation Patterns
Inside Bar: Market is pausing; breakout is likely.
Flag & Pennant: Small correction before continuation.
Marubozu: Strong conviction candle.
4.3 Indecision Patterns
Doji: Balance between buyers and sellers.
Spinning Top: Low conviction, sideways market.
Lesson: Candlestick patterns only matter in the right context (support, resistance, trend zones).
Chapter 5: Understanding Market Phases
Price moves in cycles:
Accumulation Phase: Smart money buys quietly, market moves sideways.
Markup Phase: Strong uptrend begins (higher highs & higher lows).
Distribution Phase: Smart money sells to late buyers, price moves sideways again.
Markdown Phase: Downtrend begins (lower highs & lower lows).
Price action traders learn to spot transitions between phases.
Chapter 6: Reading Trends
Uptrend: Look for buying opportunities on pullbacks.
Downtrend: Look for selling opportunities on retracements.
Range-bound: Focus on support/resistance rejections.
Golden Rule: Trade with the trend until price clearly shows reversal signs.
Chapter 7: Breakouts & Fakeouts
Breakout: Price moves beyond key support/resistance with momentum.
Fakeout (False Break): Price breaks a level but quickly reverses.
Pro Tip: Watch volume + candle close for real confirmation.
Chapter 8: Price Action Trading Strategies
Here are practical strategies traders use:
8.1 Breakout Trading
Identify consolidation → Wait for breakout → Enter with momentum.
Example: Range breakout, Triangle breakout.
8.2 Pullback Trading
Enter in the direction of trend after a retracement.
Example: Price bounces off support in uptrend.
8.3 Reversal Trading
Spot exhaustion patterns (Pin Bars, Engulfing) near major S/R zones.
Requires patience and confirmation.
8.4 Supply and Demand Zones
Supply = institutional sell zones.
Demand = institutional buy zones.
Price often reacts strongly when revisiting these levels.
Chapter 9: The Psychology Behind Price Action
Every candle reflects human psychology:
Long bullish candle: Strong buyer confidence.
Long bearish candle: Panic selling or strong bearish conviction.
Doji: Confusion / indecision.
Breakouts: Fear of missing out (FOMO) + herd mentality.
Price action is a visual representation of trader emotions.
Chapter 10: Common Mistakes in Reading Price Action
Overcomplicating the chart – Too many lines, patterns, or zones.
Ignoring market context – A bullish candle in a downtrend is weak.
Chasing trades – Entering late after breakout.
Forcing patterns – Seeing patterns that don’t exist.
Neglecting risk management – PA gives entries, but stops are crucial.
Conclusion
Reading price action is not about memorizing patterns, but understanding the story behind the charts. It’s about seeing the battle between buyers and sellers and aligning with the winning side.
Once you master candlesticks, support/resistance, trends, and psychology, price action becomes a powerful weapon that can work in any market, on any timeframe.
The path is long, but with discipline, patience, and practice, you can become fluent in the language of price action.
Part 4 Learn Institutional TradingIntermediate Option Strategies
Straddle – Buy Call + Buy Put (same strike/expiry). Best for high volatility.
Strangle – Buy OTM Call + Buy OTM Put. Cheaper than straddle.
Bull Call Spread – Buy lower strike call + Sell higher strike call.
Bear Put Spread – Buy higher strike put + Sell lower strike put.
Advanced Option Strategies
Iron Condor – Sell OTM call + OTM put, hedge with farther strikes. Good for sideways market.
Butterfly Spread – Combination of multiple calls/puts to profit from low volatility.
Calendar Spread – Buy long-term option, sell short-term option (same strike).
Ratio Spread – Sell multiple options against fewer long options.
Hedging with Options
Options aren’t just for speculation; they’re powerful hedging tools.
Portfolio Hedge: If you own a basket of stocks, buying index puts protects against a market crash.
Currency Hedge: Importers/exporters use currency options to lock exchange rates.
Commodity Hedge: Farmers hedge crops using options to lock minimum prices.

Indicators & Oscillators in Trading1. Introduction
In the world of financial markets, traders are constantly searching for ways to gain an edge. While fundamental analysis looks at company earnings, news, and economic trends, technical analysis focuses on price action, patterns, and market psychology.
At the core of technical analysis lie Indicators and Oscillators. These are mathematical calculations based on price, volume, or both, designed to give traders insights into the direction, momentum, strength, or volatility of a market.
In simple words, Indicators help you see the invisible — they take raw price data and transform it into something more structured, often plotted on a chart to highlight opportunities. Oscillators, on the other hand, are a special category of indicators that move within a fixed range (like 0 to 100), helping traders identify overbought and oversold conditions.
Understanding them is crucial because they:
Improve trade timing.
Help confirm signals.
Prevent emotional decision-making.
Allow traders to recognize trends earlier.
2. What Are Indicators?
Indicators are mathematical formulas applied to a stock, forex pair, commodity, or index to make market data easier to interpret.
For example, a simple indicator is the Moving Average. It takes the average of closing prices over a set number of days and smooths out fluctuations. This makes it easier to see the underlying trend.
Indicators can be broadly categorized into two groups:
Leading Indicators – Predict future price movements.
Example: Relative Strength Index (RSI), Stochastic Oscillator.
These give signals before the trend actually changes.
Lagging Indicators – Confirm existing price movements.
Example: Moving Averages, MACD.
They follow price action and confirm that a trend has started or ended.
3. What Are Oscillators?
Oscillators are a subcategory of indicators that fluctuate within a defined range. For example, the RSI ranges from 0 to 100, while the Stochastic Oscillator ranges from 0 to 100 as well.
Traders use oscillators to identify:
Overbought conditions (when prices may be too high and due for correction).
Oversold conditions (when prices may be too low and due for a bounce).
The key difference between indicators and oscillators is that while all oscillators are indicators, not all indicators are oscillators. Oscillators usually appear in a separate window below the price chart.
4. Types of Indicators
Indicators can be classified based on their purpose:
A. Trend Indicators
These show the direction of the market.
Moving Averages (SMA, EMA, WMA)
MACD (Moving Average Convergence Divergence)
ADX (Average Directional Index)
B. Momentum Indicators
These measure the speed of price movements.
RSI (Relative Strength Index)
Stochastic Oscillator
CCI (Commodity Channel Index)
C. Volatility Indicators
These show how much prices are fluctuating.
Bollinger Bands
ATR (Average True Range)
Keltner Channels
D. Volume Indicators
These use traded volume to confirm price moves.
OBV (On-Balance Volume)
VWAP (Volume Weighted Average Price)
Chaikin Money Flow
5. Popular Indicators Explained
Let’s break down some of the most commonly used indicators:
5.1 Moving Averages
Simple Moving Average (SMA): Average of closing prices over a period.
Exponential Moving Average (EMA): Gives more weight to recent data, reacts faster.
Use: Identify trend direction, support, and resistance.
Example: If the 50-day EMA crosses above the 200-day EMA (Golden Cross), it’s a bullish signal.
5.2 MACD (Moving Average Convergence Divergence)
Consists of two EMAs (usually 12-day and 26-day).
A signal line (9-day EMA of MACD) generates buy/sell signals.
Use: Trend-following, momentum strength.
Example: When MACD crosses above signal line → Buy signal.
5.3 RSI (Relative Strength Index)
Range: 0 to 100.
Above 70 = Overbought.
Below 30 = Oversold.
Use: Identify reversals, divergence signals.
Example: RSI above 80 in a strong uptrend may still rise, so context matters.
5.4 Stochastic Oscillator
Compares a closing price to a range of prices over a period.
Range: 0 to 100.
Signals:
Above 80 = Overbought.
Below 20 = Oversold.
Special feature: Generates crossovers between %K and %D lines.
5.5 Bollinger Bands
Consist of a moving average and two standard deviation bands.
Bands expand during volatility, contract during consolidation.
Use:
Price near upper band = Overbought.
Price near lower band = Oversold.
5.6 Average True Range (ATR)
Measures volatility, not direction.
Higher ATR = High volatility.
Lower ATR = Low volatility.
Use: Set stop-loss levels, position sizing.
5.7 OBV (On-Balance Volume)
Combines price movement with volume.
Rising OBV = buyers in control.
Falling OBV = sellers in control.
6. Combining Indicators
No single indicator is perfect. Traders often combine two or more indicators to filter false signals.
Example Strategies:
RSI + Moving Average: Identify oversold conditions only if price is above the moving average (trend filter).
MACD + Bollinger Bands: Use MACD crossover as entry, Bollinger Band touch as exit.
Volume + Trend Indicator: Confirm trend direction with volume support.
7. Advantages of Using Indicators & Oscillators
Clarity – Simplifies raw data into easy-to-read signals.
Discipline – Reduces emotional trading.
Confirmation – Supports price action with mathematical evidence.
Adaptability – Works across stocks, forex, commodities, crypto.
8. Limitations
Lagging nature: Most indicators follow price, not predict it.
False signals: Especially in sideways markets.
Over-reliance: Blind faith in indicators leads to losses.
Conflicting results: Different indicators may show opposite signals.
9. Best Practices for Traders
Keep it simple: Use 2–3 reliable indicators instead of clutter.
Understand context: RSI at 80 in a strong bull run may not mean “sell.”
Combine with price action: Indicators are tools, not replacements for reading charts.
Backtest strategies: Always test on historical data before applying in live trades.
Adapt timeframe: What works in daily charts may not work in 5-minute charts.
10. Real-World Example
Suppose a trader is analyzing Nifty 50 index:
50-day EMA is above 200-day EMA → Trend is bullish.
RSI is at 65 → Market is not yet overbought.
OBV is rising → Strong buying volume.
Bollinger Bands are expanding → High volatility.
Conclusion: Strong bullish momentum. Trader may enter long with stop-loss below 200-day EMA.
Conclusion
Indicators & Oscillators are like navigation tools for traders. They don’t guarantee profits but improve decision-making, discipline, and timing. The real skill lies in knowing when to trust them, when to ignore them, and how to combine them with price action and market context.
To master them:
Learn their math and logic.
Practice on historical charts.
Combine with market structure analysis.
Keep evolving as markets change.
A professional trader treats indicators not as magical prediction machines, but as assistants in understanding market psychology.