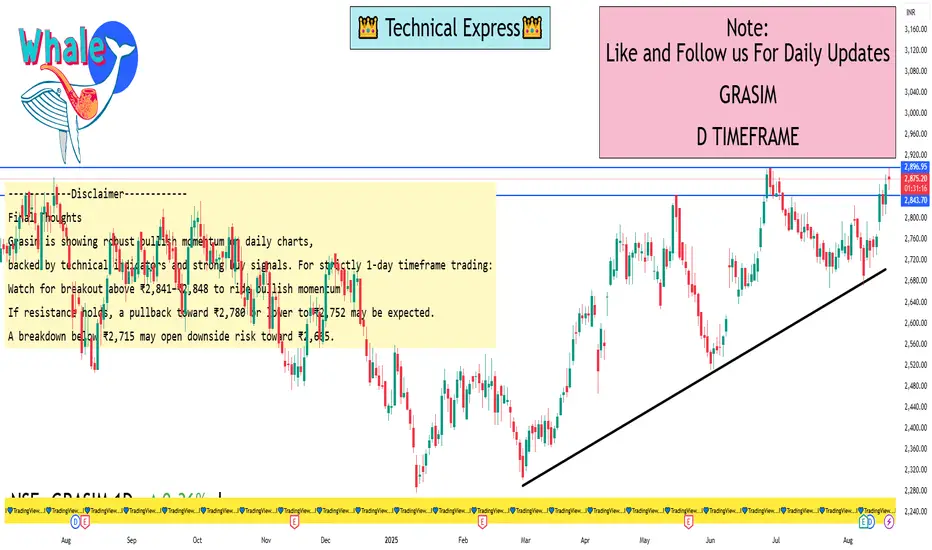
Grasim Industries LTD 1 Day ViewLatest insights from technical data providers:
Investing.com India indicates the daily technical recommendation for Grasim is Strong Buy. All daily moving averages (MA5, MA10, MA20, MA50, MA100, MA200) are signaling Buy, and technical indicators (RSI, MACD, etc.) align with a bullish outlook.
Munafasutra (NSE/MA platform) provides more specific levels for intraday trading:
Daily Resistance: ₹2,841.15
Short-term Resistance: ₹2,785.08
Short-term Support: ₹2,752.21
EquityPandit (weekly outlook, still helpful for context):
Immediate daily-level support: ₹2,715.00
Immediate resistance: ₹2,804.90
Primary weekly support: ₹2,665.10
Primary weekly resistance: ₹2,844.90
TopStockResearch gives technical overlays:
SuperTrend: ₹2,848.16 (indicates Mild Bearish on intraday basis)
Parabolic SAR: ₹2,672.60 (Mild Bullish signal)
Daily trading range: Low ₹2,807.40 to High ₹2,883.60
TATAPOWER
Divergence SecretsKey Terminologies in Option Trading
Before diving deep, let’s understand some essential terms:
Call Option: A contract that gives the buyer the right (but not the obligation) to buy an asset at the strike price before expiry.
Example: Buying a Reliance ₹2500 Call Option means you can buy Reliance shares at ₹2500 even if the market price rises to ₹2700.
Put Option: A contract that gives the buyer the right (but not the obligation) to sell an asset at the strike price before expiry.
Example: Buying a Nifty 19000 Put Option means you can sell Nifty at 19000 even if the market falls to 18500.
Premium: The price paid to buy the option contract.
Example: If a Nifty 20000 Call is trading at ₹150, that ₹150 is the premium.
Strike Price: The pre-decided price at which the option can be exercised.
Expiry Date: The last date on which the option contract is valid.
In-the-Money (ITM): Option that already has intrinsic value.
Example: Nifty at 20000 → 19500 Call is ITM.
Out-of-the-Money (OTM): Option that has no intrinsic value (only time value).
Example: Nifty at 20000 → 21000 Call is OTM.
At-the-Money (ATM): Option strike price is closest to current market price.
Lot Size: Options are traded in predefined lot sizes, not single shares.
Example: Bank Nifty option lot size = 15 units (as per 2025 rules).
Option Chain: A tabular representation showing available strikes, premiums, open interest, etc. for calls and puts.

Futures & Derivatives TradingIntroduction
The financial world is full of instruments designed to manage risk, improve returns, or speculate on price movements. Among these, derivatives stand out as some of the most powerful yet complex tools. They have been both praised for providing risk management solutions and criticized for their misuse in speculative bubbles.
At the heart of derivative trading lies futures contracts, which are widely used in stock markets, commodities, currencies, and even cryptocurrencies today. For beginners, the idea of betting on future prices might seem abstract, but in practice, derivatives are an essential pillar of modern finance.
In this guide, we’ll break down what derivatives are, how futures work, their role in trading, strategies, advantages, risks, and real-world examples. By the end, you’ll have a strong grasp of this exciting domain.
1. What Are Derivatives?
A derivative is a financial contract whose value is derived from the price of an underlying asset.
Underlying assets can be stocks, bonds, commodities (gold, oil, wheat), currencies, indices (Nifty 50, S&P 500), or even interest rates.
The derivative itself has no intrinsic value—its worth comes purely from the asset it tracks.
Key Types of Derivatives:
Futures – Standardized contracts to buy/sell an asset at a predetermined future date and price.
Options – Contracts that give the buyer the right, but not the obligation, to buy/sell at a specific price within a certain period.
Forwards – Similar to futures but customized and traded over-the-counter (OTC).
Swaps – Agreements to exchange cash flows (e.g., fixed vs. floating interest rates).
Futures are the most actively traded derivatives worldwide, making them the cornerstone of modern derivative trading.
2. Understanding Futures Contracts
A futures contract is an agreement between two parties to buy or sell an asset at a future date for a price decided today.
Features of Futures:
Standardized: Contracts are uniform in terms of size, expiration date, and rules (unlike forwards).
Exchange-traded: Futures trade on regulated exchanges (like NSE in India, CME in the US).
Margin & Leverage: Traders don’t pay the full contract value upfront. Instead, they deposit a small margin, which allows them to control large positions with less capital.
Settlement: Contracts may be settled physically (actual delivery of the asset) or in cash (profit/loss paid without delivery).
Example:
Suppose you buy a Nifty 50 Futures contract at 22,000. If at expiry, Nifty is at 22,500:
You gain = 500 × lot size (say 50) = ₹25,000.
If Nifty falls to 21,800:
You lose = 200 × 50 = ₹10,000.
This leverage magnifies both profits and losses.
3. Why Futures & Derivatives Exist
Derivatives serve three main purposes:
Hedging (Risk Management)
Farmers use commodity futures to lock in crop prices.
Importers hedge currency risk using forex futures.
Stock investors hedge downside risk with index futures.
Speculation
Traders bet on the price direction of oil, stocks, or indices without owning them.
Speculators provide liquidity to the market.
Arbitrage
Traders exploit price differences between spot and futures markets for risk-free profit.
Without derivatives, markets would be less liquid, riskier, and less efficient.
4. Futures Market Structure
Futures trading involves multiple participants:
Hedgers – Reduce risk (e.g., a farmer locking wheat prices).
Speculators – Take risk to profit from price changes.
Arbitrageurs – Exploit mispricing between markets.
Exchanges – NSE, CME, ICE, etc., which standardize and regulate contracts.
Clearing Houses – Guarantee contract performance and manage counterparty risk.
This structure ensures trust, transparency, and liquidity.
5. Key Terminologies in Futures & Derivatives
Spot Price – Current market price of the underlying asset.
Futures Price – Price agreed for future delivery.
Margin – Initial deposit (usually 5-15% of contract value) to trade futures.
Mark-to-Market (MTM) – Daily settlement of profits/losses.
Lot Size – Minimum quantity per contract (e.g., Nifty Futures = 50 units).
Expiry Date – Last date on which the contract is valid.
Open Interest – Total outstanding contracts in the market.
6. Trading Futures: Step-by-Step
Let’s walk through how a futures trade happens:
Decide Asset: Choose whether to trade index, stock, commodity, or currency futures.
Select Contract: Pick expiry month (near-month, mid-month, far-month).
Check Margin: Ensure sufficient capital for margin requirements.
Place Order: Buy (long) if expecting rise, Sell (short) if expecting fall.
MTM Adjustments: Profits/losses credited daily to trading account.
Exit or Hold: Close position before expiry or hold till expiry for settlement.
This cycle repeats every expiry, creating continuous opportunities for traders.
7. Strategies in Futures Trading
(A) Hedging Strategies
Long Hedge: A company buying raw material futures to guard against price rise.
Short Hedge: A farmer selling wheat futures to protect against price fall.
(B) Speculative Strategies
Long Futures: Buy futures anticipating price increase.
Short Futures: Sell futures anticipating price decline.
(C) Spread Trading
Calendar Spread: Buy near-month futures, sell far-month futures.
Inter-Commodity Spread: Trade two related commodities (e.g., crude oil vs. heating oil).
(D) Arbitrage Strategies
Cash & Carry Arbitrage: Buy asset in spot, sell futures if futures are overpriced.
Reverse Arbitrage: Sell asset in spot, buy futures if futures are underpriced.
8. Futures in Different Markets
(i) Stock Index Futures
Most popular in India (Nifty, Bank Nifty).
Allow trading market direction without stock picking.
(ii) Single Stock Futures
Futures on individual stocks (e.g., Reliance, TCS).
Higher risk as volatility is stock-specific.
(iii) Commodity Futures
Gold, silver, crude oil, wheat, copper.
Essential for farmers, producers, and speculators.
(iv) Currency Futures
USD/INR, EUR/USD, GBP/INR.
Help businesses hedge forex risk.
(v) Interest Rate Futures
Bonds and Treasury futures.
Used by banks and institutions to manage interest rate risk.
(vi) Crypto Futures
Bitcoin, Ethereum futures on exchanges like CME and Binance.
Extremely volatile, attracting speculative traders.
9. Advantages of Futures & Derivatives
Leverage: Control large positions with small margin.
Liquidity: Futures markets are highly liquid.
Transparency: Exchange-traded and regulated.
Hedging: Protection against adverse price movements.
Arbitrage Opportunities: Ensure fair pricing between spot and futures.
10. Risks in Futures & Derivatives
Leverage Risk: Small price moves can cause huge losses.
Liquidity Risk: Some contracts may lack liquidity.
Market Risk: Prices may move unpredictably.
Margin Calls: Traders must add funds if losses reduce margin balance.
Speculative Excess: Misuse of leverage can lead to financial crises (e.g., 2008).
Conclusion
Futures & derivatives are double-edged swords. Used wisely, they provide powerful tools for hedging, speculation, and arbitrage. Misused, they can cause devastating losses.
For traders, understanding market structure, margin system, risk management, and strategies is key before jumping in. Futures are not just about predicting the market—they’re about managing uncertainty.
Whether you’re a farmer protecting crop prices, a company managing forex risk, or a trader chasing short-term profits, derivatives are central to modern finance. With discipline and knowledge, they can open doors to immense opportunities.
Part 2 Ride The Big MovesBasic Concepts & Terminology
Before going deeper, let’s simplify the core terms in options trading:
Strike Price: The fixed price at which the buyer can buy (call) or sell (put) the asset.
Expiry Date: The date on which the option contract expires (e.g., weekly or monthly).
Option Premium: The cost paid by the buyer to the seller for getting this right.
Lot Size: Options are traded in lots, not single shares. Example: Nifty option lot = 50 units.
In-the-Money (ITM): When exercising the option is profitable.
Out-of-the-Money (OTM): When exercising the option is not profitable.
At-the-Money (ATM): When the strike price = current price of the underlying asset.
Example:
Suppose Reliance is trading at ₹2,500.
A Call option with strike 2,400 is ITM (because you can buy at 2,400, lower than 2,500).
A Put option with strike 2,600 is ITM (because you can sell at 2,600, higher than 2,500).

Quarterly Results TradingIntroduction
Quarterly results season is one of the most awaited periods in the stock market. For traders and investors alike, it brings excitement, volatility, and opportunities. Every three months, listed companies release their financial performance – revenues, profits, margins, guidance, and other key details. These numbers act as a report card for the company and often determine its short-term price direction.
For traders, this is not just about numbers but about market expectations versus reality. A company may post a strong profit jump, yet the stock could fall because the market expected even better. On the other hand, sometimes, even a small improvement compared to expectations can cause a stock to rally.
Quarterly results trading, therefore, is not simply about reading earnings reports but about understanding the psychology of the market, expectations, and how to position yourself before and after results.
1. Why Quarterly Results Matter
Quarterly results matter because:
Transparency: Companies must show how they are performing every three months, which helps investors evaluate progress.
Guidance: Many managements provide an outlook for upcoming quarters, shaping future stock expectations.
Catalyst for Price Movements: Earnings often trigger sharp stock moves – sometimes 5%, 10%, or even 20% in a single session.
Sectoral Trends: Results reveal which sectors are thriving (IT, banking, auto, FMCG, etc.) and which are struggling.
Macro Signals: Aggregated earnings give insight into the broader economy (e.g., consumer demand, credit growth, exports).
For traders, this creates volatility, and volatility equals opportunity.
2. Market Psychology During Earnings Season
Quarterly results trading is deeply tied to psychology. Here’s how it works:
Expectations vs Reality:
The market often “prices in” expectations before results. If analysts expect a 20% profit growth, and the company delivers only 18%, the stock may fall, even though profits grew.
Rumors & Hype:
Ahead of results, speculation and insider whispers move prices. “Buy on rumor, sell on news” often plays out.
Overreaction:
Investors sometimes overreact to one quarter. A temporary slowdown could cause panic selling, even if the long-term story remains intact.
Guidance Shock:
A company may post strong results but issue weak future guidance – causing a selloff. Conversely, weak results with strong future guidance may spark a rally.
3. Phases of Quarterly Results Trading
Quarterly earnings season typically unfolds in phases:
Pre-Results Run-Up (Speculation Phase):
Stocks often rally or decline based on rumors, channel checks, or analyst previews before official numbers.
Results Day (Volatility Spike):
Stocks witness sharp intraday moves – sometimes with gaps up/down at opening.
Immediate Reaction (1–3 days):
Price stabilizes based on how results compare with expectations and analyst commentary.
Post-Results Trend (1–4 weeks):
Institutional investors re-adjust portfolios, leading to sustained trends.
A good trader aligns strategies with these phases.
4. Key Metrics Traders Watch
When analyzing quarterly results, traders focus on:
Revenue (Top Line): Growth shows demand.
EBITDA & Operating Margin: Profitability efficiency.
Net Profit (Bottom Line): Final earnings after expenses.
Earnings Per Share (EPS): Direct impact on valuations.
Management Commentary/Guidance: Future growth outlook.
Order Book / New Contracts (for IT, infra, manufacturing).
Asset Quality (for Banks/NBFCs): NPA ratios, credit growth.
Volume Growth (for FMCG/Auto): Real demand indicator.
For traders, sometimes just one line in the commentary can swing sentiment.
5. Trading Strategies for Quarterly Results
A. Pre-Results Strategy (Speculative Positioning)
Approach: Buy/sell before results based on expectations.
Risk: Very high – numbers can surprise.
Tip: Suitable for experienced traders who can manage volatility.
B. Results-Day Strategy (Event Trading)
Approach: Trade intraday on sharp moves.
Tactics:
Momentum trading: Enter in direction of breakout.
Straddle/Strangle (Options): Trade volatility without directional bias.
Risk: Requires speed and discipline.
C. Post-Results Strategy (Confirmation Trading)
Approach: Wait for results + market reaction, then take position.
Example: If strong results + positive commentary + high volume buying, then go long for few weeks.
Advantage: Lower risk as clarity emerges.
D. Sector Rotation Strategy
Approach: Use results of large companies to gauge sector trend.
Example: If Infosys and TCS post strong results, smaller IT stocks may rally too.
E. Options Trading Around Results
Implied Volatility (IV): Rises before results due to uncertainty.
Strategy: Sell options after results when IV crashes (“volatility crush”).
Advanced Plays: Earnings straddles, iron condors, covered calls.
6. Case Studies (Indian Market Context)
Case 1: Infosys Quarterly Results
If Infosys posts weak guidance, entire IT sector (TCS, Wipro, HCLTech) reacts negatively.
Example: A 5% fall in Infosys can drag IT index down sharply.
Case 2: HDFC Bank Results
Being the largest bank, its results often set tone for entire banking sector.
NII growth, loan book expansion, and NPAs become benchmarks for peers.
Case 3: Maruti Suzuki Results
Auto stocks move not just on profits but on commentary about demand, chip supply, or new launches.
These show how one company’s results ripple across the market.
7. Risks in Quarterly Results Trading
Quarterly results trading is lucrative but risky. Main risks include:
Gap Openings: Stock may open with a huge gap, giving no chance to enter/exit.
Unexpected Commentary: Good numbers but weak guidance → stock falls.
Over-Leverage: Many traders use derivatives; sudden adverse moves cause big losses.
Noise vs Reality: Temporary slowdown may cause panic, while long-term fundamentals remain solid.
IV Crush in Options: Buying options before results often leads to losses post-results due to volatility collapse.
Risk management (stop-losses, position sizing) is essential.
8. Institutional vs Retail Traders
Institutional Investors:
Rely on detailed models, channel checks, analyst calls, and management interaction. They often position well in advance.
Retail Traders:
Often react after results, chasing momentum. Many fall into traps of speculative positioning without risk control.
Smart Approach for Retail:
Focus more on post-results trends rather than gambling pre-results.
9. Tools for Quarterly Results Trading
Earnings Calendar: NSE/BSE announcements.
Analyst Previews & Consensus Estimates: To know market expectations.
Financial Websites (Moneycontrol, Bloomberg, ET Markets): Quick numbers + commentary.
Charting Tools: Volume analysis, support/resistance for trading.
Options Data (OI, IV): To read market positioning.
10. Best Practices for Traders
Never trade all results – pick familiar sectors/stocks.
Avoid over-leverage; one wrong result can wipe out account.
Use options to hedge positions.
Study sector leaders first, then trade smaller peers.
Focus not just on results but on guidance and commentary.
If unsure, wait for confirmation trend post-results.
11. Long-Term Investor Angle
While traders focus on short-term volatility, long-term investors use quarterly results to:
Track consistent growth.
Evaluate management honesty.
Spot red flags (declining margins, debt buildup).
Accumulate during temporary corrections.
Thus, quarterly results season is not just for traders but also crucial for long-term positioning.
12. Global Context
Quarterly results trading is a global phenomenon:
US Markets: Tech giants like Apple, Amazon, Tesla move entire indices on results.
India: Banks, IT, and Reliance often dominate market direction.
Europe/Asia: Results reflect global demand and supply chain trends.
Indian traders increasingly follow US results (like Nasdaq tech earnings) to predict Indian IT stocks.
13. The Future of Quarterly Results Trading
With AI-driven trading and algorithmic models, quarterly results trading is evolving:
Algo Systems: Scan results instantly and trigger trades in seconds.
Social Media Sentiment: Twitter, Telegram groups influence sentiment.
Data Analytics: Alternative data (app downloads, credit card spending) gives early hints of results.
For retail traders, human intuition + discipline will remain valuable, but tech adoption is rising.
Conclusion
Quarterly results trading is one of the most exciting times in the stock market. It blends fundamentals, technicals, and psychology into a high-volatility environment. For traders, the key lies in understanding expectations, preparing strategies for different phases (pre-results, results day, post-results), and managing risk wisely.
Done right, quarterly results season can offer some of the biggest short-term opportunities in trading. Done wrong, it can lead to painful losses. The difference comes down to preparation, patience, and discipline.

Divergence SecretsWhat Are Options?
Options are derivative contracts that give the buyer the right (but not the obligation) to buy or sell an underlying asset (like stocks, index, currency, or commodity) at a predetermined price on or before a specific date.
Call Option (CE): Right to buy.
Put Option (PE): Right to sell.
Key Terms in Options
To understand options, you must know these basics:
Strike Price: The pre-decided price at which you can buy/sell the asset.
Premium: The cost you pay to buy the option contract.
Expiry Date: The date when the option contract ends.
Underlying Asset: The stock, index, or commodity linked to the option.
Lot Size: Minimum quantity you can trade in options (e.g., Nifty lot = 50 units).
Call vs Put Options
Call Option Buyer: Expects price to rise (bullish).
Put Option Buyer: Expects price to fall (bearish).
Call Option Seller: Expects price to stay below strike.
Put Option Seller: Expects price to stay above strike.

Part 2 Master Candle PatternKey Terms in Options Trading
Strike Price: The price at which you can buy/sell the underlying.
Premium: The cost paid to buy the option.
Expiry Date: Last day the option is valid (weekly/monthly in India).
Lot Size: Minimum tradable quantity (e.g., Nifty options = 25 units per lot).
ITM (In the Money): Option has intrinsic value.
ATM (At the Money): Strike price = underlying price.
OTM (Out of the Money): Option has no intrinsic value.
How Options Work (Indian Example)
Let’s take an example with Nifty 50 trading at ₹22,000:
Suppose you buy a Nifty 22,200 Call Option for a premium of ₹100 (lot size = 25).
Total cost = 100 × 25 = ₹2,500.
Case 1: Nifty goes up to 22,400
Intrinsic value = 22,400 – 22,200 = ₹200
Profit per lot = (200 – 100) × 25 = ₹2,500
Case 2: Nifty stays at 22,000 or falls
Option expires worthless.
Loss = Premium paid = ₹2,500
This asymmetry—limited risk, unlimited reward—is what attracts many retail traders to options.

Market Structure AnalysisIntroduction
In financial markets, price never moves randomly, even though it may appear chaotic at first glance. Beneath the constant fluctuations lies an organized framework that reflects the collective psychology of traders, investors, and institutions. This underlying framework is what we call Market Structure.
Market structure analysis is the study of how price moves, consolidates, trends, and reverses, and how participants’ decisions are reflected in these patterns. For a trader, understanding market structure is like learning the grammar of a new language—once mastered, it allows you to read the market’s story in real time.
This guide will explore the concept of market structure in detail, covering its building blocks, types, applications in trading, and advanced institutional perspectives.
Chapter 1: What is Market Structure?
At its core, market structure refers to the framework that price follows on a chart. It represents the sequence of higher highs (HH), higher lows (HL), lower highs (LH), and lower lows (LL). These swings reveal whether the market is trending upward, trending downward, or consolidating.
Uptrend: Higher highs + higher lows.
Downtrend: Lower lows + lower highs.
Range-bound: Horizontal highs and lows.
In essence, market structure maps who is in control:
Buyers (bulls) dominate in uptrends.
Sellers (bears) dominate in downtrends.
Neither dominates in consolidations.
This structural perspective is timeless—it applies whether you are looking at a 1-minute chart of Nifty futures or a monthly chart of Reliance Industries.
Chapter 2: The Building Blocks of Market Structure
To truly master market structure, one must recognize its core components:
1. Swing Highs & Swing Lows
A swing high is a peak surrounded by lower highs.
A swing low is a trough surrounded by higher lows.
These form the foundation of trend identification.
2. Break of Structure (BOS)
When price breaks a previous swing high/low, it signals potential trend continuation. Example: if Nifty breaks above its previous high, structure confirms bullish control.
3. Change of Character (ChoCh)
A ChoCh occurs when price shifts from making higher highs to lower lows (or vice versa). It’s the earliest sign of a trend reversal.
4. Liquidity Zones
Market structure is closely tied to liquidity. Stop-loss orders often rest below swing lows or above swing highs. Smart traders and institutions target these zones before resuming the main trend.
5. Order Blocks & Supply/Demand Zones
Order block: A consolidation before a strong move, showing where institutions placed large orders.
Demand zone: Area where buyers step in aggressively.
Supply zone: Area where sellers dominate.
Chapter 3: Phases of Market Structure
Market structure doesn’t remain constant—it evolves through phases:
Accumulation Phase
Price moves sideways after a downtrend.
Smart money quietly accumulates positions.
Seen before major rallies.
Markup Phase
Clear uptrend begins with higher highs and higher lows.
Retail traders join the move late.
Distribution Phase
After a prolonged rally, price consolidates at the top.
Institutions offload positions to late buyers.
Markdown Phase
Downtrend begins with lower highs and lower lows.
Panic selling occurs.
This cycle repeats endlessly across timeframes, forming the backbone of market psychology.
Chapter 4: Trend Analysis with Market Structure
Uptrend Structure
Formation: HH → HL → HH → HL.
Confirmation: Break of previous HH.
Invalidated when: A LL forms.
Downtrend Structure
Formation: LL → LH → LL → LH.
Confirmation: Break of previous LL.
Invalidated when: A HH forms.
Ranging Market
Price oscillates between support & resistance.
Market accumulates liquidity before breakout.
A trader who can correctly identify which phase the market is in gains a strategic edge.
Chapter 5: Institutional Perspective of Market Structure
Retail traders often chase price, while institutions engineer liquidity. To understand real market structure, we must adopt the institutional lens.
Liquidity Hunts: Price spikes above resistance or below support are often “stop hunts” to collect liquidity before reversing.
False Breakouts: Institutions create fake moves to mislead retail traders.
Order Flow: Real structure forms around institutional buying/selling, not random retail trades.
Smart Money Concepts (SMC) emphasize that market structure is not just about patterns—it’s about where liquidity is pooled and how it’s manipulated.
Chapter 6: Tools to Analyze Market Structure
Multi-Timeframe Analysis (MTFA)
Higher timeframes show dominant structure.
Lower timeframes provide entries.
Example: Daily trend is up, but 5-min chart offers entry pullbacks.
Volume Profile
Market structure becomes more powerful when combined with volume.
High volume at support/resistance confirms institutional activity.
Moving Averages
Help visualize structural direction.
200 EMA for long-term trend, 20 EMA for short-term pullbacks.
Fibonacci Levels
Retracement levels align with swing lows/highs.
Confluence strengthens structural setups.
Chapter 7: Practical Applications of Market Structure
Entry Points
Enter on retest of broken structure (BOS).
Enter near demand zones in uptrend, supply zones in downtrend.
Stop Loss Placement
Below last swing low in uptrend.
Above last swing high in downtrend.
Take Profit Levels
Next structural swing.
Previous high/low as targets.
Scalping, Swing, Position Trading
Scalpers use intraday structure.
Swing traders follow daily/weekly swings.
Investors watch monthly structure.
Chapter 8: Case Study – Market Structure in Nifty & Bank Nifty
Example 1: Nifty forms HH-HL pattern for weeks. When it breaks structure (ChoCh), a reversal begins.
Example 2: Bank Nifty hunts liquidity below a key support, only to rally back up, showing institutional manipulation.
Market structure analysis consistently reveals the hidden story behind price movements.
Chapter 9: Common Mistakes in Market Structure Analysis
Ignoring higher timeframe structure.
Confusing minor pullbacks with full reversals.
Over-trading every swing instead of waiting for confirmation.
Blindly trusting indicators without structure context.
Chapter 10: Advanced Market Structure Concepts
Fractals
Structure repeats across timeframes.
A daily uptrend may contain intraday downtrends.
Wyckoff Theory Integration
Accumulation and distribution patterns align perfectly with structural shifts.
Liquidity Maps
Mapping swing highs/lows helps predict stop hunts.
Conclusion
Market Structure Analysis is not just a trading tool—it is the foundation of price action trading. By learning to read swing highs, swing lows, breaks of structure, and liquidity grabs, traders gain the ability to anticipate market moves with precision.
Unlike lagging indicators, structure reveals real-time intent of market participants. Whether you are an intraday scalper, swing trader, or long-term investor, market structure is your compass in the ever-changing landscape of financial markets.
Mastering it requires practice, patience, and discipline, but once understood, it transforms how you see the market—no longer as random noise, but as an organized story driven by psychology and institutional activity.
Market Rotation Strategies1. Introduction to Market Rotation
Market rotation (also called sector rotation or capital rotation) is a strategy where traders and investors shift their capital between different asset classes, sectors, or investment styles based on economic conditions, market sentiment, and performance trends.
The idea is simple: money flows like a river — it doesn’t disappear, it just changes direction. By positioning yourself where the money is flowing, you can potentially capture higher returns and reduce drawdowns.
Example: In an economic boom, technology and consumer discretionary stocks may outperform. But during a slowdown, utilities and healthcare might take the lead.
2. Why Market Rotation Works
Market rotation works because of capital flow dynamics. Institutional investors, hedge funds, pension funds, and large asset managers reallocate capital based on:
Economic Cycle – Growth, peak, contraction, and recovery phases affect which sectors lead or lag.
Interest Rates – Rising or falling rates change the attractiveness of certain assets.
Earnings Growth Expectations – Sectors with better forward earnings tend to attract inflows.
Risk Appetite – “Risk-on” phases favor aggressive sectors; “risk-off” phases favor defensive sectors.
Rotation strategies aim to front-run or follow these capital shifts.
3. Types of Market Rotation
Market rotation isn’t just about sectors. It happens across various dimensions:
A. Sector Rotation
Shifting between market sectors (e.g., tech, energy, financials, healthcare) depending on performance and macroeconomic signals.
Example Pattern in a Typical Economic Cycle:
Early Expansion: Industrials, Materials, Financials
Mid Expansion: Technology, Consumer Discretionary
Late Expansion: Energy, Basic Materials
Recession: Utilities, Healthcare, Consumer Staples
B. Style Rotation
Shifting between different investing styles such as:
Growth vs. Value
Large-cap vs. Small-cap
Dividend vs. Non-dividend stocks
Example: When interest rates rise, value stocks often outperform growth stocks.
C. Asset Class Rotation
Shifting between stocks, bonds, commodities, real estate, or even cash based on macroeconomic conditions.
Example: Moving from equities to bonds before an expected recession.
D. Geographic Rotation
Allocating funds between different countries or regions.
Example: Rotating from U.S. equities to emerging markets when global growth broadens.
4. The Economic Cycle & Market Rotation
Understanding the economic cycle is critical for timing rotations.
Four Main Phases:
Early Recovery: GDP starts growing, interest rates are low, credit expands.
Mid Cycle: Growth strong, inflation starts rising, central banks begin tightening.
Late Cycle: Growth slows, inflation high, corporate profits peak.
Recession: GDP contracts, unemployment rises, central banks cut rates.
Sector Leaders by Cycle:
Economic Phase Leading Sectors
Early Recovery Industrials, Financials, Technology
Mid Cycle Consumer Discretionary, Industrials, Tech
Late Cycle Energy, Materials, Healthcare
Recession Utilities, Consumer Staples, Healthcare
5. Tools & Indicators for Rotation Strategies
A. Relative Strength (RS) Analysis
Compares the performance of a sector/asset to a benchmark (e.g., S&P 500).
RS > 1: Outperforming
RS < 1: Underperforming
B. Moving Averages
Track momentum trends in sector ETFs or indexes.
50-day & 200-day MA crossovers can signal when to rotate.
C. MACD & RSI
Momentum oscillators can indicate when a sector is overbought/oversold.
D. Intermarket Analysis
Study correlations between:
Stocks & Bonds
Commodities & Currencies
Oil prices & Energy stocks
E. Economic Data
Key data points for rotation:
PMI (Purchasing Managers Index)
Inflation (CPI, PPI)
Interest Rate Trends
Earnings Reports
6. Step-by-Step: Building a Market Rotation Strategy
Step 1 – Define Your Universe
Choose what you’ll rotate between:
S&P 500 sectors (using ETFs like XLK for tech, XLF for financials)
Style indexes (e.g., Growth vs Value ETFs)
Asset classes (SPY, TLT, GLD, etc.)
Step 2 – Choose Your Indicators
Example:
3-month relative performance vs S&P 500
Above 50-day MA = bullish
Below 50-day MA = bearish
Step 3 – Establish Rotation Rules
Example:
Every month, buy the top 3 sectors ranked by RS.
Hold until the next review period.
Exit if RS drops below 0.9 or price closes below 200-day MA.
Step 4 – Risk Management
Max 20-30% of portfolio per sector
Stop-loss of 8-10% per position
Cash position allowed when no sector meets criteria
Step 5 – Backtest
Use historical data for at least 10 years.
Compare performance vs buy-and-hold S&P 500.
7. Example Rotation Strategy
Universe: 9 SPDR Sector ETFs
Indicator: 3-month price performance
Rules:
Each month, rank all sectors by 3-month returns.
Buy the top 3 equally weighted.
Hold for 1 month, then rebalance.
Exit if price drops below 200-day MA.
Result (historical):
Outperforms S&P 500 in trending markets.
Avoids big drawdowns in recessions.
8. Advanced Rotation Approaches
A. Factor Rotation
Rotate based on factors like:
Momentum
Low Volatility
Quality
Value
B. Tactical Asset Allocation (TAA)
Mix market rotation with risk-on/risk-off models.
Example:
Risk-on: Equities + Commodities
Risk-off: Bonds + Cash
C. Quantitative Rotation
Use algorithms to dynamically shift assets based on multi-factor models (momentum + macro + volatility).
D. Seasonal Rotation
Exploit seasonal trends.
Example: Energy stocks in winter, retail stocks in holiday season.
9. Risk Management in Market Rotation
Even with a rotation strategy:
Correlations can rise in market crashes (everything falls together).
Overtrading can eat into returns due to costs.
False signals can lead to whipsaws.
Mitigation:
Use confirmation from multiple indicators.
Diversify across at least 3 positions.
Keep cash buffer during high uncertainty.
10. Common Mistakes in Rotation Strategies
Chasing performance – Entering too late after a sector has already peaked.
Ignoring transaction costs – Frequent rebalancing reduces net gains.
Overfitting backtests – Strategy works historically but fails in real time.
Neglecting macro trends – Technicals alone may miss big shifts.
Conclusion
Market rotation strategies are about positioning capital where it has the highest probability of growth while avoiding weak areas.
Done right, rotation:
Improves returns
Reduces volatility
Aligns with economic and market cycles
But it requires discipline, data, and adaptability.
The market is dynamic — rotation strategies must evolve with it.
Option Trading Practical Trading Examples
Let’s take a real-world India market scenario:
Event: Union Budget Day
High volatility expected.
Strategy: Buy Straddle (ATM CE + ATM PE).
Result: If NIFTY jumps or crashes by 300 points, profits can be significant.
Event: Stock Result Announcement (Infosys)
Medium move expected.
Strategy: Strangle (slightly OTM CE + OTM PE).
Result: Lower cost, profitable if stock moves big.
Risk Management in Options Trading
Options can wipe out capital quickly if used recklessly.
Follow these rules:
Never risk more than 2% of capital per trade.
Avoid over-leveraging — options give leverage, don’t overuse it.
Use stop-losses.
Avoid buying far OTM options unless speculating small amounts.
Track implied volatility — don’t overpay in high-IV environments.

Breakout & Breakdown Strategies in Trading1. Introduction
Trading is not just about buying low and selling high—it’s about identifying when the market is ready to move decisively in a particular direction. Among the most powerful price action-based methods, Breakout and Breakdown strategies have earned their place as timeless tools in a trader’s arsenal.
Breakout: When the price pushes above a significant resistance level or price consolidation zone, signaling potential bullish momentum.
Breakdown: When the price falls below a significant support level or consolidation zone, signaling potential bearish momentum.
The reason these strategies are so popular is simple: when price escapes a strong level, it often triggers a wave of orders—both from new traders entering the market and from existing traders closing losing positions. This can create explosive moves.
2. Understanding Market Structure
Before diving into strategies, it’s important to understand how the market’s “architecture” works.
2.1 Support and Resistance
Support is a price level where buying interest tends to emerge, preventing the price from falling further.
Resistance is a price level where selling pressure tends to emerge, preventing the price from rising further.
A breakout happens when resistance is breached, and a breakdown occurs when support is breached.
2.2 Consolidation Zones
Markets often move sideways before a breakout or breakdown. These “tight” ranges reflect indecision. The tighter the range, the stronger the potential move after the breakout.
2.3 Market Participants
Understanding who’s involved can help:
Retail traders often chase moves.
Institutions accumulate positions quietly during consolidation.
Algorithmic traders may trigger breakouts with large volume spikes.
3. Market Psychology Behind Breakouts & Breakdowns
Price movements are not just numbers; they reflect human emotions—fear, greed, and uncertainty.
3.1 Breakouts
Traders waiting for confirmation jump in as soon as resistance breaks.
Short sellers may cover their positions (buy to exit), adding buying pressure.
Momentum traders and algorithms pile on, accelerating the move.
3.2 Breakdowns
Long holders panic and sell when support breaks.
Short sellers initiate fresh positions.
Stop-loss orders below support get triggered, adding to the downward momentum.
3.3 False Breakouts/Breakdowns
Not every breakout is genuine—sometimes price quickly returns inside the range. This is often due to:
Low volume breakouts.
Manipulative “stop-hunting” by large players.
News events reversing sentiment.
4. Types of Breakout & Breakdown Setups
4.1 Horizontal Level Breakouts
Price breaks a clearly defined horizontal resistance or support.
Works best when levels are tested multiple times before the break.
4.2 Trendline Breakouts
A downward sloping trendline break signals bullish potential.
An upward sloping trendline break signals bearish potential.
4.3 Chart Pattern Breakouts
Ascending Triangle → Breaks upward most often.
Descending Triangle → Breaks downward most often.
Flags/Pennants → Continuation patterns after a sharp move.
Head and Shoulders → Breakdown after neckline breach.
4.4 Range Breakouts
Price has been moving sideways; breaking the range signals a new directional trend.
4.5 Volatility Breakouts
Using Bollinger Bands or ATR to identify when volatility expansion may trigger breakouts.
5. Technical Tools for Breakout & Breakdown Trading
5.1 Volume Analysis
Genuine breakouts usually have above-average volume.
A price breakout without volume can be a trap.
5.2 Moving Averages
Breakouts above the 50-day or 200-day MA often attract attention.
Crossovers can confirm breakouts.
5.3 Bollinger Bands
Breakout beyond the upper band often signals bullish continuation.
Breakdown beyond the lower band often signals bearish continuation.
5.4 Average True Range (ATR)
Helps set stop-losses based on market volatility.
Breakouts with ATR expansion are more reliable.
5.5 RSI & Momentum Indicators
RSI crossing above 50 during a breakout supports bullishness.
Divergences can warn against false moves.
6. Step-by-Step Breakout Trading Strategy
Let’s break down a long breakout strategy:
Identify Key Level
Mark strong resistance levels or consolidation highs.
Wait for Price to Approach
Avoid preemptively entering; wait until price tests the level.
Check Volume Confirmation
Look for higher-than-average volume during the breakout candle.
Entry Trigger
Enter after a candle closes above resistance, not just a wick.
Stop-Loss Placement
Place SL below the breakout candle’s low or below the last swing low.
Profit Targets
First target: Equal to range height.
Second target: Use trailing stop to capture more upside.
7. Step-by-Step Breakdown Trading Strategy
For a short breakdown strategy:
Identify Strong Support
Multiple touches strengthen the level.
Observe Price Action
Watch for compression near support.
Volume Confirmation
High volume on breakdown increases reliability.
Entry
Enter after candle closes below support.
Stop-Loss
Above the breakdown candle high or last swing high.
Profit Targets
First: Range height projection.
Second: Trail stop for extended moves.
8. Risk Management
Breakout and breakdown trading is high-reward but also high-risk without proper risk controls.
8.1 Position Sizing
Risk only 1–2% of capital per trade.
8.2 Avoid Overtrading
Not every breakout is worth trading—quality over quantity.
8.3 Stop-Loss Discipline
Never widen stops once placed.
8.4 Recognizing False Breakouts
No volume surge.
Price rejection at the breakout point.
Sudden reversal candles (shooting star, hammer).
9. Advanced Tips for Success
9.1 Multi-Timeframe Analysis
Confirm breakouts on higher timeframes for reliability.
9.2 Retest Entries
Instead of chasing the breakout, wait for price to retest the broken level and bounce.
9.3 Combine With Indicators
MACD crossovers, RSI breakouts, or Ichimoku Cloud confirmations can filter false signals.
9.4 Avoid News-Driven Breakouts
These are often short-lived spikes unless supported by strong fundamentals.
10. Real-World Example
Breakout Example
Stock consolidates between ₹950–₹1000 for weeks.
Volume surges as it closes at ₹1015.
Entry at ₹1015, SL at ₹990.
Price rallies to ₹1080 within days.
Breakdown Example
Nifty support at 19,800 tested thrice.
Price closes at 19,750 with high volume.
Short entry at 19,750, SL at 19,880.
Price drops to 19,500.
11. Pros and Cons
Pros:
Captures explosive moves early.
Works in all markets (stocks, forex, crypto).
High reward-to-risk potential.
Cons:
False breakouts can be frustrating.
Requires discipline to wait for confirmation.
Volatility can trigger stop-losses before the real move.
12. Summary Table: Breakout vs Breakdown
Feature Breakout (Long) Breakdown (Short)
Key Level Resistance Support
Volume Signal High volume on upward candle High volume on downward candle
Stop-Loss Below breakout candle low Above breakdown candle high
Target Range height or trend ride Range height or trend ride
13. Final Thoughts
Breakout and breakdown strategies work because they align with the natural order flow of the market—when key levels are breached, they often trigger a flood of buying or selling activity. However, success depends heavily on patience, confirmation, and risk management.
A trader who learns to differentiate between a true breakout and a false move has a powerful edge. By combining technical levels, volume analysis, and disciplined execution, breakout/breakdown trading can become a cornerstone strategy in any trading plan.
Options Trading Strategies 1. Introduction to Options Trading
Options are like a financial “contract” that gives you rights but not obligations.
When you buy an option, you are buying the right to buy or sell an asset at a specific price before a certain date.
They’re mainly used in stocks, commodities, indexes, and currencies.
Two main types of options:
Call Option – Right to buy an asset at a set price.
Put Option – Right to sell an asset at a set price.
Key terms:
Strike Price – The price at which you can buy/sell the asset.
Expiration Date – The last day you can use the option.
Premium – Price paid to buy the option.
In the Money (ITM) – Option has intrinsic value.
Out of the Money (OTM) – Option has no intrinsic value yet.
At the Money (ATM) – Strike price equals current market price.
Options give traders flexibility, leverage, and hedging power. But with great power comes great “margin calls” if you misuse them.
2. Why Traders Use Options
Options aren’t just for speculation — they have multiple uses:
Speculation – Betting on price moves.
Hedging – Protecting an existing investment from loss.
Income Generation – Selling options for premium income.
Risk Management – Limiting losses through defined-risk trades.
3. Basic Options Strategies (Beginner Level)
3.1 Buying Calls
When to Use: You expect the price to go up.
How It Works: You buy a call option to lock in a lower purchase price.
Risk: Limited to the premium paid.
Reward: Unlimited upside.
Example: Stock at ₹100, buy a call at ₹105 strike for ₹3 premium. If stock rises to ₹120, your profit = ₹12 – ₹3 = ₹9 per share.
3.2 Buying Puts
When to Use: You expect the price to go down.
How It Works: You buy a put option to sell at a higher price later.
Risk: Limited to the premium.
Reward: Significant (but capped at the strike price minus premium).
Example: Stock at ₹100, buy a put at ₹95 for ₹2 premium. If stock drops to ₹80, profit = ₹15 – ₹2 = ₹13.
3.3 Covered Call
When to Use: You own the stock but expect it to stay flat or slightly rise.
How It Works: Sell a call option against your owned stock to collect premium.
Risk: You must sell the stock if price exceeds strike.
Reward: Stock appreciation + premium income.
Example: Own stock at ₹100, sell call at ₹105 for ₹2. If stock stays below ₹105, you keep the ₹2.
3.4 Protective Put
When to Use: You own a stock and want downside protection.
How It Works: Buy a put to protect against price drops.
Risk: Premium cost.
Reward: Security against big losses.
Example: Own stock at ₹100, buy put at ₹95 for ₹2. Even if stock crashes to ₹50, you can still sell at ₹95.
4. Intermediate Options Strategies
4.1 Bull Call Spread
When to Use: Expect moderate price rise.
How It Works: Buy a call at a lower strike, sell a call at higher strike.
Risk: Limited to net premium paid.
Reward: Limited to strike difference minus premium.
Example: Buy call at ₹100 (₹5), sell call at ₹110 (₹2). Net cost ₹3. Max profit ₹7.
4.2 Bear Put Spread
When to Use: Expect moderate decline.
How It Works: Buy put at higher strike, sell put at lower strike.
Risk: Limited to net premium paid.
Reward: Limited but cheaper than buying a single put.
Example: Buy put ₹105 (₹6), sell put ₹95 (₹3). Net cost ₹3. Max profit ₹7.
4.3 Straddle
When to Use: Expect big move but unsure direction.
How It Works: Buy call and put at same strike & expiry.
Risk: High premium cost.
Reward: Big if price moves sharply up or down.
Example: Stock at ₹100, buy call ₹100 (₹4) and put ₹100 (₹4). Cost ₹8. Needs a big move to profit.
4.4 Strangle
When to Use: Expect big move but want cheaper entry than straddle.
How It Works: Buy OTM call and put.
Risk: Cheaper than straddle but needs larger move.
Example: Stock at ₹100, buy call ₹105 (₹3) and put ₹95 (₹3). Cost ₹6.
4.5 Iron Condor
When to Use: Expect low volatility.
How It Works: Sell an OTM call spread + sell an OTM put spread.
Risk: Limited by spread width.
Reward: Limited to premium collected.
Example: Stock at ₹100, sell call ₹110, buy call ₹115; sell put ₹90, buy put ₹85.
5. Advanced Options Strategies
5.1 Butterfly Spread
When to Use: Expect stock to stay near a specific price.
How It Works: Buy 1 ITM option, sell 2 ATM options, buy 1 OTM option.
Risk: Limited.
Reward: Highest if stock ends at middle strike.
Example: Stock ₹100, buy call ₹95, sell 2 calls ₹100, buy call ₹105.
5.2 Calendar Spread
When to Use: Expect low short-term volatility but possible long-term move.
How It Works: Sell short-term option, buy long-term option at same strike.
Risk: Limited to net premium.
Reward: Comes from time decay of short option.
5.3 Ratio Spread
When to Use: Expect limited move in one direction.
How It Works: Buy 1 option, sell multiple options at different strikes.
Risk: Unlimited on one side if not hedged.
5.4 Diagonal Spread
When to Use: Expect gradual move over time.
How It Works: Buy long-term option at one strike, sell short-term option at different strike.
6. Risk Management in Options
Even though options can limit loss, traders often misuse them and blow accounts.
Key risk tips:
Never risk more than 2–3% of capital on one trade.
Understand implied volatility — high IV inflates premiums.
Avoid selling naked options without sufficient margin.
Always set stop-loss rules.
7. Understanding Greeks (The DNA of Options Pricing)
Delta – How much the option price changes per ₹1 move in stock.
Gamma – How fast delta changes.
Theta – Time decay rate.
Vega – Sensitivity to volatility changes.
Rho – Interest rate sensitivity.
Mastering the Greeks means you understand why your option is moving, not just that it’s moving.
8. Common Mistakes to Avoid
Holding OTM options too close to expiry hoping for a miracle.
Selling naked calls without understanding unlimited risk.
Over-leveraging with too many contracts.
Ignoring commissions and slippage.
Not adjusting positions when market changes.
9. Practical Tips for Success
Backtest strategies on historical data.
Start with paper trading before using real money.
Track your trades in a journal.
Combine technical analysis with options knowledge.
Trade liquid options with tight bid-ask spreads.
10. Final Thoughts
Options are like a Swiss Army knife in trading — versatile, powerful, and potentially dangerous if misused. The right strategy depends on:
Market view (up, down, sideways, volatile, stable)
Risk tolerance
Timeframe
Experience level
By starting with basic strategies like covered calls or protective puts, then moving into spreads, straddles, and condors, you can build a strong foundation. With practice, risk management, and discipline, options trading can be a valuable tool in your investment journey.
AI-Powered Algorithmic Trading1. Introduction – What is AI-Powered Algorithmic Trading?
Algorithmic trading (or “algo trading”) refers to the use of computer programs to automatically execute trades based on pre-defined rules. Traditionally, these rules might be based on technical indicators, price movements, or arbitrage opportunities.
AI-powered algorithmic trading takes this a step further by introducing artificial intelligence—especially machine learning (ML) and deep learning—to allow trading systems to learn from historical and real-time market data, adapt to changing market conditions, and make predictive, dynamic decisions.
Instead of rigid “if price crosses moving average, buy” rules, AI systems can detect patterns, correlations, and anomalies that humans or static programs might miss.
2. Evolution of Algorithmic Trading to AI-Driven Models
The journey from traditional algorithmic trading to AI-powered systems can be broken down into four stages:
Rule-Based Algorithms (Pre-2000s)
Simple if/then conditions.
Focused on execution speed, arbitrage, and basic market-making.
Statistical & Quantitative Models (2000–2010)
Regression models, time-series forecasting, and quantitative finance techniques.
Still deterministic, but more math-heavy.
Machine Learning Integration (2010–2020)
Use of ML algorithms (random forests, SVMs, gradient boosting) for predictive analysis.
Trading bots capable of adjusting based on new data.
Deep Learning & Reinforcement Learning (2020–present)
Neural networks (CNNs, LSTMs) for complex market pattern recognition.
Reinforcement learning for strategy optimization through trial and error.
Integration with alternative data (social media sentiment, satellite images, news feeds).
3. Core Components of AI-Powered Trading Systems
An AI-driven trading system typically consists of:
3.1 Data Pipeline
Market Data – Price, volume, order book depth, volatility.
Fundamental Data – Earnings reports, macroeconomic indicators.
Alternative Data – Social sentiment, satellite imagery, weather, Google search trends.
Data Cleaning & Preprocessing – Handling missing values, removing noise.
3.2 Model Development
Feature Engineering – Creating input variables from raw data.
Model Selection – Choosing between ML models (e.g., XGBoost, LSTM, Transformers).
Training & Validation – Using historical data for supervised learning, walk-forward testing.
3.3 Strategy Execution
Signal Generation – Buy, sell, or hold decisions based on model outputs.
Risk Management – Stop-loss, position sizing, portfolio rebalancing.
Order Execution Algorithms – VWAP, TWAP, POV, smart order routing.
3.4 Monitoring & Optimization
Real-Time Performance Tracking – Comparing live results vs. backtests.
Model Retraining – Updating with new market data to prevent overfitting.
Error Handling – Fail-safes for market anomalies or connectivity issues.
4. How AI Learns to Trade
AI learns in trading using three primary methods:
4.1 Supervised Learning
Goal: Predict future prices, returns, or direction based on labeled historical data.
Example: Feed the model past OHLC (Open, High, Low, Close) prices and ask it to predict tomorrow’s close.
4.2 Unsupervised Learning
Goal: Detect hidden patterns or clusters in data without labeled outcomes.
Example: Group stocks with similar volatility or correlation profiles for pair trading.
4.3 Reinforcement Learning (RL)
Goal: Learn optimal trading strategies via trial and error.
Example: RL agent receives rewards for profitable trades and penalties for losses, improving its decision-making over time.
5. Types of AI-Powered Trading Strategies
5.1 Predictive Price Modeling
Using historical data to forecast future price movements.
Often employs LSTMs or Transformers for time-series forecasting.
5.2 Market Making with AI
Continuously quoting buy/sell prices, adjusting spreads dynamically using AI predictions of short-term volatility.
5.3 Sentiment-Based Trading
AI analyzes Twitter, Reddit, news feeds to gauge public sentiment and predict market reactions.
5.4 Statistical Arbitrage
AI identifies temporary mispricings between correlated assets and executes mean-reverting trades.
5.5 Event-Driven AI Trading
AI reacts instantly to earnings announcements, mergers, or geopolitical news.
5.6 Reinforcement Learning Agents
Self-improving trading bots that adapt to market conditions without explicit human rules.
6. Real-World Applications
6.1 Hedge Funds
Quant funds like Renaissance Technologies use AI to detect micro-patterns invisible to human traders.
6.2 High-Frequency Trading (HFT) Firms
AI reduces latency in trade execution, managing millions of trades daily.
6.3 Retail Platforms
AI-powered robo-advisors suggest portfolio changes for individual investors.
6.4 Crypto Markets
AI-driven bots handle 24/7 volatility in crypto exchanges.
7. Advantages of AI in Trading
Pattern Recognition Beyond Human Capacity – Can process millions of data points per second.
Adaptive Strategies – Models adjust to new regimes (bull, bear, sideways markets).
Speed & Automation – Faster decision-making and execution than manual trading.
Diversification – AI can monitor multiple markets simultaneously.
Reduced Emotional Bias – No fear or greed, only data-driven decisions.
8. Challenges & Risks
8.1 Overfitting
AI may learn patterns that only existed in the training dataset.
8.2 Black Box Problem
Deep learning models are hard to interpret, making risk management tricky.
8.3 Market Regime Shifts
AI trained on bull market data may fail in sudden bear markets.
8.4 Data Quality Issues
Garbage in, garbage out – poor data leads to bad trades.
8.5 Regulatory Risks
Compliance with SEBI, SEC, MiFID II regulations for AI usage in trading.
9. Building Your Own AI Trading Bot – Step-by-Step
Choose a Market – Equities, Forex, Crypto, Commodities.
Collect Historical Data – API feeds from exchanges or vendors.
Preprocess Data – Clean, normalize, create technical indicators.
Select an AI Model – Start simple (logistic regression) → progress to LSTMs.
Backtest the Strategy – Simulate trades on historical data.
Paper Trade – Test in a live environment without risking capital.
Go Live with Risk Controls – Implement stop-loss, position sizing.
Continuous Monitoring & Retraining – Avoid model drift.
10. The Future of AI-Powered Algorithmic Trading
Explainable AI (XAI) – To make decisions more transparent for regulators.
Quantum Computing Integration – Faster optimization and pattern recognition.
Multi-Agent Systems – Multiple AI agents collaborating or competing in markets.
More Alternative Data Sources – IoT devices, ESG scores, real-time supply chain data.
AI-Driven Market Regulation – Governments may deploy AI to monitor market stability.
Conclusion
AI-powered algorithmic trading represents the next evolutionary step in financial markets—one where speed, adaptability, and intelligence define success. While it brings enormous potential for profit and efficiency, it also demands rigorous testing, robust risk controls, and continuous adaptation.
In the future, the best traders may not be the ones with the best intuition, but the ones who train the best AI systems.
Part1 Ride The Big MovesTypes of Option Traders
1. Speculators
They aim to profit from market direction using options. Their goal is capital gain.
2. Hedgers
They use options to protect investments from unfavorable price movements.
3. Income Traders
They sell options to earn premium income.
Option Trading Strategies
1. Basic Strategies
A. Buying Calls (Bullish)
Used when you expect the stock to rise.
B. Buying Puts (Bearish)
Used when expecting a stock to fall.
C. Covered Call (Neutral to Bullish)
Own the stock and sell a call option. Earn premium while holding the stock.
D. Protective Put (Insurance)
Own the stock and buy a put option to limit losses.

Part9 Trading MasterclassRisk Management in Strategies
Never sell naked calls unless fully hedged.
Position size to avoid overexposure.
Use stop-loss or delta hedging.
Monitor implied volatility — don’t sell cheap, don’t buy expensive.
Strategy Selection Framework
Market View: Bullish, Bearish, Neutral, Volatile?
Volatility Level: High IV (sell premium), Low IV (buy premium).
Capital & Risk Tolerance: Large capital allows complex spreads.
Time Frame: Short-term events vs. long-term trends.
Common Mistakes to Avoid
Trading without an exit plan.
Ignoring liquidity (wide bid-ask spreads hurt).
Selling options without understanding margin.
Overtrading during high emotions.
Not adjusting when market changes.

Part6 Institutional Trading Summary Table: Pros and Cons
✅ Pros ❌ Cons
High return potential Can expire worthless
Lower capital needed Time decay eats premium
Multiple strategies available Complex to understand fully
Hedge against price movement Requires constant monitoring
Suitable for both up/down/flat markets Emotional stress during volatility
Final Thoughts
Options trading is like a chess game in finance—a smart mix of logic, timing, and calculated risk. While it opens the doors to high returns and strategic flexibility, it's not a get-rich-quick scheme. Educate yourself, use tools wisely, manage risk, and practice consistently before going full throttle.
If you’d like a PDF version or want this guide tailored to a specific strategy or stock, let me know!
Also, I can help you build option strategy examples based on live market scenarios (Nifty, Bank Nifty, or specific stocks). Just ask!

Tata powerThe stock Tata power is making rising wedge pattern and making higher high pattern.
It's immediate levels are as below-:
Support 1- 355
Support 2- 323
Support 3- 282
And resistance
R1- 435
R2- 495
R3- 666

Options Trading Strategies📌 What Are Options in Trading?
Before we get into strategies, let’s understand what options actually are.
In the simplest form, options are contracts that give a trader the right, but not the obligation, to buy or sell an asset (like a stock, index, or commodity) at a specific price before or on a specific date.
There are two main types of options:
Call Option – Gives you the right to buy something at a set price.
Put Option – Gives you the right to sell something at a set price.
These tools can be used to hedge, speculate, or generate income. Now that you know what options are, let’s go deeper into strategies.
🎯 Why Use Options Strategies?
Options trading is not just about buying Calls and Puts randomly. It’s about smart combinations and planned risk management. With the right strategies, you can:
Profit in up, down, or sideways markets
Limit your losses
Leverage small capital
Hedge your stock or portfolio
Earn regular income
Let’s now dive into some popular options trading strategies—from basic to advanced—with examples.
✅ 1. Covered Call Strategy
💡 Use When: You own a stock and expect neutral or slightly bullish movement.
You own shares of a stock and you sell a Call Option on the same stock. You receive a premium from selling the Call, which gives you extra income even if the stock doesn’t move.
📘 Example:
You own 100 shares of Reliance at ₹2800. You sell a 2900 Call Option and receive ₹30 per share as premium.
If Reliance stays below ₹2900 – You keep your stock and the premium.
If Reliance goes above ₹2900 – Your stock gets sold (you deliver), but you still profit from stock rise + premium.
✅ Pros:
Earn extra income
Lower risk than buying naked calls
❌ Cons:
Limited upside
Need to own stock
✅ 2. Protective Put Strategy
💡 Use When: You own a stock but want to protect from downside risk.
Here, you buy a Put Option along with owning the stock. It acts like insurance – if the stock crashes, the Put will rise in value.
📘 Example:
You buy HDFC Bank shares at ₹1700 and buy a 1650 Put Option for ₹25.
If HDFC drops to ₹1600 – Your stock loses ₹100, but your Put may gain ₹50–₹75.
If HDFC goes up – You lose only the premium ₹25.
✅ Pros:
Protects your portfolio
Peace of mind in volatile markets
❌ Cons:
You pay a premium (like insurance)
Can eat into profits
✅ 3. Bull Call Spread
💡 Use When: You are moderately bullish on a stock.
You buy a Call Option at a lower strike and sell another Call Option at a higher strike (same expiry). This reduces your cost and risk.
📘 Example:
Buy Nifty 22500 Call at ₹100
Sell Nifty 23000 Call at ₹50
Your net cost = ₹50
Max profit = ₹500 (if Nifty ends above 23000)
✅ Pros:
Lower cost than naked Call
Defined risk and reward
❌ Cons:
Limited profit potential
✅ 4. Bear Put Spread
💡 Use When: You are moderately bearish.
You buy a Put at higher strike and sell another Put at lower strike. This is just like Bull Call, but for falling markets.
📘 Example:
Buy Bank Nifty 50000 Put at ₹120
Sell 49500 Put at ₹60
Net Cost = ₹60
Max Profit = ₹500
✅ Pros:
Risk-managed way to profit in downtrend
❌ Cons:
Limited profits if market crashes heavily
✅ 5. Iron Condor
💡 Use When: You expect the market to stay sideways or within a range.
It’s a neutral strategy involving four options:
Sell 1 lower Put, Buy 1 far lower Put
Sell 1 upper Call, Buy 1 far upper Call
📘 Example:
Sell 22500 Put
Buy 22200 Put
Sell 23000 Call
Buy 23300 Call
You receive a net premium. If the index stays between 22500–23000, you make full profit.
✅ Pros:
Profits in range-bound market
Low risk, fixed reward
❌ Cons:
Requires margin
Complicated setup
✅ 6. Straddle Strategy
💡 Use When: You expect a big move in either direction, but not sure which.
Buy both a Call and a Put at the same strike price and expiry. One side will definitely move.
📘 Example:
Buy Nifty 23000 Call at ₹80
Buy Nifty 23000 Put at ₹90
Total cost = ₹170
If Nifty makes a big move (up or down), one side can explode in value.
✅ Pros:
Unlimited potential if market breaks out
Great for news events
❌ Cons:
Expensive to enter
Needs big movement to profit
✅ 7. Strangle Strategy
💡 Use When: You expect a big move, but want to reduce cost compared to straddle.
Buy an Out-of-the-Money Call and Put.
📘 Example:
Buy Nifty 23200 Call at ₹40
Buy Nifty 22800 Put at ₹50
Total cost = ₹90
You still profit from big movement, but cheaper than a straddle.
✅ Pros:
Lower cost
Profits from big moves
❌ Cons:
Requires even larger movement than straddle
✅ 8. Short Straddle (for experts)
💡 Use When: You think the market will stay flat (low volatility).
Sell a Call and a Put at the same strike. You earn double premium.
⚠️ Risk: Unlimited risk if market moves too much!
This strategy is not for beginners. You need tight stop losses or hedges.
🔐 Risk Management Is Key
No matter which strategy you use:
Always define your maximum risk and reward.
Avoid taking naked positions without hedging.
Use stop losses and trailing SLs.
Don’t bet your whole capital – use position sizing.
Avoid trading right before major events unless you understand the risks.
Strangle
🤔 Real-Life Example (Simple Breakdown)
Let’s say the market is range-bound and Nifty is stuck between 22500–23000 for weeks. You can go with an Iron Condor:
Sell 22500 Put at ₹80
Buy 22200 Put at ₹40
Sell 23000 Call at ₹70
Buy 23300 Call at ₹35
Net Premium = ₹75
If Nifty expires between 22500–23000, you get full ₹75 profit per lot. If it breaks the range, losses are capped due to hedges.
💬 Final Thoughts
Options trading strategies are like different weapons in your trading arsenal. But using them without understanding or discipline is dangerous. Always know:
What is your market view?
What is your max risk?
How will you manage losses?
The smartest traders don’t gamble—they plan. They treat options like a business, not a lottery ticket.
So whether you’re trading with ₹5000 or ₹5 lakhs, always use a strategy with:
✔ Proper Risk-Reward
✔ Defined Exit Plan
✔ Strong Logic (not emotion)
BTCUSD 1D TimeframeBitcoin is trading near $117,800 – $118,400
It’s in a sideways consolidation zone after a strong uptrend
📊 Technical Summary
📈 Trend Direction:
Primary Trend: Bullish (long-term)
Short-Term Trend: Sideways to slightly bullish
Structure: Higher highs and higher lows still intact
🔍 Key Support & Resistance Levels
🟢 Support Zones:
$117,000 — Immediate support zone
$115,000 — Minor demand zone
$112,000 — Key swing low support
$108,000 – $110,000 — Strong base if correction deepens
🔴 Resistance Zones:
$119,000 — Current price ceiling
$121,000 — Breakout target
$123,000 – $125,000 — All-time high resistance area
🧠 Indicators Overview
📌 RSI (Relative Strength Index):
Around 58–60
Shows moderate bullishness — not overbought
📌 MACD (Moving Average Convergence Divergence):
MACD line above signal line, but momentum is weakening
Indicates potential slowing of bullish push
📌 Moving Averages:
20-day EMA: Below price — short-term support
50-day EMA: Also below — confirms mid-term uptrend
200-day EMA: Far below — strong long-term bullish signal
🕯️ Candlestick Behavior
Recent candles are small-bodied: suggests indecision
Wicks both sides: market waiting for next trigger
No bearish reversal patterns visible yet

SENSEX 1D TimeframeClosing Value: ₹81,463.09
Day Change: ▼ 721.08 points (−0.88%)
Opening Level: ₹82,065.76
Day's High: ₹82,069.51
Day's Low: ₹81,397.69
Intraday Range: ~₹672 points swing
🧭 Market Context
Sensex fell nearly 1% in a single session, indicating a short-term pullback or profit-booking.
The fall was led by major banking, IT, and financial stocks.
Broader market sentiment turned cautious amid weak domestic cues and global uncertainty.
Several heavyweight stocks saw sharp declines, with a few dropping more than 5% in a single day.
🕵️♂️ Technical Perspective (1D Timeframe)
The daily candle likely formed a strong bearish body, signaling selling pressure.
The index is still trading well above its key moving averages (e.g., 50-day, 200-day), but this drop shows possible reversal signals.
Immediate support lies around ₹81,200–81,000, while resistance remains near the ₹82,500–83,000 zone.
🔍 Outlook Ahead
If weakness continues, the index may retest the ₹80,500–81,000 range.
A rebound above ₹82,000 with volume could reignite bullish sentiment.
Keep an eye on FII/DII flows, global indices, and upcoming earnings for direction.

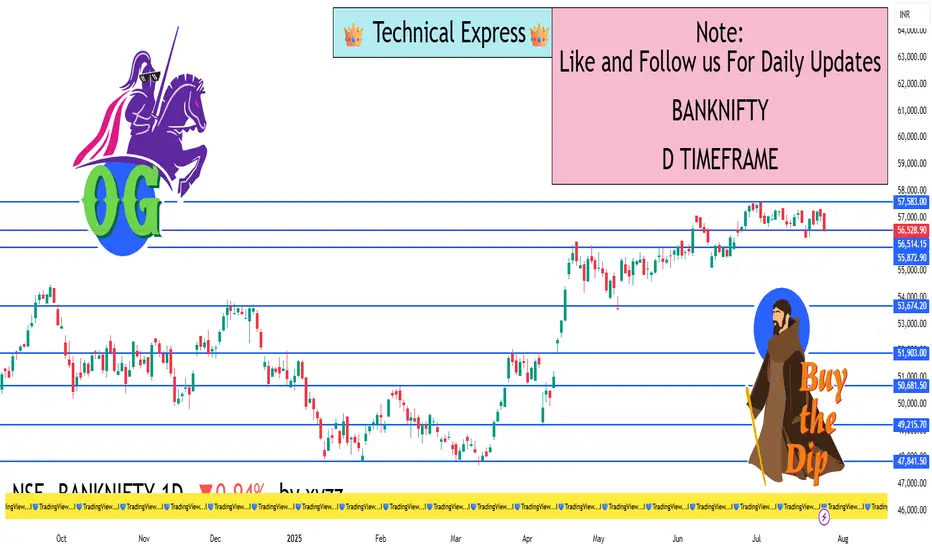
BANKNIFTY 1D TimeframeClosing Price: ₹56,528.90
Opening Price: ₹57,113.90
Day High: ₹57,170.70
Day Low: ₹56,439.40
Net Change: –₹537.15 (–0.94%)
🔹 Key Price Levels
📉 Support Zones:
Support 1 (S1): ₹56,255
Support 2 (S2): ₹55,982
Support 3 (S3): ₹55,524
Fibonacci Support Zone: ₹56,260 – ₹56,430
Camarilla Support Levels: ₹56,460 / ₹56,395 / ₹56,328
📈 Resistance Zones:
Resistance 1 (R1): ₹56,987
Resistance 2 (R2): ₹57,444
Resistance 3 (R3): ₹57,718
Fibonacci Resistance Zone: ₹56,992 – ₹57,165
Camarilla Resistance Levels: ₹56,596 / ₹56,663 / ₹56,730
🔸 Pivot Point (Central Level): ₹56,713
🔹 Trend Direction (1-Day Timeframe)
📊 Short-Term Trend: Consolidating with mild bearish pressure.
📉 Price closed below pivot point (₹56,713), signaling short-term weakness.
✅ Still within bullish structure as long as it holds above ₹55,980 – ₹56,000.
🔹 Technical Indicator Snapshot
RSI: Around 58 → Still in bullish territory, but momentum cooling.
MACD: Positive crossover, but histogram flattening — sign of range or pause.
20 EMA: Near ₹57,000 → Price is currently below this level.
50 EMA: Around ₹55,500 → Still acts as major support.
Price Action: Forming inside candles → Indicates compression/indecision.
Learn Advanced Institutional Trading🏛️ Learn Advanced Institutional Trading
Step into the world of professional-level trading and master how institutions control the markets.
This advanced level dives deep into:
Market Structure Mastery – Spot trends, breakouts & manipulation zones
Smart Money Tactics – Learn how big players accumulate & distribute silently
Volume & Liquidity Zones – Trade where institutions trade
Precision-Based Entries – No noise, just logic
Risk Management Systems – Protect capital like a pro
Avoid Retail Traps – Outsmart fakeouts, stop hunts & emotional trades
Whether you're trading options, futures, or intraday levels—this training gives you the edge to follow the real money and make consistent, calculated moves.
📌 Upgrade your strategy. Trade with purpose. Win like institutions.

Institutional Trading🏛️ Institutional Trading 📊
Trade Like the Smart Money
Institutional Trading refers to the high-volume, data-driven buying and selling of financial assets by large entities such as hedge funds, banks, mutual funds, insurance companies, pension funds, and proprietary trading firms. Unlike retail traders, institutional traders have access to advanced tools, deep liquidity, insider networks, and strategic research that give them a significant edge in the market.
These market participants don’t chase price—they move it. Their trades are structured, well-researched, and often hidden from the public eye through techniques like iceberg orders, dark pools, and algorithmic execution.
🔍 Key Features of Institutional Trading:
✅ Volume & Scale: Trades are executed in massive quantities, often spread across multiple venues to avoid detection.
✅ Market Influence: Institutions drive trends and liquidity. Their positioning can define entire market cycles.
✅ Strategic Execution: Every move is planned, including accumulation, distribution, and fakeouts to trap retail participants.
✅ Advanced Tools: They use sophisticated algorithms, AI-based models, high-frequency data, and institutional-grade charting.
✅ Focus on Risk-Reward: Strict risk management and portfolio balancing govern every trade decision.
🚀 Elevate Your Trading:
Learning Institutional Trading isn’t about copying big players—it’s about thinking like them, reading the market through their lens, and upgrading your strategy with smart money logic.
📈 Trade with structure. Trade with logic. Trade like an institution.
