TATASTEEL C&H WEEKLY BREAKOUTTatasteel breaking c&h pattern weekly basis
trading at ATH,metal sector doing well
good volume last few weeks
RSI above 60,macd crossover seen
immediate target 206,after breaking 206 can lead toward 227
NO BUY/SELL RECOMENDATION
Tatasteel

Tata Steel (D): Bullish (Sector-Backed Breakout Attempt)Timeframe: Daily | Scale: Linear
The stock is challenging the upper boundary of its 2-year consolidation phase, trading just below the critical ₹187.85 (ATH) resistance. The move is supported by a "Bullish Island" gap and a strong sector-wide rally.
🚀 1. The Fundamental Catalyst (The "Why")
The surge is driven by sectoral strength and operational updates:
> Sector Rally: The Nifty Metal Index rallied ~2% today, acting as a tailwind for Tata Steel.
> Production Update: The market is reacting positively to the recent Q3 FY26 Production Update (released Jan 7), where the company reported steady volumes despite global headwinds, signaling resilience.
📈 2. The Chart Structure (Island & Resistance)
> The "Island" Gap: Pattern formed since Dec 31.
- The Formation: The stock gapped up from ₹175.80 to ₹180 on Dec 31 and has stayed above this gap. This created a "Bullish Breakaway Gap" , leaving the previous consolidation (₹170-175) isolated as an "island" of trapped sellers.
> The Resistance (The "Lid"): The horizontal resistance is specifically the ₹187 – ₹188 zone (The All-Time High / 52-Week High).
- Current Status: Closing at ₹183.30 , the stock is knocking on the door of this final barrier.
📊 3. Volume & Indicators
> Volume Profile: While today's volume (25.78 M) is good, the Dec 31 Volume (50 M+) was the real "Ignition Day." The drying volume during the consolidation (before Dec 31) followed by these spikes confirms accumulation.
> Momentum:
- RSI: Rising in all timeframes, confirming synchronized momentum.
- EMAs: The Positive Crossover (PCO) aligns with the "Island" gap, confirming the trend is up.
🎯 4. Future Scenarios & Key Levels
The stock is primed for a "Blue Sky" breakout.
🐂 Bullish Target (Blue Sky):
- Trigger: A decisive Daily Close above ₹188 .
- Target 1: ₹212 .
- Target 2: ₹225 . (Psychological level).
🛡️ Support (The Safety Net):
- Immediate Support: ₹177 – ₹180 . The "Gap Zone" from Dec 31. The stock must stay above ₹180 to keep the "Island" valid.
- Stop Loss: A close below ₹175 would "fill the gap" and invalidate the bullish momentum.
Conclusion
This is a High-Quality Setup .
> Refinement: The "Island Gap" at ₹180 is the new floor.
> Strategy: The breakout is imminent. Watch for a high-volume close above ₹188 to confirm the run to ₹212 .

TATASTEEL | Weekly Chart | Breakout SetupTata Steel has shown a clear shift in market structure on the weekly chart. After spending several months in a broad consolidation phase, price has now broken above a major supply/resistance zone, indicating improving sentiment and possible trend continuation.
🔍 Price Structure & Trend Analysis
The stock was earlier trapped in a range between ₹150–160, acting as a strong supply zone.
Multiple rejections from this zone confirmed heavy distribution in the past.
Recent price action shows a decisive breakout with strong weekly closing, confirming acceptance above resistance.
The market has transitioned from distribution → accumulation → markup phase.
📐 Support & Resistance Mapping
Major Support Zone: ₹168 – ₹170
(Previous resistance now turning into demand — classic role reversal)
Intermediate Support: ₹160 (EMA cluster + price base)
Immediate Resistance: ₹185 (current price acceptance zone)
Upside Target Zone: ₹215 – ₹220
(Next weekly supply and measured move projection)
📈 Moving Average Structure
Price is trading above short-term and medium-term EMAs, reflecting bullish momentum.
EMAs are sloping upward, indicating trend strength rather than a dead-cat bounce.
Pullbacks towards EMAs are likely to act as dynamic support.
🔁 Retest & Risk Perspective
A healthy retest of the ₹168–170 zone would strengthen the breakout reliability.
Sustained trade below ₹160 would weaken the bullish structure and invalidate the breakout thesis.
As long as price holds above prior resistance, trend continuation remains the higher probability scenario.
🎯 Trade Planning Framework (Educational)
Bias: Bullish above ₹168
Opportunity Zone: Retest or consolidation above breakout level
Invalidation: Weekly close below ₹160
Trend Target: ₹215 – ₹220 (medium-term)
🧠 Big Picture Takeaway
This is a classic weekly breakout setup with:
✔ Strong structure
✔ Clear role reversal
✔ EMA alignment
✔ Defined risk levels
If volume expands on continuation, Tata Steel could enter a sustained markup phase rather than a short-term spike.

Tata Steel Coup & Handle Pattern Target Rs 300Tata Steel has recently drawn significant attention from technical analysts due to the emergence of a multi-year Cup and Handle pattern on its long-term charts. As of January 1, 2026, the stock is trading around ₹181, hovering near its 52-week high of ₹187.
Here is a detailed breakdown of the technical setup, the logic behind the ₹300 target, and the key levels to watch.
1. The Technical Setup: Cup and Handle A "Cup and Handle" is a bullish continuation pattern that typically marks a period of consolidation followed by a breakout.
The Cup: This was formed over several years (starting roughly around the 2021 peaks), where the price underwent a deep correction followed by a gradual, rounded recovery back to the previous resistance zone (₹170–₹180).
The Handle: After reaching the "lip" of the cup, the stock faced resistance and consolidated in a smaller range (the handle). The recent breakout from this handle (above ₹170–₹175) confirms the resumption of the uptrend.
Logic: $Target = \text{Breakout Level} + (\text{Breakout Level} - \text{Bottom of the Cup})
Analysis: If the breakout level is considered to be around ₹170–₹180 and the base of the cup was established in the ₹80–₹90 range during the 2022/2023 correction, the vertical depth is roughly ₹90–₹100.
Projected Target: Adding that depth to the breakout level gives a long-term technical target of ₹270 to ₹300.
3. Key Financial & Fundamental Drivers Technical patterns rarely work in a vacuum. For Tata Steel, several factors support this bullish view:
Capacity Expansion: The company is on track to increase domestic steelmaking capacity to 30 MnTPA by 2025–2026.
Earnings Growth: Analysts estimate a significant jump in EPS for FY26 (projected growth of over 200% by some estimates), driven by falling raw material costs (coking coal) and higher operational efficiency in the UK and Netherlands plants.
Dividend Yield: Maintaining a healthy payout (approx. 2%) provides a cushion for long-term investors during the journey to the target.
Note: Research is only for education purpose, don't trade bliendly. Technical targets are projections and not guarantees. Steel is a cyclical industry highly sensitive to global demand and Chinese export policies.

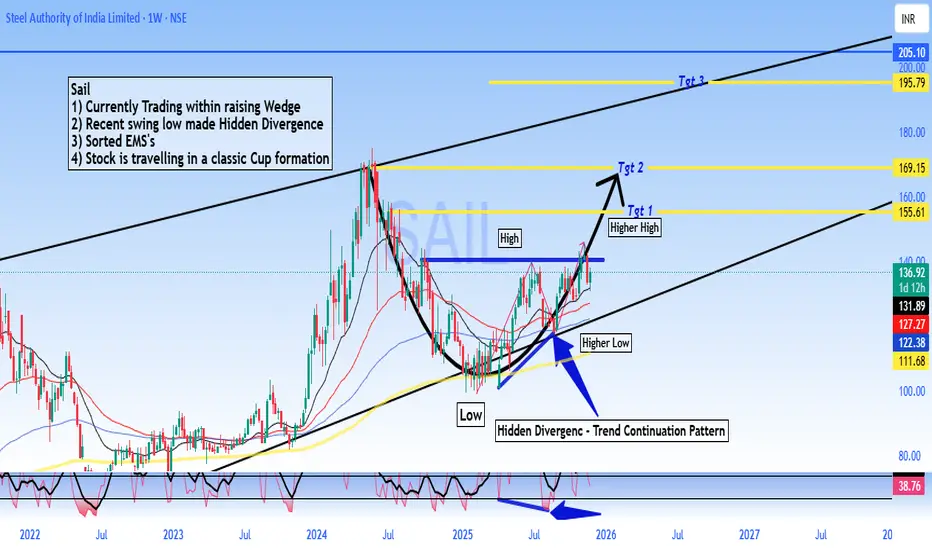
SAIL - Buy - Technical Analysis# Steel Authority of India Limited (SAIL) - Technical Analysis Report
Current Price: 136.92
Timeframe: Weekly Chart Analysis
Technical Setup Overview
SAIL is presenting a compelling technical picture with multiple bullish indicators aligning for a potential significant upward move. The stock is currently trading within a well-defined rising wedge pattern and has recently formed a **Hidden Divergence** on the weekly chart - a classic trend continuation signal.
Key Technical Observations
Rising Wedge Pattern:
The stock is trading within a rising wedge formation, which typically indicates consolidation before a breakout. The current price action suggests the stock is in the later stages of this pattern.
Hidden Divergence - Bullish Continuation Signal:
A **Hidden Divergence** has formed on the weekly timeframe.
- This pattern typically signals trend continuation and suggests the uptrend is likely to resume with strength
Sorted EMA Structure:
The Exponential Moving Averages are properly aligned, indicating a healthy bullish trend structure with multiple moving averages providing dynamic support.
Cup Formation in Progress:
The stock appears to be carving out a **classic Cup pattern**, which is a well-known bullish continuation formation. This pattern suggests accumulation and potential for a significant breakout move.
Price Targets & Projections
Based on the technical structure, here are the potential price targets:
Target 1: 155.61 (Higher High breakout level)
Target 2: 169.15
Target 3: 195.79
These targets are derived from the pattern structure and represent key resistance zones where profit-taking may occur.
Trading Strategy Considerations
For Swing Traders:
- Current levels offer a potential entry opportunity for medium to long-term positions
- A move above ₹140 could confirm the continuation pattern
- Stop loss can be placed below the recent higher low at 122 for risk management
Risk Factors to Monitor
- Failure to hold above ₹122 would invalidate the bullish hidden divergence
- Breakdown below the rising wedge support would change the outlook
- Sector performance and broader market conditions should be monitored
- Steel industry fundamentals and commodity price trends
🔔 Conclusion
SAIL is exhibiting strong technical characteristics with the Hidden Divergence pattern, sorted EMA structure, and cup formation all pointing toward potential upside. The current price action within the rising wedge presents an interesting risk-reward setup for traders and investors with appropriate risk management.
DISCLAIMER
This analysis is for educational and informational purposes only and should NOT be considered as investment advice or a recommendation to buy, sell, or hold any securities. - I am not a SEBI registered analyst or investment advisor - This is purely a technical analysis based on chart patterns and indicators - Past performance and technical patterns do not guarantee future results - Trading and investing in stocks involves substantial risk of loss - Always conduct your own research and due diligence before making any investment decisions - Consult with a qualified financial advisor before taking any investment positions - The author holds no responsibility for any profits or losses incurred based on this analysis - Risk management and position sizing are crucial - never invest more than you can afford to lose
**Trade/Invest at your own risk. Do your own analysis.**
#SAIL #SteelAuthorityOfIndia #StockMarket #TechnicalAnalysis #NSE #IndianStocks #ChartAnalysis #TradingView #StockTrading #HiddenDivergence #CupPattern #PriceAction #SwingTrading #Investing #MarketAnalysis #SteelSector #Commodities #TradingStrategy #ChartPatterns #TechnicalIndicators
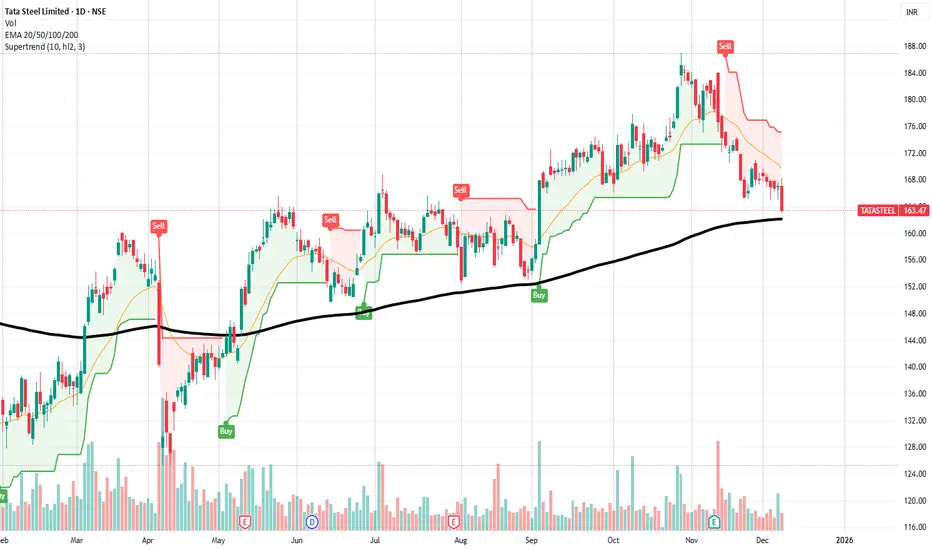
Tata Steel | 200 EMA Support + MACD Bullish Setup | Perfect std.Tata Steel has entered a high-probability reversal zone, combining multiple technical signals that traders often use to identify strong opportunities.
1. Price Sitting Exactly on 200 EMA (Major Trend Support)
The stock has reached the 200 EMA, a long-term trend indicator that acts as strong dynamic support.
From the chart, the last 3 touches to the 200 EMA (May, June & September) resulted in sharp upward reversals.
This increases the probability that buyers may step in again at this level.
------------------------------------------------------------------
2. MACD Close to Bullish Crossover
The MACD histogram is reducing red bars and is moving toward the zero line, indicating that selling pressure is cooling down.
A bullish crossover near a major support often marks the beginning of an upswing in momentum.
------------------------------------------------------------------
3. Stock Appears Short-Term Oversold
Price is stretched away from the short-term moving averages (20 & 50 EMA), and recent candles show slowing selling pressure.
This supports the idea of a bounce or trend reversal from the current zone.
------------------------------------------------------------------
4. Supertrend Still in Sell but Losing Momentum
Supertrend remains red, but the fall has slowed significantly.
A close above 170–172 will flip Supertrend to Buy, confirming the reversal.
Support Zones
162–164 → 200 EMA support zone
158 → Last horizontal support (critical)
Resistance Zones
170 → Short-term resistance (20 EMA)
176–178 → Strong reversal confirmation zone
185 → Major swing resistance
📈 Possible Bullish Scenario (Primary View)
If the price holds above 162–164 and MACD turns positive:
Targets: 170 | 176–178 | 185 | Stop-loss: Below 160 (Daily close)
📝 Notes (Important for Traders)
This is a technical analysis idea, not a buy/sell recommendation.
Risk management is important: adjust SL according to your trading style.
Trading with Volume1. What is Volume in Trading?
Volume is the total number of shares, contracts, or lots traded in a market during a particular period. Every time a buyer and seller make a transaction, it adds to the volume count.
For example:
If 10,00,000 shares of a stock are bought and sold during a day, that stock’s daily volume is 10 lakh.
If Bitcoin has 50,000 transactions in a 1-hour timeframe, that is its hourly volume.
Volume acts as the pulse of the market. When market participants are active, volume increases. When they lose interest, volume shrinks.
2. Why is Volume Important for Traders?
Volume helps traders answer critical questions:
a. Is the trend strong or weak?
A price trend supported by high volume is considered trustworthy. A trend on low volume is often weak and may collapse.
b. Is the breakout real or fake?
Strong volume during breakouts confirms genuine market interest. Low-volume breakouts often fail.
c. Is a reversal coming?
Volume spikes at tops or bottoms often indicate exhaustion and potential reversal.
d. Where are big players active?
Institutional traders like banks, funds, and smart money leave “footprints” through volume surges.
Thus, volume is a confirmation tool that helps traders avoid traps and make informed decisions.
3. Understanding Volume in Different Market Conditions
a. Volume in Uptrends
When volume rises along with price, the uptrend is considered healthy. Buyers are active and willing to buy at higher levels.
Signs of strong uptrend:
Price ↑ and Volume ↑ → Strong bullish trend
Pullback with low volume → Healthy correction
Signs of weakening uptrend:
Price ↑ but Volume ↓ → Weak trend, risk of reversal
b. Volume in Downtrends
In downtrends, high volume indicates strong selling pressure.
Strong downtrend signals:
Price ↓ and Volume ↑ → Strong bearish trend
Pullback with low volume → Continuation likely
Weak downtrend signals:
Price ↓ but Volume ↓ → Bear trend losing strength
c. Volume in Ranging Markets
In sideways markets, volume generally remains low. A sudden volume spike during range breakout signals trend formation.
4. How to Use Volume for Trading – Practical Techniques
Technique 1: Volume Breakout Trading
Breakouts are powerful signals but also come with fake moves. Volume confirms the authenticity.
Bullish breakout confirmation:
Price breaks resistance
Volume rises above average
Candle closes above breakout level
Bearish breakout confirmation:
Price breaks support
Volume spikes downward
Close is below the support level
Without volume confirmation, breakouts often fail and trap traders.
Technique 2: Volume Divergence
Divergence occurs when price and volume move opposite.
Examples:
Price making higher highs but volume making lower highs → Bullish trend weakening
Price making lower lows but volume decreasing → Bearish trend weakening
Such divergence often signals trend reversal.
Technique 3: Volume Spike Analysis
Sudden large volume spikes can mean:
A big player entering or exiting a position
Market turning point
Start of strong trend
At market bottoms, huge buying volume often appears. At tops, big selling volume may signal reversal.
Technique 4: Using Volume with Indicators
Some popular volume-based indicators:
a. Volume Moving Average (VMA)
Shows average volume to identify when current volume is unusually high or low.
b. On-Balance Volume (OBV)
Adds volume on up days, subtracts on down days to show accumulation/distribution.
c. Volume Weighted Average Price (VWAP)
Used by institutional traders; shows average price weighted by volume.
d. Money Flow Index (MFI)
Combines price and volume to detect overbought/oversold zones.
Using these indicators with price action increases trading accuracy.
5. Volume and Candlestick Patterns
Volume adds strength to candlestick signals.
Examples:
Bullish engulfing with high volume → Strong reversal
Hammer with high volume at support → Buyers entering
Doji with high volume → Indecision among big players
Volume validates candlestick reliability.
6. Volume and Support/Resistance Levels
Support and resistance zones are crucial. Volume helps confirm their strength.
At Support:
Price touches support with low volume → Support likely to hold
Price breaks support with high volume → Strong breakdown
At Resistance:
Price hits resistance with low volume → Resistance holding
Breaks resistance with high volume → Breakout confirmed
Volume acts as the deciding factor in whether levels hold or break.
7. How Smart Money Uses Volume
Institutional traders use volume to accumulate or distribute positions quietly.
Accumulation phase:
Price stays in range
Volume gradually increases
No big price movement
This indicates smart money buying.
Distribution phase:
Price stops rising
Volume spikes at peaks
Smart money selling to retail traders
Recognizing these phases helps traders identify big trends early.
8. Common Mistakes Traders Make with Volume
a. Believing every volume spike means breakout
Volume should be analyzed with price action, not in isolation.
b. Ignoring trend context
High volume in a range is meaningless unless combined with price breakout.
c. Misreading low-volume pullbacks
These are actually healthy for trends, not signs of weakness.
d. Trading without confirming volume
Entering trades based on price alone increases risk.
9. Best Practices for Volume Trading
Compare volume with average volume, not previous candles
Combine volume with trendlines, levels, and patterns
Avoid trading false breakouts without volume confirmation
Watch volume at key supports/resistances
Use volume indicators only as a supplement
Focus on multi-timeframe volume behavior
These practices significantly improve trading accuracy.
Conclusion
Trading with volume gives traders an edge by revealing the hidden strength behind price movements. Volume confirms trends, validates breakouts, identifies reversals, and exposes the actions of big players. When used correctly with price action, support/resistance, and technical indicators, volume becomes one of the most reliable tools in trading. For both beginners and advanced traders, mastering volume analysis is essential for smart, confident, and profitable trading decisions.
Consumption Trends Unveiled1. Digital-First Consumer Behavior
One of the most significant modern trends is the shift toward digital-first consumption. With widespread internet accessibility and smartphone use, consumers increasingly prefer online channels for shopping, content consumption, financial transactions, and communication.
E-commerce has become a dominant retail model. Consumers now expect convenience, instant access to products, and seamless delivery systems. Online marketplaces are expanding rapidly due to personalized recommendations, competitive pricing, and wider product varieties. Additionally, social commerce—shopping directly through social media platforms—is gaining momentum, especially among younger generations who trust peer reviews and influencer endorsements.
Beyond retail, digital consumption includes streaming platforms for entertainment, digital banking, telemedicine, and online education. Every sector is witnessing a digital transformation as consumers adopt technology for efficiency, comfort, and lower costs.
2. Personalization and Customization
Modern consumers crave personalization. They want experiences, products, and services tailored specifically to their preferences. This trend is driven by AI-powered recommendation engines, data-driven marketing, and a deeper understanding of customer behavior.
Companies are using analytics to segment consumers based on browsing patterns, purchase history, lifestyle choices, and social media behavior. Personalized subscription boxes, curated shopping experiences, customized nutrition plans, and smart home devices that learn user habits are prime examples.
Moreover, consumers are increasingly involved in the creation process. Brands that offer customizable options—such as personalized shoes, tailored skincare, or adjustable meal plans—gain a competitive edge. Personalization not only enhances customer satisfaction but also builds strong brand loyalty.
3. Sustainability and Conscious Consumption
Environmental awareness is reshaping global consumption patterns. Today’s consumers, particularly Millennials and Gen Z, are more conscious of climate change, resource scarcity, and environmental impact. This has led to the rise of eco-friendly products, sustainable packaging, and ethical manufacturing.
Consumers prefer brands that adopt green practices, source responsibly, and maintain transparency in their supply chains. The shift toward plant-based foods, renewable energy products, slow fashion, and biodegradable items reflects this growing eco-conscious mindset.
Secondhand marketplaces, recycling initiatives, and circular economy models (where products are reused, refurbished, or recycled) are also becoming mainstream. As sustainability influences purchasing decisions, companies must adapt to remain relevant and trustworthy.
4. Health, Wellness, and Holistic Living
Health and wellness have evolved from niche trends to global consumption drivers. Consumers increasingly prioritize physical fitness, mental well-being, and preventive healthcare. This shift accelerated due to the pandemic, which heightened awareness of health risks.
Demand for nutrition-rich foods, organic products, immunity-boosting supplements, and wellness services has surged. Fitness apps, wearable devices, and virtual workout platforms have gained popularity due to convenience and personalization.
Mental health has also emerged as a key focus, with consumers seeking mindfulness apps, relaxation products, therapy services, and work-life balance solutions. The wellness economy has expanded to include sleep technology, ergonomic home products, and wellness tourism.
5. Experience-Driven Consumption
Another major trend is the shift from product ownership to experience-driven consumption. Consumers now value memorable experiences—travel, entertainment, dining, adventure, and cultural activities—over material possessions.
The “experience economy” is thriving:
Travel and tourism industries focus on curated, immersive experiences.
Restaurants emphasize unique concepts and ambiance.
Events, festivals, and pop-up activities attract large audiences.
Virtual reality and augmented reality are creating new entertainment formats.
Younger consumers especially prioritize experiences that reflect self-expression and social identity. Sharing experiences online amplifies this trend, as people seek activities that are “social media worthy.”
6. Rise of Subscription-Based Models
Subscription services have grown exponentially across various industries. Consumers prefer ongoing access over one-time purchases because subscriptions offer convenience, value, and regular upgrades.
Popular examples include:
Streaming platforms like Netflix and Spotify
Subscription boxes for beauty, fashion, and fitness
Cloud storage and software services
Meal kits and grocery subscriptions
Auto-subscription for household essentials
Businesses benefit from predictable revenue streams, while consumers enjoy flexibility, personalization, and frequent content or product updates.
7. Other Emerging Trends
The Sharing Economy
Consumers increasingly participate in shared consumption models, such as ride-sharing, coworking spaces, community rentals, and shared mobility solutions. This trend reduces ownership costs and supports sustainability.
Localism and Hyper-Localization
Many consumers prefer locally produced goods due to their freshness, authenticity, and community support. Pandemic-driven supply chain disruptions accelerated this trend.
Financial Consciousness
Economic uncertainty has made consumers more value-driven. They seek discounts, compare prices across platforms, and prioritize financial planning tools. Buy Now Pay Later (BNPL) services, digital wallets, and micro-investing platforms are growing.
8. Drivers Behind Changing Consumption Patterns
Several key forces are influencing modern consumption trends:
Technological Advancements
AI, machine learning, IoT, and big data have transformed how businesses understand and target consumers.
Demographic Shifts
A younger, tech-savvy generation is reshaping consumption priorities, while aging populations create demand for healthcare services and age-friendly products.
Globalization
Consumers have access to global brands, ideas, and experiences, leading to diverse preferences.
Socioeconomic Changes
Rising incomes in developing nations and middle-class expansion influence spending power and lifestyle aspirations.
Cultural Evolution
Social media, global trends, and peer influence redefine consumption norms and expectations.
9. Implications for Businesses and Markets
Understanding consumption trends is critical for companies to stay competitive. Businesses must:
Adopt digital-first strategies
Enhance personalization efforts
Focus on sustainability
Innovate new customer experiences
Strengthen e-commerce capabilities
Build trust through transparency
Offer flexible subscription or hybrid models
Companies that fail to recognize these changes risk losing relevance in an economy driven by dynamic consumer expectations.
Conclusion
Consumption trends today are shaped by a combination of technology, demographics, values, and global economic shifts. As consumers evolve, businesses must rethink their strategies, products, and services to meet emerging demands. The future will belong to organizations that understand their customers deeply, innovate continuously, and prioritize sustainability, personalization, and digital transformation.
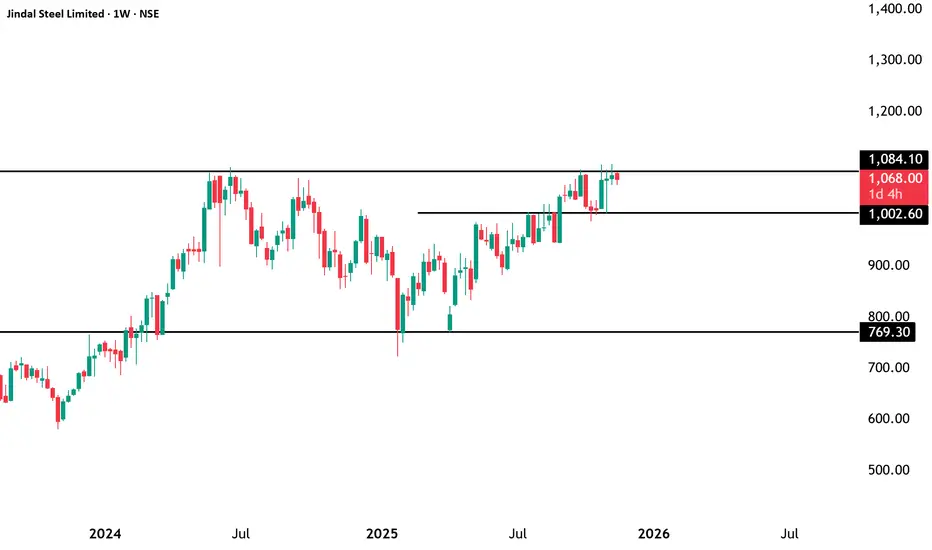
JSPL: Steeling Up for a Breakout MoveNSE:JINDALSTEL
======================================
1. Technical Analysis (Chart)
======================================
Trend: Strong Bullish (Higher Highs, Higher Lows).
Breakout Zone: ₹1,084. A weekly close above this enters uncharted territory (Blue Sky Zone).
Immediate Support: ₹1,002. The trend remains positive as long as the price holds above this.
Major Support: ₹770. Best accumulation zone for long-term investors.
Price Action: Currently consolidating at the top. A "Red Candle" at resistance suggests minor profit booking before the next leg up.
======================================
2. Fundamental Analysis (Q2 FY26 Data)
======================================
Recent Earnings: Weak. Net Profit fell ~26% YoY to ₹635 Cr due to higher input costs, though Revenue was stable at ₹13,505 Cr.
Valuation: Expensive. Trading at a P/E of ~39x (vs Industry ~20x). The market is pricing in future growth, leaving little room for error.
Margins: Compressed to ~17-18% (down from ~24%).
Debt: Controlled. Net Debt reduced to ~₹14,156 Cr, showing good balance sheet discipline despite heavy Capex.
======================================
3. Future Growth (The "Why" to Buy)
======================================
Angul Expansion: Capacity recently jumped from 6 MTPA to ~12.6 MTPA. This volume doubling is the key revenue driver for FY26-27.
Product Shift: Moving to Flat Steel (Hot Strip Mill). This commands higher margins than construction steel.
Raw Material Security: Owns captive coal mines (Utkal-C), protecting it from global coal price shocks better than peers.
2030 Vision: Aiming for 25 MTPA capacity, targeting to be the world’s largest single-location steel plant.
⚠️ Disclaimer:
This analysis is for educational and informational purposes only.
We are not SEBI-registered analysts or advisors.
This is our personal view based on available data and market trends.
Please consult your SEBI-registered investment advisor before making any investment or trading decisions.
You are solely responsible for any financial decisions you make based on this content.
========================
Trade Secrets By Pratik
========================
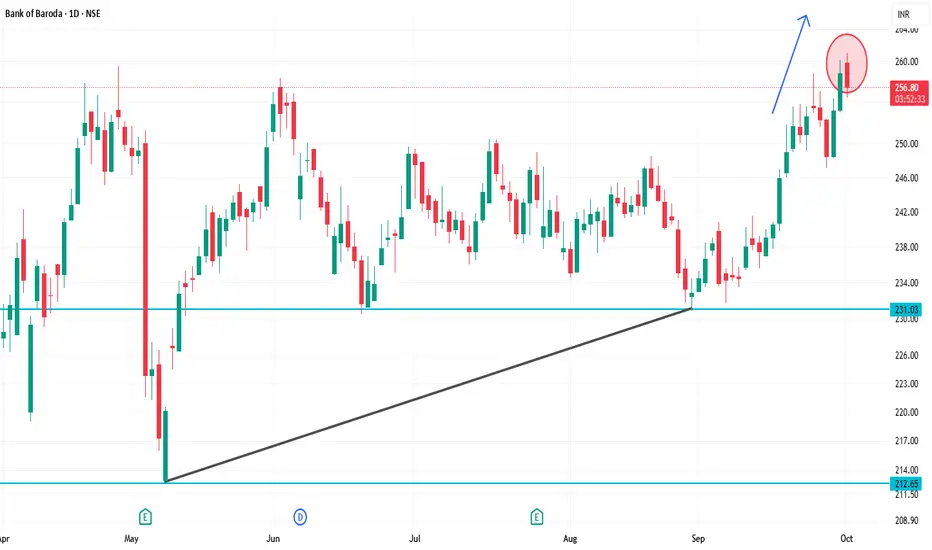
BANKBARODA 1D Time frameClosing Price: ₹257.60
Day Range: ₹253.70 – ₹260.00
Previous Close: ₹258.54
📉 Trend Analysis
Short-Term Trend: Bearish — The stock is trading below key moving averages, confirming the bearish trend.
Medium-Term Trend: Neutral — The stock is in a consolidation phase, characterized by lower highs and lower lows.
Long-Term Trend: Neutral — No significant trend identified; the stock is trading within a range.
🔮 Conclusion
Bank of Baroda is in a bearish trend with weak momentum.
Break below ₹250.00 could lead to further decline toward ₹245.00.
Break above ₹265.00 would indicate a potential trend reversal.
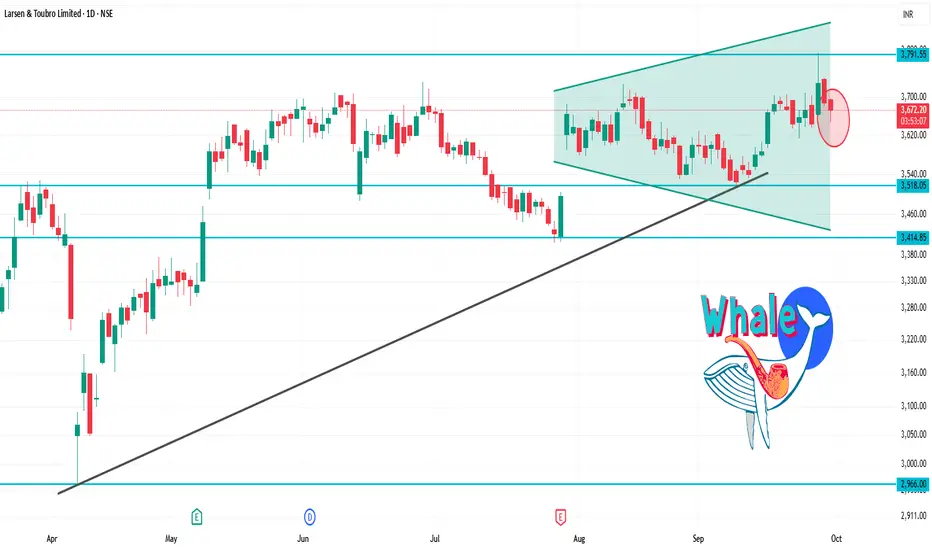
LT 1D Time frameCurrent Price: ₹3,655.30
Day’s Range: ₹3,648.00 – ₹3,696.60
52-Week Range: ₹2,965.30 – ₹3,963.50
Technical Indicators
RSI (14-day): 41.19 — indicates a neutral to slightly bearish momentum.
MACD: -1.47 — suggests bearish momentum.
Moving Averages: Mixed signals — short-term averages are bearish, while long-term averages are bullish.
Technical Summary: Predominantly Sell signals across various indicators.
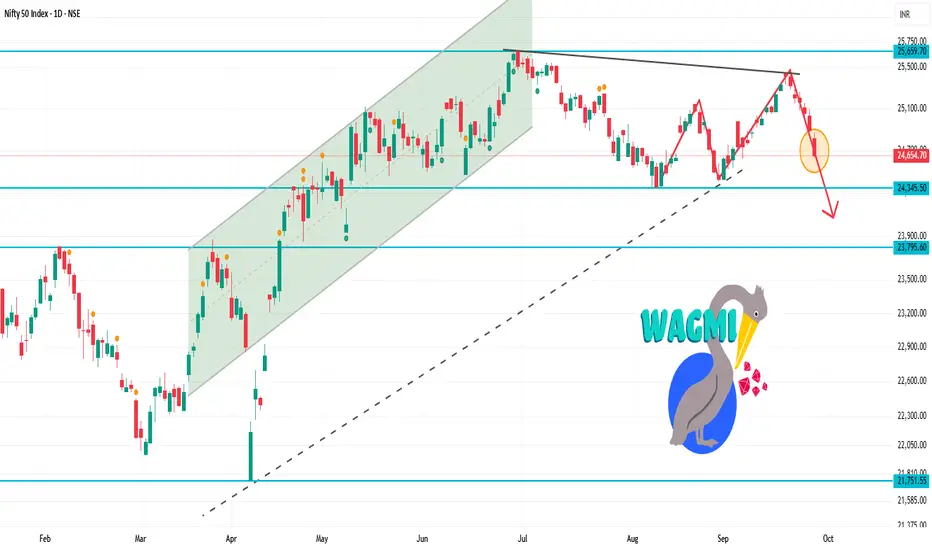
NIFTY 1D Time framePrevious Close: 24,889
Today Open: 24,819
Day’s High: 24,869
Day’s Low: 24,629
Current / Last Price: around 24,655
⚡ Strategy
Bullish Plan:
Buy near 24,550 – 24,600 with SL below 24,300.
Targets: 24,700 → 24,800 → 24,900.
Bearish Plan:
If price breaks below 24,300, expect weakness toward 24,100 – 24,000.
Part 2 Candle Stick PatternParticipants in Options Trading
Options markets consist of four main participants:
Buyers of Calls – Expect the underlying asset’s price to rise. Risk limited to premium.
Buyers of Puts – Expect the underlying asset’s price to fall. Risk limited to premium.
Sellers (Writers) of Calls – Expect prices to remain below the strike price. Risk is theoretically unlimited for naked calls.
Sellers (Writers) of Puts – Expect prices to remain above the strike price. Risk is substantial if the asset falls sharply.
Options Strategies
Option trading is highly versatile. Traders can employ strategies ranging from conservative hedging to speculative bets:
Covered Call: Holding the underlying asset while selling call options to generate income from premiums.
Protective Put: Buying puts while holding the asset to protect against downside risk.
Straddle: Buying a call and a put with the same strike price and expiration, expecting high volatility.
Strangle: Buying out-of-the-money call and put options for lower cost but with a wider price movement range.
Spreads: Combining multiple options to limit risk and potential profit (e.g., bull call spread, bear put spread).
Option Pricing Factors
Option prices are influenced by several variables:
Underlying Asset Price: Higher asset prices increase call values and decrease put values.
Strike Price: The proximity of the strike to the current asset price affects intrinsic value.
Time to Expiration: More time increases time value and option price.
Volatility: Greater market volatility increases the likelihood of significant price changes, raising premiums.
Interest Rates & Dividends: Rising interest rates increase call values and reduce put values; dividend payouts impact stock options.
The most widely used pricing model is the Black-Scholes Model, which calculates theoretical option prices based on these factors.
Advantages of Option Trading
Leverage: Control a larger position with a smaller capital outlay.
Hedging: Protect portfolios against adverse price movements.
Flexibility: Execute a wide range of strategies for bullish, bearish, or neutral markets.
Defined Risk: Maximum loss for buyers is limited to the premium paid.
Profit in Any Market: Options allow for profit in rising, falling, or sideways markets.
Risks of Option Trading
Options are complex and involve risks:
Premium Loss: Buyers can lose the entire premium if the option expires worthless.
Leverage Risk: While leverage amplifies gains, it also amplifies losses for sellers or advanced strategies.
Time Decay (Theta): Options lose value as expiration nears if the underlying price does not move favorably.
Volatility Risk (Vega): Changes in market volatility affect option prices.
Complexity: Advanced strategies can involve multiple positions and require careful monitoring.

Part 1 Candle Stick Pattern Understanding Option Trading
Option trading is a segment of financial markets that allows investors to buy or sell the right to buy or sell an underlying asset at a predetermined price within a specific time frame. Unlike traditional stock trading, options provide leverage, flexibility, and risk management tools, making them appealing for both hedging and speculative purposes.
Options are derivatives, meaning their value is derived from an underlying asset, such as stocks, indices, commodities, or currencies. An option does not grant ownership of the asset itself but gives the holder the right to engage in a transaction involving the asset.
Types of Options
Options are broadly categorized into two types:
Call Options
A call option gives the buyer the right (but not the obligation) to buy the underlying asset at a specified price, called the strike price, before or on the expiration date.
Buyers of call options generally expect the underlying asset’s price to rise, allowing them to purchase the asset at a lower price than the market value.
Sellers (writers) of call options receive the option premium upfront but take on the obligation to sell the asset if the buyer exercises the option.
Put Options
A put option gives the buyer the right (but not the obligation) to sell the underlying asset at the strike price before or on the expiration date.
Buyers of put options generally expect the underlying asset’s price to fall, allowing them to sell the asset at a higher price than the market value.
Sellers of put options receive the premium but face the obligation to buy the asset if exercised.
Key Components of Options
To understand option trading, one must know the following components:
Underlying Asset – The security or asset on which the option is based (e.g., a stock like Apple or an index like Nifty 50).
Strike Price (Exercise Price) – The predetermined price at which the option can be exercised.
Expiration Date – The date on which the option expires. After this date, the option becomes worthless.
Premium – The price paid by the buyer to the seller for the rights conferred by the option.
Intrinsic Value – The difference between the underlying asset’s current price and the strike price, representing the real, immediate value of the option.
Time Value – The portion of the premium that reflects the possibility of the option gaining value before expiration. Time decay reduces this value as the expiration date approaches.
How Options Work
Let’s illustrate with an example:
Suppose a stock is trading at ₹1,000, and you buy a call option with a strike price of ₹1,050, expiring in one month, paying a premium of ₹20.
If the stock rises to ₹1,100 before expiration, you can exercise the option to buy at ₹1,050, making a profit of ₹50 per share minus the premium, i.e., ₹30 per share.
If the stock stays below ₹1,050, you would not exercise the option, losing only the premium of ₹20.
This example highlights two key advantages of options:
Leverage: You control more assets with less capital compared to buying the stock outright.
Limited Risk: The maximum loss for the buyer is the premium paid, unlike stock trading where losses can be higher.

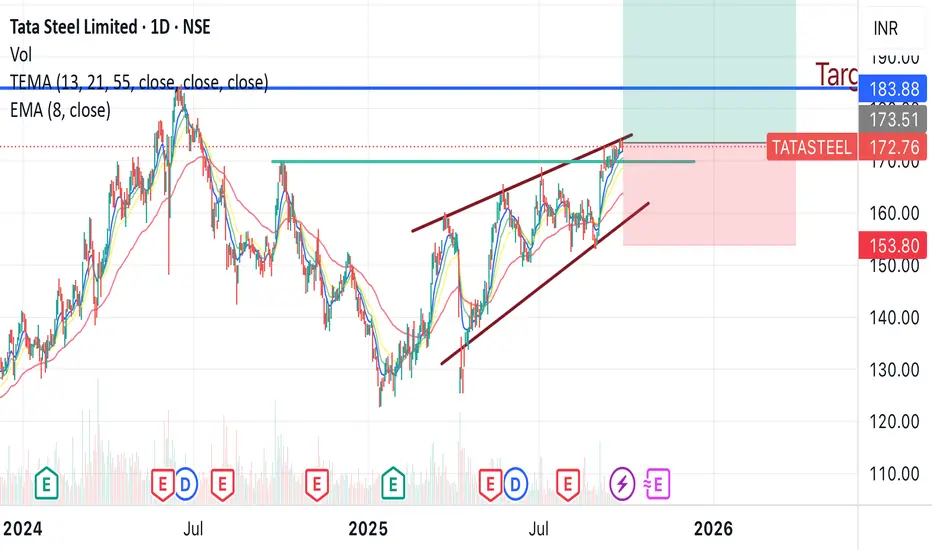
Tata Steel trend line and 1 year resistance breakout Tata steel is gonna give a breakout soon, as it has been in a continuous up trend, reaching 1 year resistance and broken it, it can give from 10-20 % profit from here in short term .
Buy around - 172- 173
Target - 207
Duration - 2-3 months
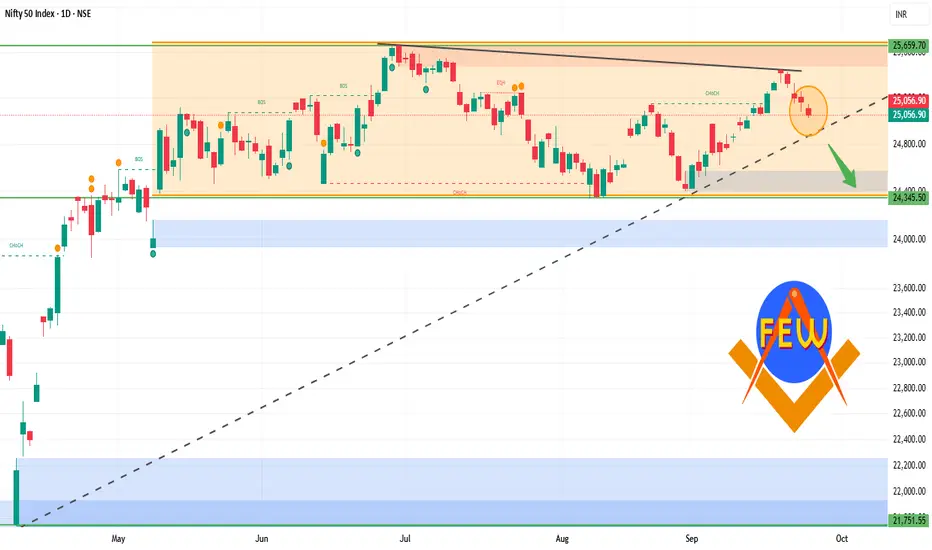
NIFTY 1D Time frame📊 Today’s Nifty Performance
Opening: Around 25,109
Closing: Around 25,057
Result: Market slipped about –52 points (–0.45%)
Range: High near 25,150, Low near 25,027
👉 If you were long (buy side) from the open and held till close → small loss (~52 points).
👉 If you were short (sell side) from the open and held till close → small profit (~52 points).
🎯 Key Levels
Support Zone: 25,000 – 25,020
Resistance Zone: 25,130 – 25,150
📝 Strategy
For Intraday Traders
Sell near resistance (25,130–25,150) with stop-loss just above 25,160.
Buy near support (25,000–25,020) with stop-loss just below 24,980.
For Swing Traders (2–3 days)
If Nifty sustains above 25,150, expect bounce toward 25,250+.
If Nifty breaks below 25,000, expect fall toward 24,900.
Risk Management
Use stop-loss always.
Don’t risk more than 1% of your capital on one trade.
Trail stop-loss if trade goes in your favor.
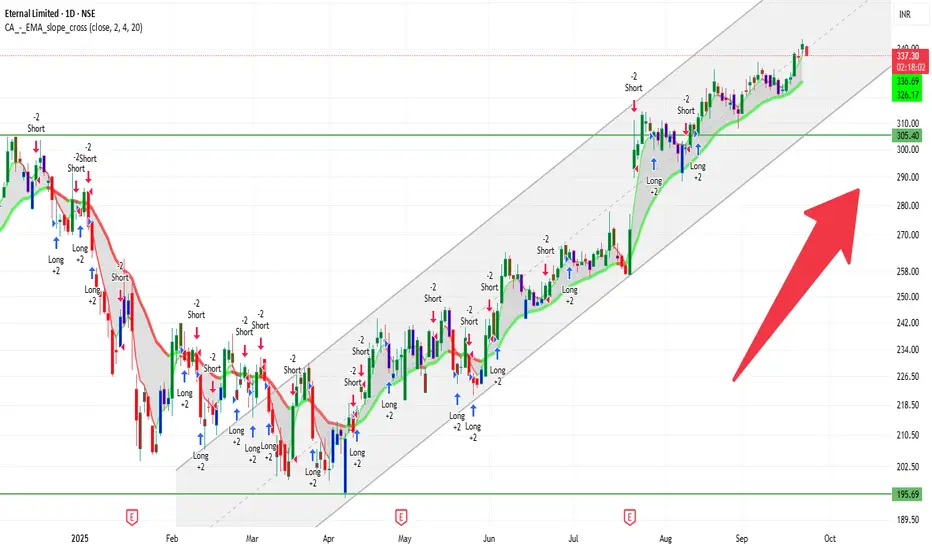
ETERNAL 1D Time frame📍 Today’s Expected Range (Intraday Approximation)
Expected High: ₹341–₹343
Expected Low: ₹336–₹335
These are approximate intraday levels. Actual prices may fluctuate slightly due to volatility.
🔍 Key Points
Current price: ₹337–₹338, trading near the middle of the day’s range.
If price breaks above ₹343 with strong volume → bullish momentum likely.
If price falls below ₹335 → short-term correction or pullback possible.
📊 Suggested Trading Strategy
Bullish Scenario
If Eternal breaks ₹341–₹343, you can buy, targeting ₹348–₹350.
Stop-loss: ₹335
Bearish Scenario
If Eternal drops below ₹335, you can sell/short, targeting ₹330–₹325.
Stop-loss: ₹338
Range-Bound / Sideways
If price trades between ₹335–₹343, it’s better to wait and avoid trading until a clear breakout occurs.
💡 Summary
Resistance Zone: ₹341–₹343
Support Zone: ₹335–₹336
Strategy: Trade in the direction of the breakout, and always use stop-loss to manage risk.
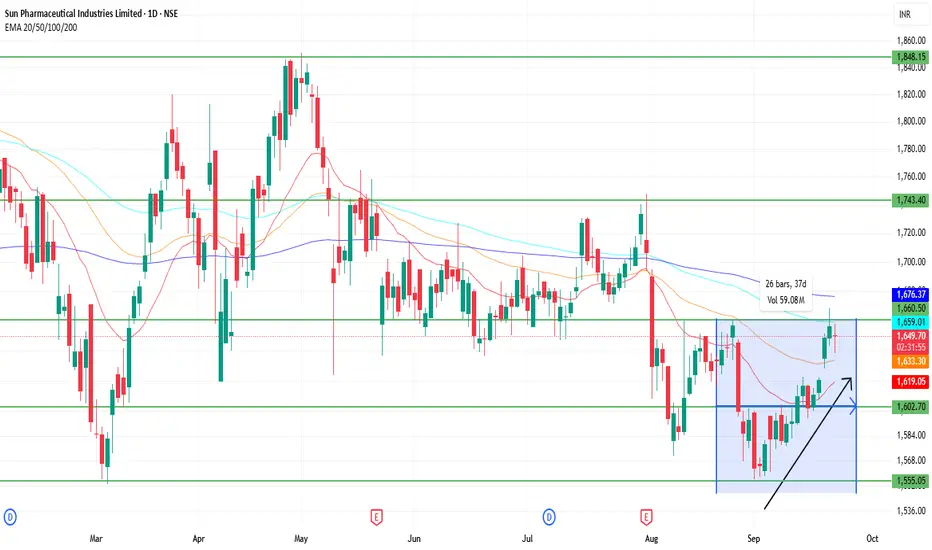
SUNPHARMA 1D Time frame🔍 Current Price
Approximately ₹1,646 – ₹1,650
🧮 Strategy / Trade Ideas
Long Setup:
If price holds above ₹1,630 – ₹1,620 and shows reversal signals (bullish candle etc.), opportunity to go long.
Target zones: first towards ₹1,655 – ₹1,660, then potentially ₹1,675 – ₹1,680.
Stop-loss could be just below support around ₹1,620 to manage risk.
Short / Pullback Setup:
If price faces resistance near ₹1,655 – ₹1,660 and fails to break with conviction.
Potential downside toward ₹1,630 first, then ₹1,600 if that support doesn’t hold.
Breakout Setup:
If price clears and sustains above ₹1,675 – ₹1,680, especially closing above ₹1,745 – ₹1,755, there may be scope for further upside.
✅ Summary
Sun Pharma on the daily chart is moderately bullish. Key for continuation is holding above support in lower ₹1,600-₹1,630 zone, and overcoming resistance around ₹1,655-₹1,660. A breakout above ₹1,675-₹1,680 would strengthen bullish case; failure to hold support could lead to downside.
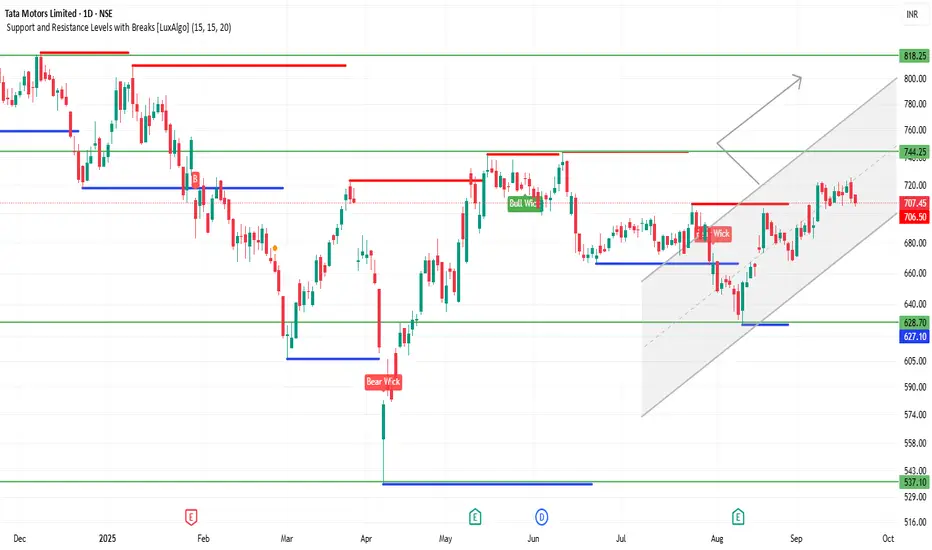
TATAMOTORS 1D Time frameCurrent Price: 707
Current Trend: Strong bullish momentum; stock is trading near recent highs.
Support Zone: Immediate support at 695 – 700. If this holds, uptrend remains intact.
Resistance Zone: Next resistance at 720 – 730. A breakout above this can push toward 750+.
Indicators: Daily candles are bullish, showing higher highs and strong buying interest.
Outlook:
Above 720 → continuation of bullish rally likely.
Below 695 → minor correction possible toward 680–685.
👉 In short (with 707 current price):
Bullish tone.
Range to watch: 695 – 730.
SENSEX 1D Time frameCurrent Trend: Still sideways to mildly bullish, but trading closer to support levels.
Support Zone: Now the strong support shifts to 82,300 – 82,500. If this zone holds, bounce is possible.
Resistance Zone: On the upside, watch 83,200 – 83,500 for resistance. Breakout above this can push price higher.
Indicators: Daily candle suggests consolidation; buyers defending 82,300 zone.
Outlook:
Above 83,500 → fresh bullish momentum likely.
Below 82,300 → weakness can extend further.
👉 In short (based on 82,626 level):
Range: 82,300 – 83,500.
Market neutral, waiting for breakout either side.

Tata SteelTata Steel in the verge of the breakout. Can go long. If it breaks the channel on the upside. and commodity is cycle business it needs other global market support.
Wait for breakout or breakdown.
This is for educational purposes

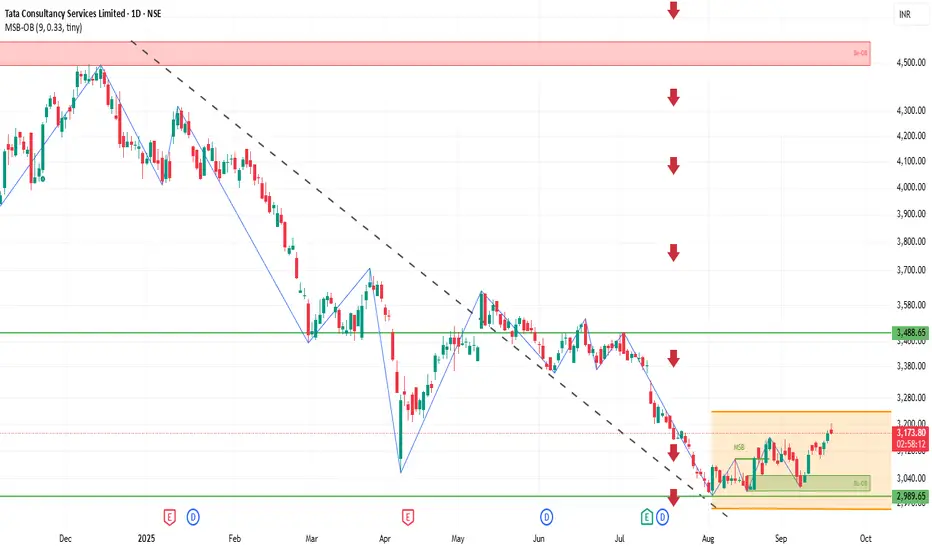
TCS 1D Time frameCurrent Snapshot
Price: ₹3,174
Stock has moved above earlier resistance zones (₹3,150 – ₹3,170).
Momentum looks positive, buyers are holding strength.
📌 Key Levels
Immediate Resistance: ₹3,190 – ₹3,200
Next Resistance: ₹3,220 – ₹3,250
Immediate Support: ₹3,150 – ₹3,160
Stronger Support: ₹3,100 – ₹3,120
✅ Outlook
If TCS sustains above ₹3,170, it can extend the rally toward ₹3,200 – ₹3,220.
If it slips back below ₹3,160, consolidation may happen around ₹3,120 – ₹3,150.
Larger trend remains bullish as long as price stays above ₹3,100.
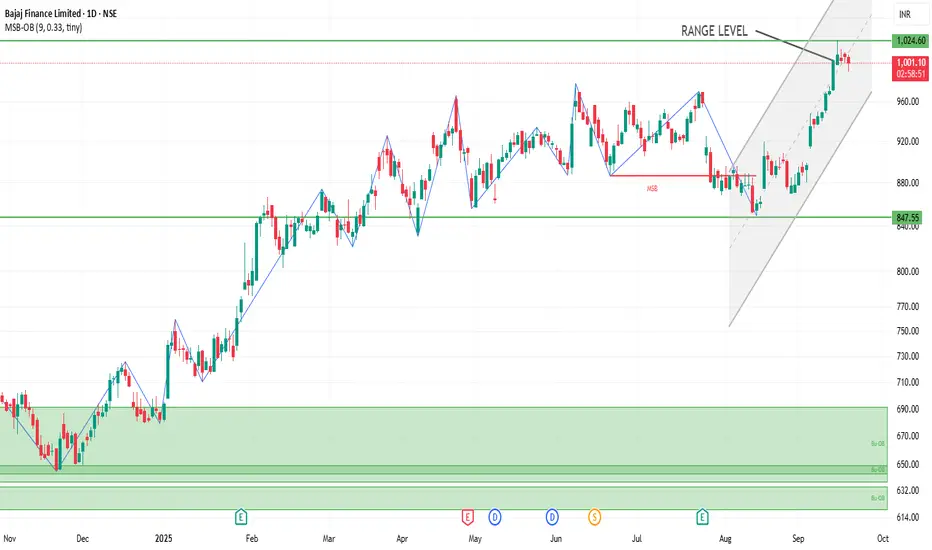
BAJFINANCE 1D Time frameCurrent Overview
Price is trading around ₹995 – ₹1,008.
Recently touched a 52-week high near ₹1,025.
Stock is moving above 50-day and 200-day moving averages, showing a strong uptrend.
⚙️ Indicators (Daily)
RSI (14) → Slightly overbought, but still stable.
MACD & Momentum → Mixed to positive, buyers still in control.
Volume → Strong volume seen near recent highs, showing active participation.
📌 Key Levels
Immediate Resistance: ₹1,010 – ₹1,025 (recent top).
Immediate Support: ₹995 – ₹1,000 (nearby cushion).
Stronger Support: ₹950 – ₹980 zone (50 & 100-day moving averages).