Global Events Impacting Nifty & Sensex1. The Role of Globalization in Stock Markets
Before diving into specific events, it’s important to understand why global developments matter for India’s Nifty and Sensex.
Foreign Institutional Investors (FIIs):
FIIs are among the biggest drivers of India’s stock markets. Their decisions are often influenced by global risk appetite, interest rates abroad, and international events. If FIIs buy, markets rally. If they sell, markets often correct.
Trade and Commodities:
India is one of the largest importers of crude oil and commodities. Global supply chain issues, trade wars, or sanctions directly affect inflation, current account deficit, and corporate profitability, thereby impacting indices.
Currency Movements:
The rupee’s exchange rate against the U.S. dollar is heavily influenced by global factors. A stronger dollar can lead to FII outflows, while a weaker dollar generally benefits emerging markets like India.
Interconnected Economies:
A slowdown in the U.S., Europe, or China affects global demand. Since Indian companies export software, pharmaceuticals, textiles, and engineering goods globally, their revenues depend on world economic conditions.
This interconnectedness means that even if domestic fundamentals are strong, global shocks can influence Indian equity indices.
2. Global Monetary Policies and Interest Rates
One of the most consistent global factors that affect Nifty and Sensex is monetary policy decisions of major central banks, especially the U.S. Federal Reserve, the European Central Bank (ECB), and the Bank of Japan (BoJ).
U.S. Federal Reserve (The Fed):
The Fed’s interest rate decisions directly impact the flow of capital. When the Fed hikes rates, U.S. bonds become more attractive, leading to capital outflows from emerging markets like India. This often causes pressure on Nifty and Sensex. Conversely, rate cuts or dovish policies encourage FIIs to invest in Indian equities.
Quantitative Easing & Tightening:
During crises (like 2008 or COVID-19), central banks inject liquidity through QE. This “easy money” often flows into Indian markets, creating rallies. On the flip side, tapering or tightening leads to corrections.
Impact on Currency:
Interest rate hikes abroad strengthen the U.S. dollar, weakening the rupee. This affects import costs, inflation, and overall market sentiment.
Example:
In 2013, the U.S. Fed hinted at tapering its bond-buying program (“Taper Tantrum”). This led to a sharp fall in emerging markets, including India, with Sensex and Nifty witnessing major corrections.
3. Oil Prices and Energy Shocks
Crude oil is often called the “lifeblood” of the Indian economy because India imports nearly 80% of its crude requirements.
High Oil Prices:
Rising crude prices increase India’s import bill, fuel inflation, widen the current account deficit, and reduce corporate profitability. This usually leads to negative sentiment in Nifty and Sensex.
Falling Oil Prices:
Lower oil prices act like a tax cut for the Indian economy. They reduce inflation, boost consumer spending, and improve margins for companies. This often supports rallies.
Geopolitical Influence:
Events like tensions in the Middle East, OPEC+ production decisions, or sanctions on major oil-producing nations can cause volatility in global oil prices, which in turn directly impacts Indian markets.
Example:
In 2022, the Russia-Ukraine war pushed crude oil above $100 per barrel, leading to inflationary pressures and corrections in Indian equity indices.
4. Geopolitical Conflicts and Wars
Global conflicts often trigger risk-off sentiment, where investors move out of risky assets (like equities) into safe havens (like gold and U.S. bonds).
Wars:
Conflicts such as the Gulf War, U.S.-Iraq war, or Russia-Ukraine war lead to volatility in global markets. Sensex and Nifty often see short-term corrections.
Terrorist Attacks:
Events like 9/11 in the U.S. or terrorist incidents in Europe not only affect global travel and trade but also trigger immediate stock market panic worldwide, including India.
China-Taiwan Tensions:
As China is a major trading partner globally, tensions in Asia-Pacific also ripple into Indian equities.
Example:
During the 2022 Russia-Ukraine war, Indian markets corrected sharply in the initial phase due to fears of crude price spikes and FII outflows.
5. Global Economic Slowdowns and Recessions
Recessions in major economies affect Indian exports, global investor sentiment, and FII inflows.
2008 Global Financial Crisis (GFC):
Triggered by the collapse of Lehman Brothers and the U.S. housing bubble, this event led to a meltdown across global markets. Sensex fell from over 21,000 to below 9,000 within months.
European Debt Crisis (2010–12):
Concerns over Greece, Spain, and Italy’s debt led to global volatility. Indian indices too saw fluctuations during this period.
COVID-19 Pandemic (2020):
The pandemic caused global shutdowns, leading to a historic crash in March 2020 when Sensex lost over 13% in a single day. However, due to massive global stimulus, markets recovered sharply in the following months.
6. Global Trade Policies and Protectionism
Trade relations between major economies (especially the U.S. and China) influence global supply chains and investor sentiment.
U.S.-China Trade War:
When the U.S. imposed tariffs on Chinese goods, global markets saw volatility. India was indirectly affected as supply chains were disrupted, though some Indian sectors benefited (like electronics and chemicals).
WTO and Free Trade Agreements:
Global trade liberalization generally benefits Indian exporters. Protectionism, on the other hand, reduces global trade volume, impacting companies listed on Nifty and Sensex.
7. Global Technology Trends and Disruptions
Technology disruptions are global in nature, and India, being a hub for IT services, is directly impacted.
Silicon Valley and U.S. Tech Trends:
Since Indian IT companies earn most revenues from U.S. clients, any slowdown in U.S. tech spending impacts their stock prices, thereby dragging Nifty IT index and influencing the overall Nifty.
Global Cybersecurity Threats:
Large-scale cyberattacks (like the WannaCry ransomware) can impact IT companies and financial markets worldwide.
Artificial Intelligence & Automation:
Technological changes can reshape sectors globally, and Indian companies must adapt quickly.
8. Climate Change and Global Energy Transition
With the world moving towards sustainability, global policies like carbon taxes, ESG investing trends, and green energy transition directly affect Indian companies.
Global ESG Funds:
Many large funds now only invest in companies with strong ESG scores. This has influenced Indian companies listed on Nifty and Sensex to adapt.
Climate Disasters:
Global climate events like floods, hurricanes, and wildfires affect commodity supply chains, insurance costs, and investor sentiment worldwide.
Conclusion
Global events—whether economic, political, or social—have a direct and lasting impact on India’s Nifty and Sensex. In today’s interconnected financial system, Indian investors cannot ignore what happens across the world. From the U.S. Fed’s decisions to oil price shocks, geopolitical tensions, global recessions, or health pandemics, every event ripples into Dalal Street.
Yet, history shows that despite these ups and downs, India’s stock markets have grown over the long run, reflecting the resilience of its economy and corporate sector. For investors, the key is to stay informed, prepared, and disciplined, understanding that while global winds may shake the tree, the roots of India’s growth story remain strong.
Tatasteel-trading
India’s Growing Derivatives Market & Weekly Expiries1. Introduction
Financial markets act as the lifeblood of an economy, channelizing savings into productive investments. Within these markets, derivatives have emerged as a vital instrument for managing risk, enhancing liquidity, and providing opportunities for speculation and arbitrage. India, which once lagged behind developed economies in terms of derivatives trading, has today become one of the most vibrant derivative markets in the world.
A unique feature of India’s equity derivatives market is the introduction of weekly expiries, which has not only boosted participation but also changed trading patterns significantly. Weekly options, in particular, have become extremely popular, contributing to record-breaking turnover in Indian exchanges.
This essay explores the growth of India’s derivatives market, the mechanics of weekly expiries, their impact on market behavior, and what lies ahead for India in the global derivatives landscape.
2. Understanding Derivatives
Derivatives are financial contracts whose value is derived from an underlying asset such as equities, indices, commodities, currencies, or interest rates. The main types of derivatives include:
Futures – Contracts obligating the buyer to purchase or the seller to sell an asset at a future date at a predetermined price.
Options – Contracts that give the buyer the right, but not the obligation, to buy (Call) or sell (Put) the underlying asset at a set price before or on expiration.
Swaps – Agreements to exchange cash flows or other financial instruments, often linked to interest rates or currencies.
Forwards – Customized contracts similar to futures but traded over-the-counter (OTC).
Derivatives are used for:
Hedging risk against adverse price movements.
Speculation to profit from price volatility.
Arbitrage opportunities from price discrepancies across markets.
In India, the primary focus has been on exchange-traded derivatives, particularly index futures, stock futures, index options, and stock options.
3. Historical Evolution of Derivatives in India
The Indian derivatives market has grown in phases:
Pre-2000s: Derivatives trading was virtually non-existent, with forward contracts and informal hedging practices dominating.
2000: NSE introduced index futures, followed by stock futures and options. This marked the formal beginning of exchange-traded derivatives.
2001-2010: Rapid growth with increasing investor participation. Index options gained popularity, especially on Nifty 50.
2010-2015: Introduction of new products, including currency derivatives and commodity derivatives, deepened the market.
2016-Present: Weekly options expiries on Bank Nifty (later Nifty and FINNIFTY) fueled a new wave of retail and institutional interest.
Today, India ranks among the largest derivatives markets globally in terms of contracts traded, with a massive rise in retail participation driven by technology, mobile trading, and lower transaction costs.
4. Structure of India’s Derivatives Market
Key Exchanges
National Stock Exchange (NSE): Dominates equity derivatives trading with over 90% market share.
Bombay Stock Exchange (BSE): A smaller share but gaining traction through products like Sensex options.
MCX & NCDEX: Commodity derivatives platforms.
Key Products
Index Derivatives: Nifty 50, Bank Nifty, and FINNIFTY options are the most liquid.
Stock Derivatives: Futures and options on large-cap and mid-cap stocks.
Currency Derivatives: Dollar-Rupee and other currency pairs.
Commodity Derivatives: Gold, crude oil, agri commodities, etc.
Participants
Retail traders (rapidly growing, especially in weekly options).
Institutional investors (mutual funds, FIIs, insurance companies).
Hedgers (corporates and banks).
Speculators & arbitrageurs (seeking short-term opportunities).
5. Weekly Expiries in India: The Game Changer
What are Weekly Expiries?
Traditionally, derivatives contracts had monthly expiries. For example, Nifty options would expire on the last Thursday of every month. However, NSE introduced weekly expiries in 2016 for Bank Nifty options, later extending to Nifty 50 and FINNIFTY.
Bank Nifty Options: Expire every Thursday.
Nifty Options: Expire every Thursday (with monthly still available).
FINNIFTY Options: Expire every Tuesday.
Sensex Options (BSE): Expire every Friday.
This means traders now have contracts expiring almost every day of the week, providing more flexibility and opportunities.
Why Weekly Options Became Popular?
Low Premiums: Since weekly options have a shorter time to expiry, they trade cheaper, attracting retail traders.
Quick Turnover: Traders don’t have to wait an entire month; they can capture short-term moves.
High Liquidity: Bank Nifty and Nifty weekly options see some of the highest daily turnover in the world.
Speculative Opportunities: High leverage and volatility near expiry days create big profit (and loss) potential.
Hedging Short-Term Events: Earnings announcements, policy decisions, and global events can be hedged with weekly contracts.
6. Impact of Weekly Expiries on Indian Markets
Positive Impacts
Liquidity Surge: Weekly expiries brought unprecedented liquidity to Indian options markets.
Retail Participation: The affordability of weekly premiums made derivatives accessible to small traders.
Revenue for Exchanges: Explosive growth in contracts traded significantly increased exchange turnover.
Efficient Hedging: Corporates and institutions can hedge short-term risks more precisely.
Negative Impacts
Rise in Speculation: Retail traders often take excessive risks, leading to high losses.
Increased Volatility on Expiry Days: Option writers adjust positions aggressively near expiries, causing intraday swings.
Behavioral Issues: Many retail traders view weekly options as “lottery tickets,” leading to unhealthy trading habits.
Conclusion
India’s derivatives market has transformed from a fledgling sector in the early 2000s into a global leader in contract volumes. The introduction of weekly expiries revolutionized participation, making derivatives more accessible, liquid, and event-driven.
While weekly options have opened doors for small traders, they also bring higher risks due to speculation, volatility, and leverage. For India, the challenge lies in nurturing this growth while safeguarding investors through education, regulation, and innovation.
If managed well, India’s derivatives ecosystem will not only support domestic financial stability but also position the country as a leading hub for global derivatives trading.
Part 2 Ride The Big MovesWhat Are Options?
The Definition
An option is a financial contract that gives you the right, but not the obligation, to buy or sell an underlying asset (like a stock, index, or commodity) at a specific price within a specific time.
There are two main types of options:
Call Option – Gives the right to buy the asset at a fixed price (called the strike price).
Put Option – Gives the right to sell the asset at a fixed price.
Think of options like insurance policies. Just as you pay a premium for car insurance to protect against accidents, in options trading you pay a premium to gain control over an asset’s future without actually owning it upfront.
A Simple Example
Imagine you want to buy 100 shares of Reliance Industries at ₹2,500 per share, but you don’t want to spend ₹2,50,000 immediately. Instead, you buy a call option for ₹100 per share with a strike price of ₹2,500, expiring in one month.
If Reliance rises to ₹2,700, you can exercise your option and buy at ₹2,500, instantly profiting ₹200 per share (minus the premium).
If Reliance falls to ₹2,300, you don’t exercise. You only lose the premium you paid (₹100 per share).
This flexibility is the power of options.

Breakouts & Fakeouts in Trading🔹 Introduction
Financial markets are like living organisms – constantly moving, adjusting, and reacting to news, emotions, and liquidity. For traders, one of the most exciting moments is when a stock, currency pair, commodity, or cryptocurrency seems to break out of its range. Breakouts often lead to big, sharp moves, offering opportunities for quick profits.
But here’s the catch: not every breakout is real. Many are fakeouts (false breakouts) designed by market dynamics, liquidity hunters, or big players to trap traders. The difference between making money and losing money often lies in identifying whether a breakout is genuine or false.
This article dives into:
What breakouts are
Why fakeouts happen
Chart examples (conceptually explained)
Tools to confirm breakouts
Trading strategies to avoid traps
Risk management for breakout traders
🔹 Part 1: What is a Breakout?
A breakout occurs when the price of an asset moves outside a defined support or resistance level with increased momentum.
✅ Common Types of Breakouts
Resistance Breakout – Price moves above a previously strong ceiling.
Support Breakout – Price falls below a previously strong floor.
Trendline Breakout – Price breaks out of a rising or falling trendline.
Chart Pattern Breakout – Price escapes from patterns like triangles, flags, rectangles, or head & shoulders.
Volatility Breakout – When price explodes after a period of consolidation (Bollinger Band squeeze).
Why traders love breakouts?
They indicate a new trend may begin.
They provide clear entry and exit levels.
They often come with higher volume, confirming market interest.
Example: If Nifty is stuck between 19,500–20,000 for weeks and suddenly crosses 20,000 with heavy volume, that’s a bullish breakout.
🔹 Part 2: What is a Fakeout?
A fakeout (false breakout) happens when price temporarily breaks a level, lures traders into positions, but then reverses back into the range.
Fakeouts are dangerous because:
Traders enter aggressively expecting a trend, but get stopped out.
Big players use fakeouts to hunt stop-losses of retail traders.
They often happen during low liquidity or news events.
Example: Price breaks above 20,000, attracts buyers, but quickly reverses to 19,800. That’s a bull trap fakeout.
🔹 Part 3: Why Do Fakeouts Happen?
Fakeouts are not random; they are part of market psychology and structure.
Liquidity Hunting (Stop Loss Hunting)
Smart money knows retail traders place stop-losses above resistance or below support.
They push prices just beyond those levels, trigger stop-losses, then reverse.
Low Volume Breakouts
If breakout happens without strong participation, it’s usually unsustainable.
News & Events
A sudden announcement can cause sharp moves, but once news fades, price falls back.
Algorithmic Manipulation
High-frequency traders may push price beyond levels to create artificial breakouts.
Market Sentiment & Greed
Traders chase breakouts blindly, creating temporary momentum before exhaustion.
🔹 Part 4: Spotting Genuine Breakouts vs Fakeouts
✅ Clues for Real Breakouts
High Volume: Breakouts with above-average volume are stronger.
Retest of Levels: After breakout, price pulls back to test old support/resistance, then resumes trend.
Strong Candle Closes: Large body candles closing beyond the level.
Market Context: Aligns with larger trend or macroeconomic strength.
❌ Signs of Fakeouts
Breakout with low or declining volume.
Long wicks (shadows) beyond resistance/support but weak closes.
Breakouts during off-market hours or thin liquidity.
Price immediately snaps back into range after breakout.
🔹 Part 5: Chart Patterns & Fakeouts
Range Breakouts
Markets consolidate between two levels.
Breakouts beyond range are powerful but also prone to fakeouts.
Triangle Breakouts
Symmetrical/ascending/descending triangles show compression.
Fakeouts are common before the “real” breakout.
Head & Shoulders Pattern
A breakdown below the neckline should confirm trend reversal.
Many times, price breaks below neckline but quickly recovers.
Flag & Pennant Patterns
Strong continuation patterns, but fake breakouts happen if volume is missing.
🔹 Part 6: Strategies to Trade Breakouts & Avoid Fakeouts
1. Wait for Candle Close Confirmation
Don’t jump in immediately; wait for the candle to close above/below the level.
2. Use Volume as Filter
Only trade breakouts with above-average volume.
3. Retest Strategy
Enter on pullback to old support/resistance (safer entry).
4. Multi-Timeframe Confirmation
If breakout is visible on both 1-hour and daily charts, it’s stronger.
5. Combine with Indicators
RSI divergence can warn of false breakout.
Moving averages can confirm trend direction.
6. Avoid News-Driven Breakouts
Trade technical breakouts, not temporary news spikes.
🔹 Part 7: Risk Management in Breakout Trading
Even the best trader cannot avoid fakeouts completely. That’s why risk management is key.
Position Sizing: Risk only 1–2% of account per trade.
Stop Loss Placement:
For upside breakout: place SL below breakout level.
For downside breakout: place SL above breakdown level.
Use Partial Profits: Book some profit early, trail the rest.
Don’t Chase Breakouts: If you miss the first entry, don’t enter late.
🔹 Part 8: Real-Life Examples
Example 1: Stock Breakout
Stock consolidates between ₹500–₹520 for 2 weeks.
Breaks ₹520 with high volume, rallies to ₹550. (Real breakout)
Example 2: Crypto Fakeout
Bitcoin breaks $30,000 resistance but fails to sustain.
Falls back to $29,000 within hours. (Bull trap fakeout)
Example 3: Forex False Breakdown
EUR/USD breaks below 1.1000, triggering short trades.
Reverses sharply to 1.1050. (Bear trap fakeout)
🔹 Part 9: Psychology Behind Breakouts & Fakeouts
Retail Traders: Chase price blindly.
Institutions: Create liquidity zones by triggering retail stop-losses.
Fear & Greed: Traders either fear missing out (FOMO) or panic at reversals.
Patience vs Impulsiveness: Successful traders wait for confirmation, while impulsive ones fall for fakeouts.
🔹 Part 10: Advanced Tips for Professionals
Volume Profile Analysis
See if breakout aligns with high-volume nodes (strong support/resistance).
Order Flow Tools (Level II Data, Footprint Charts)
Helps spot whether breakout is supported by real buying/selling.
Breakout with Trend Alignment
Always trade in direction of higher-timeframe trend.
Market Timing
Breakouts during main sessions (like US market open) are more reliable.
🔹 Conclusion
Breakouts & fakeouts are two sides of the same coin. While real breakouts can deliver powerful moves, fakeouts are equally common and dangerous. The key lies in:
Confirming with volume, retests, and candle closes.
Avoiding emotional FOMO trades.
Protecting capital with risk management.
If you understand the psychology behind breakouts and fakeouts, use confirmation tools, and trade with patience, you can avoid traps and capture the big trend moves that follow genuine breakouts.
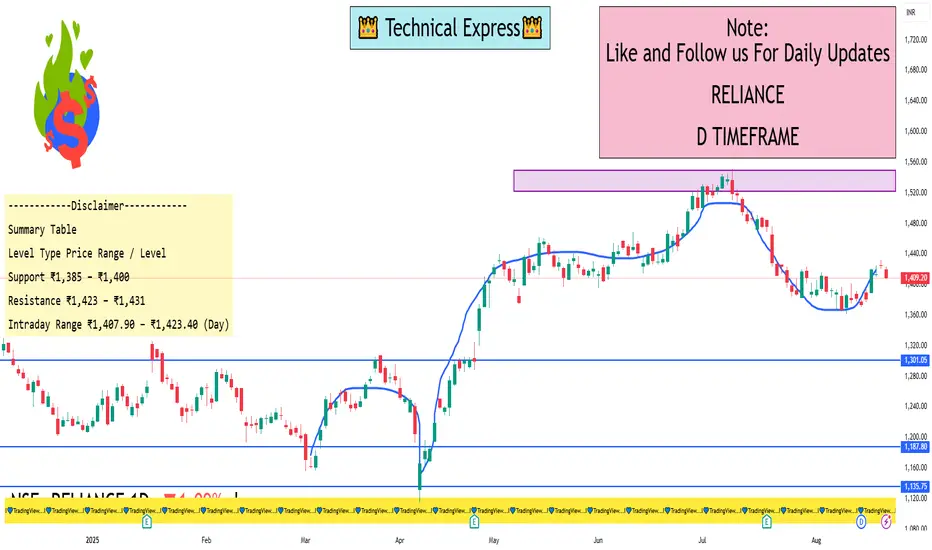
Reliance 1 Day View Key Levels (1-Day Time Frame)
Based on data from Investing.com and Moneycontrol:
Day’s Range: ₹1,407.90 – ₹1,423.40
Recent Daily High (Aug 21): ₹1,431.90
Recent Daily Low (Aug 11): ₹1,361.20
From chart commentary (TradingView):
Support Zone: ₹1,385–1,400
Resistance Level: Around ₹1,423–1,431
Interpretation & Notes
Intraday activity shows movement between roughly ₹1,408 to ₹1,423.
A daily low near ₹1,408 may serve as short-term support; breaking below could test the ₹1,385–1,400 zone.
On the upside, a close above ₹1,423–1,431 might open potential to push higher.
Remember: technical levels provide guidance, not guarantees—market dynamics and fundamentals can shift price action quickly. Always cross-check with live charts and broader analysis.
Part 2 Trading MasterclassOption Trading vs Stock Trading
Stocks = Ownership, long-term growth, dividends.
Options = Contracts, leverage, flexible strategies.
Stocks = Simpler, but capital-intensive.
Options = Complex, but require less capital and offer hedging.
For example:
Buying 100 shares of Reliance at ₹2500 = ₹2,50,000.
Buying 1 call option of Reliance at ₹100 premium with lot size 250 = only ₹25,000.
This leverage makes options attractive—but also riskier.
Real-Life Examples & Case Studies
Case 1: Bull Market
A trader buys Nifty 20000 Call at ₹200 premium. Nifty rallies to 20500. Profit = ₹300 (500 – 200). Huge return on a small premium.
Case 2: Bear Market
Investor holds TCS shares but fears a fall. Buys a protective put. When stock drops, put increases in value, reducing losses.
Case 3: Neutral Market
Trader sells an Iron Condor on Bank Nifty, betting price will stay range-bound. Premium collected = profit if market stays sideways.

Part 1 Master Candle Sticks PatternRisk Management in Options
Position Sizing: Don’t risk more than 1–2% of capital in one trade.
Stop Loss: Exit before premium erodes completely.
Avoid Over-leverage: Options look cheap but risk is real.
Hedge Positions: Combine with futures or other options.
Psychology of Option Traders
Greed: Chasing high-return trades without risk control.
Fear of Missing Out (FOMO): Jumping in near expiry due to excitement.
Patience: Waiting for correct setup is key.
Discipline: Stick to rules, avoid revenge trading.
Modern Trends in Option Trading
Weekly Expiry Craze: Thursday = biggest trading day.
0DTE (Zero Day to Expiry) Options: Popular for scalping.
Algo & AI Trading: Automated strategies now dominate.
Retail Participation Explosion: India has seen retail option traders grow 5x in 3 years.

Tatasteel footsteps for you...!Tails are important for this stock to trade.
Suppose to trade tomorrow 285 above, then buy and hold ( Friday )
================================================================
Tatasteel TimeCycle and Parallel downward channel.
The price is trading at value low which is better to buy.
================================================================
tail is not valid for buy:
