India’s Growing Derivatives Market & Weekly Expiries1. Introduction
Financial markets act as the lifeblood of an economy, channelizing savings into productive investments. Within these markets, derivatives have emerged as a vital instrument for managing risk, enhancing liquidity, and providing opportunities for speculation and arbitrage. India, which once lagged behind developed economies in terms of derivatives trading, has today become one of the most vibrant derivative markets in the world.
A unique feature of India’s equity derivatives market is the introduction of weekly expiries, which has not only boosted participation but also changed trading patterns significantly. Weekly options, in particular, have become extremely popular, contributing to record-breaking turnover in Indian exchanges.
This essay explores the growth of India’s derivatives market, the mechanics of weekly expiries, their impact on market behavior, and what lies ahead for India in the global derivatives landscape.
2. Understanding Derivatives
Derivatives are financial contracts whose value is derived from an underlying asset such as equities, indices, commodities, currencies, or interest rates. The main types of derivatives include:
Futures – Contracts obligating the buyer to purchase or the seller to sell an asset at a future date at a predetermined price.
Options – Contracts that give the buyer the right, but not the obligation, to buy (Call) or sell (Put) the underlying asset at a set price before or on expiration.
Swaps – Agreements to exchange cash flows or other financial instruments, often linked to interest rates or currencies.
Forwards – Customized contracts similar to futures but traded over-the-counter (OTC).
Derivatives are used for:
Hedging risk against adverse price movements.
Speculation to profit from price volatility.
Arbitrage opportunities from price discrepancies across markets.
In India, the primary focus has been on exchange-traded derivatives, particularly index futures, stock futures, index options, and stock options.
3. Historical Evolution of Derivatives in India
The Indian derivatives market has grown in phases:
Pre-2000s: Derivatives trading was virtually non-existent, with forward contracts and informal hedging practices dominating.
2000: NSE introduced index futures, followed by stock futures and options. This marked the formal beginning of exchange-traded derivatives.
2001-2010: Rapid growth with increasing investor participation. Index options gained popularity, especially on Nifty 50.
2010-2015: Introduction of new products, including currency derivatives and commodity derivatives, deepened the market.
2016-Present: Weekly options expiries on Bank Nifty (later Nifty and FINNIFTY) fueled a new wave of retail and institutional interest.
Today, India ranks among the largest derivatives markets globally in terms of contracts traded, with a massive rise in retail participation driven by technology, mobile trading, and lower transaction costs.
4. Structure of India’s Derivatives Market
Key Exchanges
National Stock Exchange (NSE): Dominates equity derivatives trading with over 90% market share.
Bombay Stock Exchange (BSE): A smaller share but gaining traction through products like Sensex options.
MCX & NCDEX: Commodity derivatives platforms.
Key Products
Index Derivatives: Nifty 50, Bank Nifty, and FINNIFTY options are the most liquid.
Stock Derivatives: Futures and options on large-cap and mid-cap stocks.
Currency Derivatives: Dollar-Rupee and other currency pairs.
Commodity Derivatives: Gold, crude oil, agri commodities, etc.
Participants
Retail traders (rapidly growing, especially in weekly options).
Institutional investors (mutual funds, FIIs, insurance companies).
Hedgers (corporates and banks).
Speculators & arbitrageurs (seeking short-term opportunities).
5. Weekly Expiries in India: The Game Changer
What are Weekly Expiries?
Traditionally, derivatives contracts had monthly expiries. For example, Nifty options would expire on the last Thursday of every month. However, NSE introduced weekly expiries in 2016 for Bank Nifty options, later extending to Nifty 50 and FINNIFTY.
Bank Nifty Options: Expire every Thursday.
Nifty Options: Expire every Thursday (with monthly still available).
FINNIFTY Options: Expire every Tuesday.
Sensex Options (BSE): Expire every Friday.
This means traders now have contracts expiring almost every day of the week, providing more flexibility and opportunities.
Why Weekly Options Became Popular?
Low Premiums: Since weekly options have a shorter time to expiry, they trade cheaper, attracting retail traders.
Quick Turnover: Traders don’t have to wait an entire month; they can capture short-term moves.
High Liquidity: Bank Nifty and Nifty weekly options see some of the highest daily turnover in the world.
Speculative Opportunities: High leverage and volatility near expiry days create big profit (and loss) potential.
Hedging Short-Term Events: Earnings announcements, policy decisions, and global events can be hedged with weekly contracts.
6. Impact of Weekly Expiries on Indian Markets
Positive Impacts
Liquidity Surge: Weekly expiries brought unprecedented liquidity to Indian options markets.
Retail Participation: The affordability of weekly premiums made derivatives accessible to small traders.
Revenue for Exchanges: Explosive growth in contracts traded significantly increased exchange turnover.
Efficient Hedging: Corporates and institutions can hedge short-term risks more precisely.
Negative Impacts
Rise in Speculation: Retail traders often take excessive risks, leading to high losses.
Increased Volatility on Expiry Days: Option writers adjust positions aggressively near expiries, causing intraday swings.
Behavioral Issues: Many retail traders view weekly options as “lottery tickets,” leading to unhealthy trading habits.
Conclusion
India’s derivatives market has transformed from a fledgling sector in the early 2000s into a global leader in contract volumes. The introduction of weekly expiries revolutionized participation, making derivatives more accessible, liquid, and event-driven.
While weekly options have opened doors for small traders, they also bring higher risks due to speculation, volatility, and leverage. For India, the challenge lies in nurturing this growth while safeguarding investors through education, regulation, and innovation.
If managed well, India’s derivatives ecosystem will not only support domestic financial stability but also position the country as a leading hub for global derivatives trading.
Tatasteel
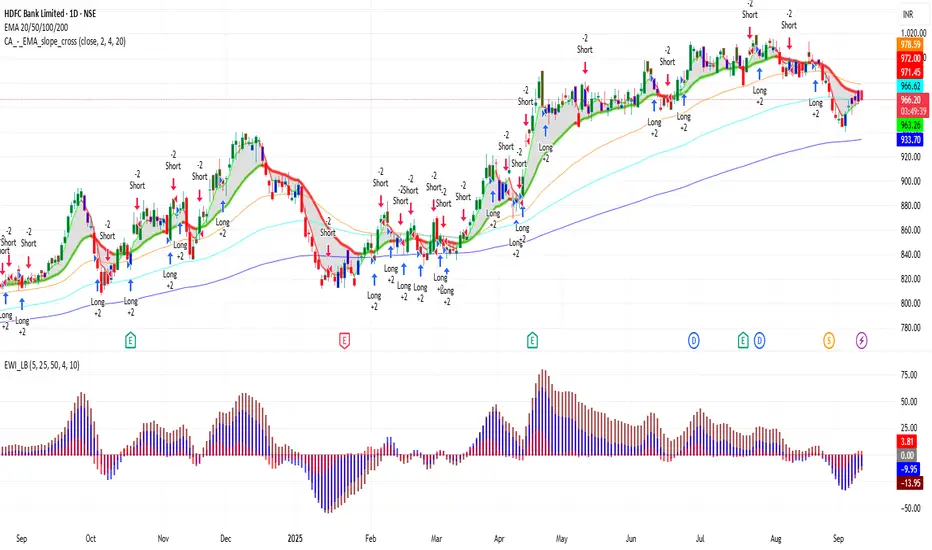
HDFCBANK 1D Time frame📍 HDFCBANK – 1D Important Levels (Current)
🔹 Support Zones
1,570 – 1,580 → Immediate daily support
1,530 – 1,550 → Strong support; buyers likely to defend this zone
1,480 – 1,500 → Major support; breakdown may shift trend bearish
🔹 Resistance Zones
1,620 – 1,630 → Immediate daily resistance
1,660 – 1,680 → Strong resistance zone
1,720 – 1,740 → Major resistance; breakout here may trigger a bigger rally
⚖️ Daily Trend Outlook
HDFC Bank is currently in a sideways-to-bullish phase on the daily chart.
As long as price holds above 1,570, momentum can stay positive.
A breakout above 1,630 – 1,680 may extend upside towards 1,720 – 1,740.
A breakdown below 1,570 could drag it back to 1,530 – 1,500.
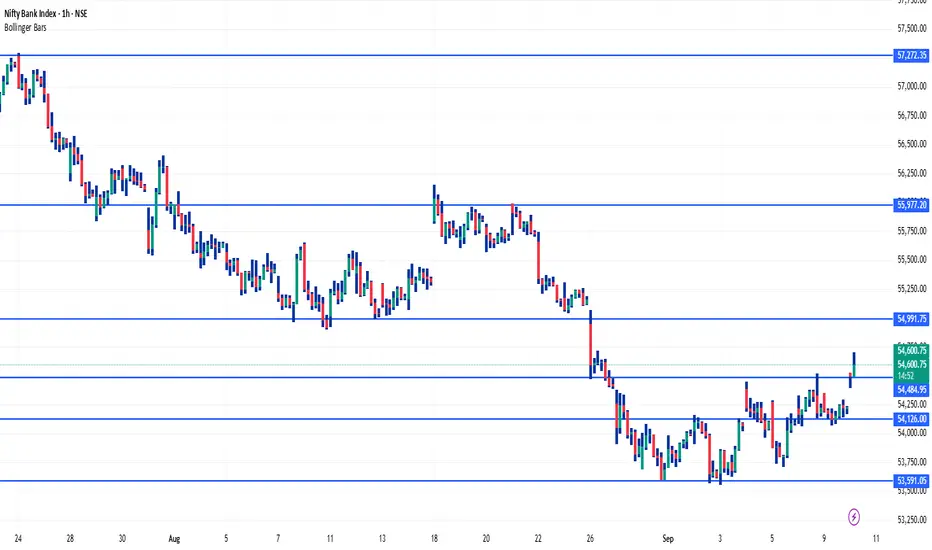
BANKNIFTY 1Hour Time frame📍 Bank Nifty – 1H Important Levels (Current)
🔹 Support Zones
47,800 – 47,900 → Immediate intraday support
47,400 – 47,500 → Strong support; buyers expected to defend here
47,000 – 47,100 → Major support; breakdown here can invite heavy selling
🔹 Resistance Zones
48,400 – 48,500 → Immediate 1H resistance
48,800 – 48,900 → Strong resistance zone
49,200 – 49,300 → Major resistance; breakout here may fuel a rally
⚖️ Quick Summary
Bias: Range-bound with a bullish tilt as long as Bank Nifty trades above 47,800.
Breakout above 48,500 can push towards 48,900 – 49,300.
Breakdown below 47,800 can drag the index to 47,400 – 47,000.
Current watch zone: 47,800 – 48,500.
Currency Trading (Forex Trading)1. Introduction to Currency Trading
Currency trading, also called foreign exchange trading or forex trading, is the global marketplace where national currencies are bought and sold against each other. It is the largest and most liquid financial market in the world, with a daily trading volume exceeding $7 trillion (according to BIS 2022 report).
Unlike stock markets, which operate in specific exchanges (like the NYSE or NSE), forex is a decentralized market that operates 24 hours a day, five days a week, spanning across global financial hubs: Sydney, Tokyo, London, and New York.
The main purpose of forex trading is:
Facilitating international trade and investment – businesses need currency exchange.
Speculation and profit-making – traders attempt to profit from price fluctuations.
Hedging – corporations and investors manage currency risk.
2. History of Currency Trading
To understand modern forex, let’s go back in time:
Gold Standard Era (1870s – 1914): Currencies were pegged to gold. Stable but restrictive.
Bretton Woods System (1944 – 1971): Post-WWII, the US dollar was pegged to gold, and other currencies were pegged to the dollar. This system collapsed in 1971 when the US ended gold convertibility.
Free-Floating Exchange Rates (1971 onwards): Major currencies started floating freely, driven by supply and demand.
Digital and Online Forex (1990s – present): With the internet and trading platforms, forex became accessible to retail traders worldwide.
Today, forex is a technology-driven global marketplace where even small investors can trade currencies with a click.
3. Basics of Currency Pairs
Currencies are traded in pairs, since one currency is exchanged for another.
Example: EUR/USD = 1.1000
This means 1 Euro = 1.10 US Dollars.
If you think the Euro will strengthen, you buy EUR/USD.
If you think the Euro will weaken, you sell EUR/USD.
Categories of Currency Pairs:
Major Pairs: Most traded, always include the USD (e.g., EUR/USD, GBP/USD, USD/JPY).
Minor Pairs (Crosses): Don’t include USD (e.g., EUR/GBP, AUD/NZD).
Exotic Pairs: Combine a major currency with one from an emerging economy (e.g., USD/INR, EUR/TRY).
4. How the Forex Market Works
Forex operates on an OTC (Over-the-Counter) model – no central exchange. Instead, it works via a network of:
Banks & Central Banks (liquidity providers).
Hedge Funds, Corporations, and Governments (large participants).
Retail Brokers who provide platforms for individuals.
Market Sessions:
Sydney Session: Opens the week, low liquidity.
Tokyo Session: Active Asian trading.
London Session: Very liquid, overlaps with Asia and US.
New York Session: High volatility, overlaps with London.
Because of these time zones, the forex market is effectively open 24/5.
5. Key Players in Currency Trading
Central Banks: Control money supply and interest rates, e.g., US Federal Reserve, ECB, RBI.
Commercial Banks: Provide liquidity, facilitate global trade.
Hedge Funds & Institutions: Speculate with billions of dollars.
Corporations: Hedge currency risk for imports/exports.
Retail Traders: Individuals trading via brokers.
6. Why Do People Trade Currencies?
Speculation: Profit from price changes.
Hedging: Protect against currency fluctuations.
Diversification: Alternative to stocks and commodities.
Accessibility: Low entry cost, leverage availability.
7. Key Concepts in Forex Trading
(a) Bid & Ask Price
Bid Price: Price at which market buys from you.
Ask Price: Price at which market sells to you.
Spread: Difference between bid and ask (broker’s fee).
(b) Pips & Lots
Pip (Percentage in Point): Smallest price movement (e.g., 0.0001 in EUR/USD).
Lot: Standard unit of trading (100,000 units of base currency).
Standard Lot = 100,000
Mini Lot = 10,000
Micro Lot = 1,000
(c) Leverage & Margin
Leverage: Allows traders to control large positions with small capital (e.g., 1:100).
Margin: Deposit required to open a leveraged trade.
(d) Long & Short Positions
Long (Buy): Betting on currency appreciation.
Short (Sell): Betting on currency depreciation.
8. Fundamental Analysis in Forex
Fundamental analysis examines economic, political, and financial factors that influence currencies.
Key Drivers:
Interest Rates: Higher rates attract capital → stronger currency.
Inflation: High inflation → weaker currency.
GDP Growth: Strong economy → strong currency.
Employment Data: (e.g., US Non-Farm Payrolls).
Trade Balance: Surplus strengthens currency, deficit weakens it.
Geopolitics: Wars, elections, policy shifts affect currencies.
Example: If the US Federal Reserve raises interest rates, the USD often strengthens.
9. Technical Analysis in Forex
Traders also rely on charts and indicators to predict price moves.
Common Tools:
Candlestick Patterns: e.g., Doji, Engulfing.
Support & Resistance Levels.
Trendlines & Channels.
Indicators: Moving Averages, RSI, MACD, Bollinger Bands.
Chart Patterns: Head & Shoulders, Triangles, Flags.
Technical analysis helps traders time entries and exits more precisely.
10. Types of Currency Trading
(a) Spot Trading
Immediate exchange of currencies at current market price.
Most common type for retail traders.
(b) Forward Contracts
Agreement to exchange currency at a future date, fixed rate.
Used for hedging.
(c) Futures Contracts
Standardized contracts traded on exchanges (e.g., CME).
Regulated and transparent.
(d) Options
Right (but not obligation) to buy/sell currency at a set price.
Used for hedging and speculation.
(e) CFDs (Contracts for Difference)
Popular in retail forex.
No physical delivery of currency, only speculation on price changes.
Conclusion
Currency trading is a dynamic, global, and highly liquid market that offers immense opportunities and risks. It plays a vital role in the global economy by enabling trade, investment, and financial stability.
For traders, success in forex requires:
Solid understanding of fundamentals and technicals.
Strict risk management.
Strong psychological discipline.
While the potential rewards are high, forex trading is not a shortcut to riches. It’s a skill-based profession that requires patience, practice, and continuous learning.

Part 2 Ride The Big MovesWhat Are Options?
The Definition
An option is a financial contract that gives you the right, but not the obligation, to buy or sell an underlying asset (like a stock, index, or commodity) at a specific price within a specific time.
There are two main types of options:
Call Option – Gives the right to buy the asset at a fixed price (called the strike price).
Put Option – Gives the right to sell the asset at a fixed price.
Think of options like insurance policies. Just as you pay a premium for car insurance to protect against accidents, in options trading you pay a premium to gain control over an asset’s future without actually owning it upfront.
A Simple Example
Imagine you want to buy 100 shares of Reliance Industries at ₹2,500 per share, but you don’t want to spend ₹2,50,000 immediately. Instead, you buy a call option for ₹100 per share with a strike price of ₹2,500, expiring in one month.
If Reliance rises to ₹2,700, you can exercise your option and buy at ₹2,500, instantly profiting ₹200 per share (minus the premium).
If Reliance falls to ₹2,300, you don’t exercise. You only lose the premium you paid (₹100 per share).
This flexibility is the power of options.

GIFT Nifty & Its Impact on Indian MarketsPart 1: Background & Origin of GIFT Nifty
What is GIFT City?
GIFT City (Gujarat International Finance Tec-City) is India’s first International Financial Services Centre (IFSC).
Located near Gandhinagar, Gujarat, it was conceptualized to create a world-class financial hub in India to compete with global centers like Singapore, Dubai, and Hong Kong.
GIFT City offers tax incentives, relaxed regulatory norms, and state-of-the-art infrastructure for global financial institutions to operate.
What is SGX Nifty?
The SGX Nifty was a derivative contract based on the Nifty 50 index, traded on the Singapore Exchange (SGX).
It allowed international investors to take exposure to Indian equities without registering in India.
For years, SGX Nifty acted as a barometer for Indian markets, especially because it traded during hours when Indian markets were closed.
Traders in India would often look at SGX Nifty early morning to predict the likely opening of the Indian stock market.
The Dispute & Transition
In 2018, NSE (National Stock Exchange of India) announced it would stop licensing its Nifty index to foreign exchanges like SGX.
The decision led to arbitration between NSE and SGX, as SGX Nifty had become very popular among global investors.
Finally, a compromise was reached: SGX Nifty contracts would be migrated to GIFT City under NSE IFSC.
On July 3, 2023, SGX Nifty officially rebranded as GIFT Nifty and trading began on NSE IFSC.
Part 2: Structure & Features of GIFT Nifty
Key Features
Underlying Index: Nifty 50 (India’s flagship index).
Contract Type: Futures contracts (similar to SGX Nifty).
Trading Venue: NSE International Exchange (NSE IX) at GIFT City IFSC.
Currency: Denominated in US Dollars instead of Indian Rupees.
Trading Hours: Nearly 21 hours (from 6:30 AM to 2:45 AM IST) — allowing overlap with Asian, European, and US markets.
Participants: International investors, Foreign Portfolio Investors (FPIs), NRIs, and eligible domestic investors.
Types of GIFT Nifty Contracts
Currently, NSE IFSC offers futures contracts on:
GIFT Nifty 50
GIFT Nifty Bank
GIFT Nifty Financial Services
GIFT Nifty IT
This expands the scope beyond just the Nifty 50 index, giving investors wider access to Indian sectoral indices.
Why Dollar Denominated?
International investors prefer USD-denominated contracts as it eliminates INR currency risk.
It makes Indian markets more accessible globally without forcing traders to manage currency exposure.
Part 3: Importance of GIFT Nifty
1. A Gateway for Global Investors
Earlier, SGX Nifty allowed foreign investors to participate in Indian markets indirectly. With GIFT Nifty, India itself now provides that gateway, strengthening its own financial ecosystem.
2. Deepening Market Liquidity
By concentrating derivatives trading within India, NSE IFSC attracts liquidity that was earlier routed abroad.
This boosts India’s derivatives market depth, transparency, and volumes.
3. Enhancing India’s Global Financial Standing
Shifting trading from Singapore to India signals that India is ready to host global investors on its own platform.
This strengthens India’s ambition of making GIFT City a financial hub like Dubai or Singapore.
4. Longer Trading Hours
Indian stock exchanges (NSE & BSE) operate from 9:15 AM to 3:30 PM IST.
GIFT Nifty trades for 21 hours, giving almost round-the-clock access to Indian equity exposure.
This aligns India with global markets, reduces overnight risks, and improves price discovery.
5. Price Discovery & Market Sentiment
Earlier, SGX Nifty served as an indicator of Indian market openings. Now, GIFT Nifty performs that role.
With long trading hours, it reflects global sentiment on Indian equities more effectively.
Part 4: Impact of GIFT Nifty on Indian Markets
A. Impact on Indian Exchanges (NSE & BSE)
Positive: More visibility, control, and revenue for NSE as global trading activity comes under its umbrella.
Neutral/Negative: Indian retail traders may feel disconnected since contracts are in USD and primarily targeted at international investors.
B. Impact on Market Liquidity
Migration of volumes from SGX to GIFT increases liquidity within Indian jurisdiction.
Higher liquidity means tighter spreads, better efficiency, and more robust risk management for investors.
C. Impact on Global Investors
Easier access to Indian markets without worrying about Indian regulations.
Extended trading hours make Indian assets more attractive for hedging and speculative purposes.
Dollar-denominated contracts align with global trading practices.
D. Impact on Domestic Investors
Initially limited, since GIFT Nifty is mainly designed for FPIs and international traders.
However, over time, domestic institutions (like mutual funds and banks) may benefit by using it for hedging foreign flows.
E. Impact on Indian Rupee (INR)
Since contracts are in USD, demand for Indian equities could indirectly influence INR movements.
GIFT City also has potential to become a hub for INR trading in future.
F. Impact on India’s Financial Image
Positions India as a serious global financial player.
Increases foreign confidence in Indian regulatory and market structures.
Part 5: Comparison – GIFT Nifty vs SGX Nifty
Aspect SGX Nifty GIFT Nifty
Location Singapore Exchange NSE IFSC (GIFT City, India)
Currency USD USD
Trading Hours 16 hours 21 hours
Regulator MAS (Singapore) IFSCA (India)
Ownership of Revenues SGX NSE
Underlying Index Nifty 50 Nifty 50, Bank, IT, Financial Services
Role in Price Discovery Yes Yes (now the official one)
The shift essentially moves control and revenues from Singapore to India.
Part 6: Opportunities Created by GIFT Nifty
Boost for GIFT City – The success of GIFT Nifty can attract other asset classes like global bonds, currencies, and commodities.
Increased FPI Flows – Easier access encourages more foreign portfolio investment into India.
Derivatives Ecosystem Expansion – Potential to introduce options, ETFs, and structured products linked to Indian indices.
Cross-Border Collaboration – GIFT Nifty opens avenues for India to collaborate with global exchanges in other products.
Risk Management for Global Investors – Long trading hours provide effective hedging tools.
Part 7: Challenges & Concerns
Liquidity Migration – Will all volumes shift smoothly from SGX to GIFT Nifty? Some traders may prefer Singapore due to familiarity.
Regulatory Environment – Global investors need confidence in IFSCA’s regulatory robustness.
Dollar Contracts Disconnect – Indian retail traders may feel left out since contracts are not INR-based.
Competition from Other Hubs – Dubai, Singapore, and Hong Kong remain strong competitors as global finance centers.
Infrastructure Readiness – GIFT City must maintain world-class standards to handle high-frequency global trades.
Part 8: Long-Term Implications
Strengthening NSE’s Global Role
NSE may emerge as a global exchange platform beyond Indian borders.
Growth of GIFT City
Success of GIFT Nifty sets the tone for making GIFT City India’s Wall Street.
Integration with Global Finance
Longer trading hours and dollar-denomination bring Indian equities closer to global investors.
Increased FPI Confidence
Consistent performance of GIFT Nifty could increase foreign flows into India’s cash equity markets.
Policy Influence
If successful, it could encourage policymakers to replicate such models in bonds, currencies, and commodities.
Part 9: Case Study – First Year of GIFT Nifty
In its first year, GIFT Nifty volumes have been rising steadily.
According to exchange reports, daily average turnover crossed billions of dollars within months.
Many global institutional investors have already shifted positions from SGX.
This indicates strong acceptance and confidence in India’s financial infrastructure.
Conclusion
The launch of GIFT Nifty is a historic milestone in India’s journey toward becoming a global financial powerhouse. By bringing offshore trading of Indian equity derivatives back to Indian soil, it strengthens the domestic ecosystem, enhances liquidity, and improves price discovery.
For global investors, GIFT Nifty provides almost round-the-clock access to Indian markets in a familiar USD-denominated format. For India, it symbolizes financial sovereignty, global competitiveness, and the ambition of positioning GIFT City as an international financial hub.
While challenges remain—such as building liquidity, ensuring robust regulation, and competing with established hubs—GIFT Nifty has already made a significant impact on how the world interacts with Indian equities. Over the next decade, its success could pave the way for India’s deeper integration into global capital markets, making it a win-win for investors, exchanges, and the Indian economy alike.

Breakouts & Fakeouts in Trading🔹 Introduction
Financial markets are like living organisms – constantly moving, adjusting, and reacting to news, emotions, and liquidity. For traders, one of the most exciting moments is when a stock, currency pair, commodity, or cryptocurrency seems to break out of its range. Breakouts often lead to big, sharp moves, offering opportunities for quick profits.
But here’s the catch: not every breakout is real. Many are fakeouts (false breakouts) designed by market dynamics, liquidity hunters, or big players to trap traders. The difference between making money and losing money often lies in identifying whether a breakout is genuine or false.
This article dives into:
What breakouts are
Why fakeouts happen
Chart examples (conceptually explained)
Tools to confirm breakouts
Trading strategies to avoid traps
Risk management for breakout traders
🔹 Part 1: What is a Breakout?
A breakout occurs when the price of an asset moves outside a defined support or resistance level with increased momentum.
✅ Common Types of Breakouts
Resistance Breakout – Price moves above a previously strong ceiling.
Support Breakout – Price falls below a previously strong floor.
Trendline Breakout – Price breaks out of a rising or falling trendline.
Chart Pattern Breakout – Price escapes from patterns like triangles, flags, rectangles, or head & shoulders.
Volatility Breakout – When price explodes after a period of consolidation (Bollinger Band squeeze).
Why traders love breakouts?
They indicate a new trend may begin.
They provide clear entry and exit levels.
They often come with higher volume, confirming market interest.
Example: If Nifty is stuck between 19,500–20,000 for weeks and suddenly crosses 20,000 with heavy volume, that’s a bullish breakout.
🔹 Part 2: What is a Fakeout?
A fakeout (false breakout) happens when price temporarily breaks a level, lures traders into positions, but then reverses back into the range.
Fakeouts are dangerous because:
Traders enter aggressively expecting a trend, but get stopped out.
Big players use fakeouts to hunt stop-losses of retail traders.
They often happen during low liquidity or news events.
Example: Price breaks above 20,000, attracts buyers, but quickly reverses to 19,800. That’s a bull trap fakeout.
🔹 Part 3: Why Do Fakeouts Happen?
Fakeouts are not random; they are part of market psychology and structure.
Liquidity Hunting (Stop Loss Hunting)
Smart money knows retail traders place stop-losses above resistance or below support.
They push prices just beyond those levels, trigger stop-losses, then reverse.
Low Volume Breakouts
If breakout happens without strong participation, it’s usually unsustainable.
News & Events
A sudden announcement can cause sharp moves, but once news fades, price falls back.
Algorithmic Manipulation
High-frequency traders may push price beyond levels to create artificial breakouts.
Market Sentiment & Greed
Traders chase breakouts blindly, creating temporary momentum before exhaustion.
🔹 Part 4: Spotting Genuine Breakouts vs Fakeouts
✅ Clues for Real Breakouts
High Volume: Breakouts with above-average volume are stronger.
Retest of Levels: After breakout, price pulls back to test old support/resistance, then resumes trend.
Strong Candle Closes: Large body candles closing beyond the level.
Market Context: Aligns with larger trend or macroeconomic strength.
❌ Signs of Fakeouts
Breakout with low or declining volume.
Long wicks (shadows) beyond resistance/support but weak closes.
Breakouts during off-market hours or thin liquidity.
Price immediately snaps back into range after breakout.
🔹 Part 5: Chart Patterns & Fakeouts
Range Breakouts
Markets consolidate between two levels.
Breakouts beyond range are powerful but also prone to fakeouts.
Triangle Breakouts
Symmetrical/ascending/descending triangles show compression.
Fakeouts are common before the “real” breakout.
Head & Shoulders Pattern
A breakdown below the neckline should confirm trend reversal.
Many times, price breaks below neckline but quickly recovers.
Flag & Pennant Patterns
Strong continuation patterns, but fake breakouts happen if volume is missing.
🔹 Part 6: Strategies to Trade Breakouts & Avoid Fakeouts
1. Wait for Candle Close Confirmation
Don’t jump in immediately; wait for the candle to close above/below the level.
2. Use Volume as Filter
Only trade breakouts with above-average volume.
3. Retest Strategy
Enter on pullback to old support/resistance (safer entry).
4. Multi-Timeframe Confirmation
If breakout is visible on both 1-hour and daily charts, it’s stronger.
5. Combine with Indicators
RSI divergence can warn of false breakout.
Moving averages can confirm trend direction.
6. Avoid News-Driven Breakouts
Trade technical breakouts, not temporary news spikes.
🔹 Part 7: Risk Management in Breakout Trading
Even the best trader cannot avoid fakeouts completely. That’s why risk management is key.
Position Sizing: Risk only 1–2% of account per trade.
Stop Loss Placement:
For upside breakout: place SL below breakout level.
For downside breakout: place SL above breakdown level.
Use Partial Profits: Book some profit early, trail the rest.
Don’t Chase Breakouts: If you miss the first entry, don’t enter late.
🔹 Part 8: Real-Life Examples
Example 1: Stock Breakout
Stock consolidates between ₹500–₹520 for 2 weeks.
Breaks ₹520 with high volume, rallies to ₹550. (Real breakout)
Example 2: Crypto Fakeout
Bitcoin breaks $30,000 resistance but fails to sustain.
Falls back to $29,000 within hours. (Bull trap fakeout)
Example 3: Forex False Breakdown
EUR/USD breaks below 1.1000, triggering short trades.
Reverses sharply to 1.1050. (Bear trap fakeout)
🔹 Part 9: Psychology Behind Breakouts & Fakeouts
Retail Traders: Chase price blindly.
Institutions: Create liquidity zones by triggering retail stop-losses.
Fear & Greed: Traders either fear missing out (FOMO) or panic at reversals.
Patience vs Impulsiveness: Successful traders wait for confirmation, while impulsive ones fall for fakeouts.
🔹 Part 10: Advanced Tips for Professionals
Volume Profile Analysis
See if breakout aligns with high-volume nodes (strong support/resistance).
Order Flow Tools (Level II Data, Footprint Charts)
Helps spot whether breakout is supported by real buying/selling.
Breakout with Trend Alignment
Always trade in direction of higher-timeframe trend.
Market Timing
Breakouts during main sessions (like US market open) are more reliable.
🔹 Conclusion
Breakouts & fakeouts are two sides of the same coin. While real breakouts can deliver powerful moves, fakeouts are equally common and dangerous. The key lies in:
Confirming with volume, retests, and candle closes.
Avoiding emotional FOMO trades.
Protecting capital with risk management.
If you understand the psychology behind breakouts and fakeouts, use confirmation tools, and trade with patience, you can avoid traps and capture the big trend moves that follow genuine breakouts.
Part 4 Learn Institutional Trading Option Greeks (Risk Measures)
Greeks are mathematical tools that measure how sensitive an option is to different factors:
Delta: Sensitivity to price change. (How much option moves if stock moves ₹1).
Gamma: Rate of change of delta.
Theta: Time decay (how much option loses value as expiry nears).
Vega: Sensitivity to volatility.
Rho: Sensitivity to interest rates.
Traders use Greeks to build precise strategies.
Option Strategies
Options can be combined into powerful strategies:
Single-leg: Buy call, Buy put, Sell call, Sell put.
Spreads: Bull call spread, Bear put spread.
Neutral strategies: Iron condor, Butterfly spread, Straddle, Strangle.
Advanced: Calendar spread, Ratio spread.
Each strategy suits different market conditions (bullish, bearish, sideways, volatile).

Tata Steel Price Action Secrets |Backtesting Breakouts & SupportIn this video, I break down Tata Steel’s historical price action to understand its trading behavior. By backtesting past levels, we identify whether the stock respects support zones or follows breakout structures more reliably. This step-by-step analysis shows how to build your own tested data, spot recurring patterns, and improve decision-making in real trades.

AI Trading Psychology1. The Role of Psychology in Traditional Trading
Before AI, trading was primarily a human-driven endeavor. Every market move reflected the collective emotions of thousands of participants. Understanding traditional trading psychology provides the foundation for how AI modifies it.
Key Psychological Factors in Human Trading
Fear and Greed: Fear leads to panic selling; greed fuels bubbles. Together, they explain much of market volatility.
Loss Aversion: Traders hate losing money more than they enjoy making money. This leads to holding losing trades too long and selling winners too early.
Overconfidence: Many traders believe their analysis is superior, leading to risky positions and underestimating market uncertainty.
Herd Behavior: People often follow the crowd, especially in uncertain conditions, which creates manias and crashes.
Confirmation Bias: Traders seek information that supports their views and ignore contradictory evidence.
Example
During the 2008 financial crisis, fear spread faster than rational analysis. Even fundamentally strong stocks were sold off because investor psychology turned negative. Similarly, the Dot-com bubble of 2000 was fueled more by collective greed and hype than by realistic fundamentals.
In short, psychology is central to markets. AI trading challenges this dynamic by removing emotional decision-making from the execution layer.
2. How AI Transforms Trading Psychology
AI changes trading psychology in two major ways:
On the trader’s side, by reducing the emotional burden of decision-making.
On the market’s side, by reshaping collective behavior through algorithmic dominance.
AI’s Strengths in Overcoming Human Weaknesses
No emotions: AI doesn’t panic, doesn’t get greedy, and doesn’t second-guess itself.
Data-driven: It relies on massive datasets instead of gut feelings.
Consistency: It sticks to strategy rules without deviation.
Speed: It reacts in milliseconds, often before human traders even notice market changes.
Example
High-frequency trading (HFT) firms use algorithms that can execute thousands of trades per second. Their strategies rely on speed and mathematics, not human intuition. The psychological edge comes from removing human hesitation and inconsistency.
The Psychological Shift
For traders, using AI means learning to trust algorithms over instinct. This is not easy, because humans are naturally emotional and skeptical of machines making high-stakes financial decisions. The new psychological challenge is not just controlling one’s emotions but balancing trust and oversight in AI systems.
3. Human-AI Interaction: Trust, Fear, and Overreliance
One of the most important psychological dimensions of AI trading is human trust in technology. Traders must decide how much autonomy to give AI.
Trust Issues
Overtrust: Believing AI is infallible, leading to blind reliance.
Undertrust: Constantly interfering with AI decisions, which undermines performance.
Fear of the Unknown
Many traders feel anxious about “black-box AI” models like deep learning, where even developers cannot fully explain why the system makes certain decisions. This lack of transparency creates psychological unease.
Overreliance
Some traders outsource their entire decision-making process to AI. While this removes emotional interference, it also creates dependency. If the system fails or encounters unseen market conditions, the trader may be ill-prepared to respond.
Example
The 2010 Flash Crash showed the danger of overreliance. Algorithms created a cascade of selling that temporarily erased nearly $1 trillion in market value within minutes. Human oversight was slow to react because many traders trusted the machines too much.
This highlights a paradox: AI reduces human psychological flaws but introduces new psychological risks related to trust, dependence, and control.
4. Cognitive Biases in AI Trading
Although AI itself is not emotional, the humans designing and using AI systems bring their own biases into the process.
Designer Bias
AI reflects the assumptions, goals, and limitations of its creators.
For example, if a model is trained only on bullish market data, it may perform poorly in bear markets.
User Bias
Traders may interpret AI outputs selectively, aligning them with pre-existing beliefs (confirmation bias).
Some traders only follow AI signals when they match their own intuition, which defeats the purpose.
Automation Bias
Humans tend to favor automated suggestions over their own judgment, even when the machine is wrong. In trading, this can lead to dangerous blind spots.
Anchoring Bias
If an AI system provides a target price, traders may anchor to that number instead of re-evaluating based on new data.
In essence, AI does not eliminate psychological biases; it shifts them from direct decision-making to the way humans interact with AI systems.
5. Emotional Detachment vs. Emotional Influence
AI offers emotional detachment in execution. A machine doesn’t panic-sell during volatility. But human emotions still play a role in how AI systems are used.
Benefits of Emotional Detachment
Prevents irrational trades during panic.
Maintains discipline in following strategies.
Reduces stress and fatigue from constant monitoring.
The Emotional Influence Remains
Traders still feel anxiety when giving up control.
Profit or loss generated by AI still triggers emotional reactions.
Traders may override AI decisions impulsively, especially after losses.
Example
A retail trader using an AI-based trading bot may panic when seeing consecutive losses and shut it down prematurely, even if the system is statistically sound in the long run. Here, psychology undermines the benefit of AI’s discipline.
6. AI’s Psychological Impact on Market Participants
AI does not only affect individual traders—it changes the psychology of entire markets.
Increased Efficiency but Reduced Transparency
Markets with high algorithmic participation move faster and more efficiently. However, the lack of transparency in AI strategies creates uncertainty, which increases anxiety among traditional traders.
Psychological Divide
Professional traders with AI tools feel empowered, confident, and competitive.
Retail traders without access often feel disadvantaged and fearful of being exploited by machines.
Market Sentiment Acceleration
AI can amplify psychological extremes:
Positive sentiment spreads faster due to automated buying.
Negative sentiment cascades into rapid sell-offs.
This leads to shorter cycles of fear and greed, creating more volatile but efficient markets.
7. Ethical and Behavioral Implications
AI trading psychology extends into ethics and behavior.
Ethical Questions
Should traders use AI to exploit behavioral weaknesses of retail investors?
Is it ethical for algorithms to manipulate order books or engage in predatory strategies?
Behavioral Shifts
Younger traders may grow up trusting AI more than human intuition.
Traditional investors may resist, clinging to human-driven analysis.
This divide reflects not just technological adoption but also psychological adaptation to a new era of finance.
8. The Future of AI Trading Psychology
Looking ahead, AI trading psychology will continue to evolve.
Human-AI Symbiosis
The best outcomes will likely come from a hybrid approach:
AI handles execution and data analysis.
Humans provide judgment, ethical oversight, and adaptability.
Enhanced Transparency
To build trust, future AI systems may integrate explainable AI (XAI), allowing traders to understand the reasoning behind decisions. This will reduce anxiety and increase confidence.
Education and Adaptation
As traders become more familiar with AI, the psychological barriers of fear and mistrust will decline. Training in both technology and behavioral finance will be essential.
Market Psychology Evolution
Over time, collective market psychology may shift. Instead of being dominated by fear and greed of individuals, markets may increasingly reflect the programmed logic and optimization goals of algorithms. However, since humans still control AI design, psychology will never fully disappear—it will just manifest differently.
Conclusion
AI trading psychology is a fascinating blend of traditional behavioral finance and modern technological adaptation. While AI removes human emotions from execution, it introduces new psychological dynamics: trust, fear, overreliance, and ethical dilemmas.
The key insight is that psychology doesn’t vanish with AI—it transforms. Traders must now master not only their own emotions but also their relationship with algorithms. At the same time, AI reshapes the collective psychology of markets, accelerating cycles of fear and greed while creating new layers of uncertainty.
In the future, the traders who succeed will not be those who fight against AI, but those who learn to integrate human intuition with machine intelligence, balancing emotional wisdom with computational power.

Role of Brokers and Sub-Brokers in IndiaIntroduction
The Indian financial market is one of the largest and fastest-growing markets in the world, supported by a strong regulatory framework, technological adoption, and rising investor participation. Stock exchanges like the Bombay Stock Exchange (BSE) and the National Stock Exchange (NSE) are at the center of this growth, facilitating billions of trades every day. But ordinary investors cannot directly access these exchanges—there is an important intermediary system that bridges the gap between the investor and the stock market.
This intermediary system consists of stock brokers and sub-brokers, who play a pivotal role in connecting individuals and institutions to the securities market. Their functions go beyond simply buying and selling shares—they are responsible for advisory services, compliance, risk management, investor education, and ensuring fair trade execution.
In this article, we will explore in detail the role of brokers and sub-brokers in India, their regulatory framework, services, business models, challenges, and the evolving dynamics of brokerage in a digital-first economy.
Chapter 1: Understanding Brokers in India
1.1 Who is a Broker?
A stock broker is a market intermediary who is authorized to trade in securities on behalf of investors. Brokers are registered members of recognized stock exchanges like BSE, NSE, MCX, etc., and they execute buy/sell orders for clients in return for a commission or brokerage fee.
A broker can be:
Full-service broker: Offers a wide range of services including investment advice, research, portfolio management, and wealth management. Examples: ICICI Direct, Kotak Securities, HDFC Securities.
Discount broker: Focuses on low-cost trading with minimal services, leveraging technology to reduce costs. Examples: Zerodha, Upstox, Angel One, Groww.
1.2 Role of Brokers in the Indian Capital Market
The broker’s role is not limited to just order execution. Their responsibilities include:
Order Execution: Placing buy/sell orders for clients at the best possible prices.
Advisory Services: Guiding investors on market trends, stock recommendations, and investment strategies.
Research & Analysis: Providing technical, fundamental, and sectoral research reports.
Compliance & KYC: Ensuring client KYC, anti-money laundering (AML) checks, and regulatory compliance.
Risk Management: Monitoring margin requirements, exposure limits, and preventing defaults.
Investor Education: Conducting webinars, training, and knowledge sessions for retail investors.
Chapter 2: Understanding Sub-Brokers in India
2.1 Who is a Sub-Broker?
A sub-broker is an agent or franchisee who works under a registered broker to provide access to clients. Unlike brokers, sub-brokers are not direct members of the stock exchange. They act as local representatives of big brokerage houses, extending their services to smaller towns and cities.
For example: A small-town investor in Uttar Pradesh may trade via a sub-broker of ICICI Direct or Angel One, instead of directly connecting with the central brokerage.
2.2 Functions of Sub-Brokers
Client Acquisition: Bringing in new investors from local regions.
Client Servicing: Assisting clients with account opening, trade execution, and documentation.
Relationship Management: Maintaining trust and long-term relations with investors.
Education: Guiding first-time investors about markets and trading platforms.
Revenue Sharing: Earning a portion of brokerage generated by clients they onboard.
2.3 Sub-Broker vs Authorized Person (AP)
Earlier, SEBI recognized “sub-brokers” as intermediaries. However, since 2018, the concept of sub-brokers has been merged with the category of Authorized Persons (APs).
A sub-broker license is no longer issued.
New intermediaries now register as Authorized Persons under brokers, making the system simpler and more transparent.
Chapter 3: Regulatory Framework Governing Brokers and Sub-Brokers
3.1 SEBI Regulations
The Securities and Exchange Board of India (SEBI) regulates all brokers and sub-brokers in India. Key responsibilities include:
Registration of brokers and APs.
Setting capital adequacy requirements.
Ensuring fair practices and investor protection.
Monitoring brokerage charges.
Enforcing compliance, penalties, and suspensions when required.
3.2 Stock Exchanges’ Role
Exchanges like NSE and BSE maintain:
Membership eligibility criteria.
Trading and risk management systems.
Grievance redressal mechanisms for clients.
3.3 Compliance Requirements for Brokers
Net Worth Requirements: Minimum net worth for full-service and discount brokers.
Deposits: Security deposits with stock exchanges.
KYC Norms: Adherence to KYC and AML regulations.
Audit Reports: Submission of financial and compliance audits.
Chapter 4: Services Offered by Brokers and Sub-Brokers
4.1 Trading Facilities
Equity delivery & intraday trading.
Futures & options (F&O) derivatives trading.
Commodity trading (MCX, NCDEX).
Currency derivatives.
4.2 Investment Services
Mutual funds distribution.
IPO investments.
Bonds, debentures, and government securities.
Portfolio management services (PMS).
4.3 Research & Advisory
Technical charts, indicators, and patterns.
Fundamental analysis of companies.
Sectoral & macroeconomic research.
Personalized advisory for HNIs (High Net Worth Individuals).
4.4 Technology & Platforms
Modern brokers offer:
Mobile trading apps.
Algo-trading and APIs.
AI-based portfolio analysis.
Robo-advisory services.
Chapter 5: Business Models of Brokers and Sub-Brokers
5.1 Brokerage Fee Models
Percentage-based brokerage: Charged as % of transaction value (common in full-service brokers).
Flat-fee brokerage: Fixed fee per trade (popular with discount brokers like Zerodha, Groww).
5.2 Revenue Sharing Model with Sub-Brokers/APs
Sub-brokers earn a percentage (30–60%) of the brokerage generated by their clients.
Larger franchisees with bigger client bases get better revenue-sharing ratios.
5.3 Value-Added Services
Insurance distribution.
Wealth management.
Research subscriptions.
Chapter 6: Importance of Brokers and Sub-Brokers in India
Market Access: Enable lakhs of investors to trade without being direct members of exchanges.
Financial Inclusion: Expand capital market reach to tier-2 and tier-3 cities.
Liquidity Creation: More participants = higher market liquidity.
Investor Education: Teach first-time traders about risks and opportunities.
Compliance & Safety: Safeguard investors through regulated trading systems.
Chapter 7: Challenges Faced by Brokers and Sub-Brokers
Competition from Discount Brokers: Traditional brokers face pricing pressure.
Regulatory Burden: Constant compliance requirements increase costs.
Technological Upgradation: Need to invest heavily in digital platforms.
Client Defaults & Fraud: Risk of misuse of margin or client funds.
Thin Margins: Reduced brokerage rates have lowered profitability.
Chapter 8: Future of Brokers and Sub-Brokers in India
Shift to Technology: AI, machine learning, and algo-trading adoption.
Rise of Discount Brokers: Market share shifting to low-cost platforms like Zerodha & Groww.
Hybrid Model: Combination of advisory + low-cost execution.
Financial Inclusion: Deeper penetration in rural India through APs and digital platforms.
Global Integration: Indian brokers offering access to global equities, ETFs, and commodities.
Conclusion
Brokers and sub-brokers (or Authorized Persons) form the backbone of India’s stock market ecosystem. They democratize access to markets, educate investors, provide liquidity, and ensure regulatory compliance. Over the decades, their role has evolved from traditional floor-based trading to digital-first platforms, with a growing emphasis on low-cost execution, technology, and advisory services.
While discount brokers are reshaping the competitive landscape, full-service brokers and sub-brokers remain vital for personalized services, financial literacy, and expanding market reach. The future will likely see a convergence of technology, advisory, and financial inclusion, making brokers and sub-brokers even more crucial in India’s journey toward becoming a global financial powerhouse.

Part 1 Ride The Big MovesKey Terminologies in Options
Before diving deeper, you need to know the “language of options.”
Strike Price → The fixed price at which you can buy/sell (like 2500 in Reliance example).
Premium → The cost you pay to buy an option.
Expiry Date → Options have a life—weekly, monthly, quarterly. After expiry, they are worthless.
Lot Size → Options are not traded in single shares. They come in fixed quantities called lots (e.g., Nifty lot size = 50).
In the Money (ITM) → Option has intrinsic value.
Out of the Money (OTM) → Option has no value (only time value).
At the Money (ATM) → Strike price = Current market price.
How Option Prices Are Decided
Option premiums are not random. They are influenced by:
Intrinsic Value (IV) → Difference between current price and strike price.
Example: Reliance at ₹2600, Call 2500 → Intrinsic value = ₹100.
Time Value → More time till expiry = higher premium.
Volatility → If a stock is volatile, options are expensive because chances of big movement are high.
Interest rates & Dividends → Minor but relevant in longer-term options.

F&O Trading & SEBI Regulations1. Introduction
The Indian stock market has seen remarkable growth over the last few decades, and one of the most fascinating areas of this growth has been in derivatives trading. Derivatives are financial instruments that derive their value from an underlying asset, and in India, the most widely traded derivatives are Futures and Options (F&O).
F&O trading allows investors and traders to participate in the price movement of stocks, indices, and commodities without necessarily owning them. It provides opportunities to hedge risks, speculate, and arbitrage.
However, with great power comes great responsibility. The Securities and Exchange Board of India (SEBI)—the market regulator—plays a crucial role in ensuring that F&O trading does not turn into a high-risk gamble for unsuspecting investors. SEBI lays down strict rules and guidelines to maintain market integrity, protect investors, and reduce systemic risks.
This article will give you a comprehensive understanding of F&O trading and SEBI’s regulations governing it.
2. Understanding Derivatives
Before diving into F&O, let’s clarify what derivatives are.
A derivative is a financial contract whose value depends on the performance of an underlying asset. In India, the underlying assets include:
Equity shares (like Reliance, Infosys, HDFC Bank)
Stock indices (like Nifty 50, Bank Nifty)
Commodities (like gold, crude oil)
Currencies (like USD/INR)
Types of derivatives:
Forwards – Customized contracts between two parties, traded over-the-counter (OTC).
Futures – Standardized contracts traded on exchanges like NSE & BSE.
Options – Contracts that give the right, but not the obligation, to buy or sell an asset.
Swaps – Mostly used in currency and interest rate markets.
In India, Futures and Options are the most liquid and popular derivative instruments, especially in the stock market.
3. What is F&O Trading?
3.1 Futures
A Futures contract is an agreement to buy or sell an underlying asset at a predetermined price on a specific date in the future.
Example: If you buy Nifty Futures at 20,000 today, you are betting that Nifty will be above 20,000 on the expiry date.
If Nifty rises to 20,500, you make a profit.
If Nifty falls to 19,500, you incur a loss.
3.2 Options
An Options contract gives the buyer the right but not the obligation to buy or sell the underlying asset at a predetermined price.
Two types of options:
Call Option (CE): Right to buy.
Put Option (PE): Right to sell.
Example:
If you buy Reliance Call Option at ₹2,500 strike, you profit if Reliance moves above ₹2,500.
If you buy Reliance Put Option at ₹2,500 strike, you profit if Reliance falls below ₹2,500.
Options also have premium, strike price, and expiry terms.
3.3 Why do people trade F&O?
Hedging: Protecting investments from adverse price movements.
Speculation: Betting on price movements for profit.
Arbitrage: Exploiting price differences between markets.
Leverage: Controlling large positions with small capital.
4. Growth of F&O Trading in India
The Indian F&O market has grown tremendously since it was introduced in 2000. NSE and BSE both offer equity derivatives, but NSE has emerged as the dominant player.
Key reasons for popularity:
High liquidity in index derivatives like Nifty 50 & Bank Nifty.
Opportunity for intraday traders to capture price swings.
Low margin requirements compared to cash market.
Availability of weekly options.
However, SEBI has also noticed risks—especially from retail investors treating F&O like gambling, leading to heavy losses. Reports show that nearly 9 out of 10 retail traders lose money in F&O trading.
This has pushed SEBI to tighten regulations.
5. SEBI’s Role in Regulating F&O
The Securities and Exchange Board of India (SEBI) is the watchdog of Indian financial markets. Its mission is to:
Protect investor interests.
Promote fair and efficient markets.
Regulate intermediaries and stock exchanges.
Minimize systemic risks.
For F&O trading, SEBI has set strict rules, margins, disclosures, and eligibility criteria.
6. SEBI Regulations on F&O Trading
Let’s explore the major regulations SEBI has imposed:
6.1 Eligibility of Stocks for Derivatives
Not all stocks can be traded in F&O. To qualify:
The stock must have a minimum market capitalization of ₹5,000 crore.
Average daily traded value should be high.
Adequate liquidity must exist.
Price band restrictions and surveillance mechanisms should be applicable.
This ensures that only liquid and stable stocks are allowed in F&O.
6.2 Contract Specifications
SEBI mandates standardization of contracts:
Lot size: Minimum notional value (₹5-10 lakhs).
Expiry: Monthly & weekly expiries.
Strike intervals: Based on stock/index price range.
Tick size: ₹0.05 for equity derivatives.
This standardization prevents manipulation.
6.3 Margin Requirements
Margins are crucial in derivatives as they are leveraged products.
Types of margins:
SPAN Margin – Based on risk of position.
Exposure Margin – Additional buffer.
Premium Margin – For option buyers.
Mark-to-Market (MTM) Margin – Daily settlement of gains/losses.
This ensures that traders have skin in the game and cannot default.
6.4 Risk Mitigation Measures
Daily price bands for stocks in derivatives.
Position limits for clients, members, and FIIs.
Ban periods for stocks crossing OI (Open Interest) limits.
Intraday monitoring of margins and positions.
6.5 Disclosure Requirements
Brokers must give risk disclosure documents before enabling F&O trading.
Investors must sign an agreement acknowledging risks.
Margin details and exposure reports are sent via SMS/email daily.
6.6 Segregation of Clients’ Funds
Brokers must segregate their own funds from clients’ funds. Misuse of client collateral is strictly prohibited.
6.7 Investor Protection & Education
SEBI regularly issues advisories warning retail traders about F&O risks.
Investor education campaigns (e.g., “Options are not lottery tickets”).
Free online resources for risk management.
7. SEBI’s New Regulations (Recent Developments)
In the last few years, SEBI has tightened norms further:
Peak Margin Reporting (2021):
Traders must maintain full margin upfront.
No more leveraging via intraday tricks.
Intraday Leverage Ban (2022):
Brokers cannot offer more than 20% margin funding.
This reduced excessive speculation.
Increased Disclosure of F&O Risks (2023-24):
Exchanges must display warnings showing percentage of retail traders losing money.
Eligibility Tightening (2023):
SEBI proposed reviewing stocks in derivatives regularly. Illiquid stocks may be excluded.
Investor Suitability Check (2024 Proposal):
Only financially literate and risk-capable investors may be allowed in F&O in future.
8. Benefits of SEBI Regulations
Market Stability: Prevents manipulation and speculation bubbles.
Investor Protection: Safeguards retail traders from blind gambling.
Transparency: Standardized contracts and disclosure norms.
Risk Management: Margins and limits reduce systemic collapse.
Trust in Markets: Encourages more participation in regulated environment.
9. Challenges & Criticisms
Despite SEBI’s efforts, challenges remain:
Retail Traders’ Losses: Majority still lose money due to lack of knowledge.
Over-regulation Concerns: Some argue SEBI rules reduce liquidity.
Complexity: F&O remains difficult for beginners despite regulations.
Broker Malpractices: Some brokers mis-sell options strategies to clients.
Speculative Craze: Many traders treat weekly options like gambling.
10. Future of F&O Trading in India
Looking ahead:
F&O will remain the largest contributor to market volumes.
SEBI may bring financial literacy tests before allowing retail traders.
More focus on institutional participation and reducing retail over-exposure.
Increased use of AI-driven surveillance to detect manipulation.
Potential restrictions on weekly options if speculation rises.
Conclusion
Futures and Options trading is an exciting and powerful tool in the financial markets, offering opportunities for hedging, speculation, and arbitrage. But it is also risky, especially for retail investors without proper knowledge and discipline.
The Securities and Exchange Board of India (SEBI) plays a vital role in ensuring that F&O trading remains fair, transparent, and not a casino for retail investors. Its regulations on eligibility, margins, disclosures, and risk management are designed to create a balance between freedom and protection.
As India’s capital markets continue to grow, SEBI’s regulations will evolve further. Traders must remember that regulations are not restrictions but safeguards—helping ensure that markets grow sustainably while protecting investors.
The future of F&O in India is bright, but only if traders approach it with knowledge, discipline, and respect for risk management.

Divergence SecretsOptions vs Futures
Futures = Obligation to buy/sell at fixed price.
Options = Right but not obligation.
Options require smaller margin (if buying).
Real-Life Example of Hedging
Suppose you own TCS shares worth ₹10 lakhs. You fear the market may fall in the next month.
👉 Solution: Buy a Put Option.
Strike: Slightly below current market price.
Cost: Small premium.
If market falls → Loss in shares covered by profit in Put.
If market rises → You lose premium but enjoy profit in shares.
This is like insurance.
Psychology of Options Trading
Options require quick decision-making. Traders often get trapped in:
Over-leverage → Buying too many lots.
Greed → Holding positions too long.
Fear → Exiting too early.
Successful option traders follow discipline, risk management, and proper strategy.

Introduction to Stock Markets1. What is a Stock Market?
At its core, a stock market is a marketplace where buyers and sellers trade shares of publicly listed companies. A share represents a unit of ownership in a company, meaning that if you own a share, you essentially own a part of that company.
Stock markets serve multiple functions:
Raising Capital: Companies issue shares to raise funds for expansion, research, or debt repayment.
Liquidity: They allow investors to buy and sell shares easily.
Price Discovery: They determine the market value of companies based on supply and demand.
Investment Opportunities: They provide avenues for individuals and institutions to grow their wealth.
Two primary types of stock markets exist:
Primary Market: Where companies issue new shares through an Initial Public Offering (IPO) to raise capital.
Secondary Market: Where existing shares are traded among investors. Examples include the New York Stock Exchange (NYSE), NASDAQ, and India’s National Stock Exchange (NSE) and Bombay Stock Exchange (BSE).
2. History and Evolution of Stock Markets
The concept of stock markets dates back to the 17th century. The first organized stock exchange, the Amsterdam Stock Exchange, was established in 1602 for trading shares of the Dutch East India Company. Over time, stock markets spread globally, evolving into sophisticated institutions with advanced trading systems, regulations, and digital platforms.
Key milestones in stock market history include:
1792: The Buttonwood Agreement in New York, which marked the start of the NYSE.
1971: NASDAQ introduced electronic trading, revolutionizing speed and accessibility.
1990s: Introduction of online trading platforms, making markets accessible to retail investors.
3. Importance of Stock Markets
Stock markets are critical for both individual investors and the overall economy.
3.1 Economic Growth
Companies raise capital through stock issuance to expand operations, hire employees, and innovate.
Capital formation fuels industrial growth, increasing productivity and GDP.
3.2 Wealth Creation
Long-term investment in equities historically outperforms other asset classes like bonds or savings accounts.
Compound growth in stock investments allows individuals to accumulate substantial wealth over time.
3.3 Price Transparency
Stock markets provide real-time pricing based on supply and demand, reflecting the true value of companies.
Transparent markets reduce information asymmetry and promote investor confidence.
3.4 Corporate Governance
Listed companies must comply with regulatory norms and disclose financial information, ensuring accountability.
Shareholders gain a voice in company decisions through voting rights.
4. Types of Stocks
Stocks are not uniform. They vary based on ownership, risk, and returns. Common types include:
4.1 Common Stocks
Represent ownership in a company with voting rights.
Returns come in the form of dividends and capital appreciation.
4.2 Preferred Stocks
Offer fixed dividends but limited voting rights.
Generally less volatile than common stocks.
4.3 Growth vs. Value Stocks
Growth Stocks: Companies expected to grow faster than the market average. Returns are mostly capital gains.
Value Stocks: Companies trading below their intrinsic value, often providing steady dividends.
4.4 Blue-Chip Stocks
Large, financially stable companies with strong performance histories.
Example: Reliance Industries, Apple, Microsoft.
5. How the Stock Market Works
The stock market operates on the principles of supply and demand. Prices rise when demand exceeds supply and fall when supply exceeds demand.
5.1 Market Participants
Retail Investors: Individuals trading for personal wealth creation.
Institutional Investors: Banks, mutual funds, hedge funds trading in large volumes.
Traders: Short-term participants aiming to profit from price movements.
Market Makers: Entities that ensure liquidity by buying and selling securities.
5.2 Stock Exchanges
A stock exchange is a regulated platform where stocks are bought and sold.
Examples include NYSE, NASDAQ, NSE, and BSE.
Exchanges maintain transparency, liquidity, and security of transactions.
5.3 Trading Process
Placing an Order: Investors place buy/sell orders through brokers.
Matching Orders: Exchanges match buy and sell orders based on price and time priority.
Settlement: Transfer of ownership and funds between buyer and seller, usually within 2–3 days.
6. Factors Affecting Stock Prices
Stock prices fluctuate constantly. Factors include:
Company Performance: Revenue, profits, and management quality influence investor sentiment.
Economic Indicators: GDP growth, inflation, and unemployment rates impact markets.
Market Sentiment: Investor psychology, fear, and greed can cause volatility.
Global Events: Wars, pandemics, and geopolitical tensions affect prices.
Interest Rates: Higher rates can reduce investment in equities.
7. Stock Market Indices
A stock market index measures the performance of a group of stocks. Examples:
Nifty 50 (India): Represents 50 large companies listed on NSE.
Sensex (India): Comprises 30 leading BSE-listed companies.
S&P 500 (USA): Tracks 500 major US companies.
Indices provide a snapshot of market trends and investor sentiment.
8. Investment Strategies
Investors use various strategies to achieve their financial goals.
8.1 Long-Term Investing
Focused on wealth creation over years.
Often involves buying and holding blue-chip or growth stocks.
8.2 Trading
Short-term buying and selling to profit from price fluctuations.
Types include day trading, swing trading, and momentum trading.
8.3 Value Investing
Buying undervalued stocks based on fundamental analysis.
Popularized by Warren Buffett.
8.4 Growth Investing
Focused on companies with high growth potential.
Prioritizes capital gains over dividends.
9. Risks in the Stock Market
Investing in stocks involves risk. Common risks include:
Market Risk: Overall market movements affect stock prices.
Company Risk: Poor management or declining performance can lead to losses.
Liquidity Risk: Difficulty in selling stocks without affecting price.
Interest Rate Risk: Rising rates may reduce stock prices.
Inflation Risk: High inflation can erode real returns.
Risk management strategies, such as diversification and stop-loss orders, are crucial.
10. Regulatory Framework
Stock markets are heavily regulated to protect investors and maintain stability. Key regulatory bodies include:
SEBI (India): Securities and Exchange Board of India.
SEC (USA): Securities and Exchange Commission.
FCA (UK): Financial Conduct Authority.
These organizations enforce rules on listing, trading, disclosures, insider trading, and investor protection.
Conclusion
The stock market is a powerful tool for wealth creation, economic growth, and corporate financing. Understanding its structure, functions, and risks is essential for any investor. While markets can be volatile and unpredictable, disciplined investing, research, and risk management can make the stock market a reliable avenue for achieving financial goals.
Investing in stocks is not just about money—it’s about knowledge, patience, and strategic decision-making. By embracing these principles, anyone can navigate the stock market successfully, turning it into a lifelong tool for financial empowerment.
Fundamental Analysis in Trading1. Introduction to Fundamental Analysis
Fundamental analysis is based on the principle that a stock or asset has a true intrinsic value. The market price can often deviate from this intrinsic value due to short-term sentiment, speculation, or market inefficiencies. By analyzing the underlying factors that drive a company’s performance, traders can determine whether a stock is undervalued, overvalued, or fairly priced.
1.1 Difference Between Fundamental and Technical Analysis
Fundamental Analysis (FA): Focuses on why a stock should rise or fall over the long term. Considers financial statements, economic conditions, and industry trends.
Technical Analysis (TA): Focuses on how a stock moves in the short term. Uses charts, patterns, and indicators to predict price movements.
While TA is more suited for short-term traders, FA is preferred by long-term investors or swing traders who want to understand the real value of an asset.
2. Key Components of Fundamental Analysis
Fundamental analysis can be divided into microeconomic and macroeconomic factors.
2.1 Microeconomic Factors
These relate to the company or asset itself, including:
Financial statements: Balance Sheet, Income Statement, and Cash Flow Statement.
Management quality: Experience, track record, and corporate governance.
Products and services: Market demand, competitive edge, and innovation.
Competitive position: Market share, brand strength, and barriers to entry.
Profitability and growth potential: Revenue growth, margins, and scalability.
2.2 Macroeconomic Factors
These relate to the broader economy, affecting all companies in a sector or region:
GDP growth: Indicates overall economic health.
Interest rates: Affect borrowing costs and investment attractiveness.
Inflation: Influences consumer spending and company costs.
Exchange rates: Important for companies with international operations.
Political stability and regulations: Impact business operations and investor confidence.
3. Financial Statements and Their Importance
Financial statements are the core of fundamental analysis. They provide quantitative data about a company’s performance and financial health.
3.1 Income Statement
The income statement (profit and loss statement) shows a company’s revenue, expenses, and profit over a period.
Revenue (Sales): Total income from products/services.
Cost of Goods Sold (COGS): Direct costs of production.
Gross Profit: Revenue minus COGS.
Operating Expenses: Marketing, salaries, R&D.
Net Income: Profit after all expenses and taxes.
Example:
A company with growing revenue and net income over 5 years indicates strong operational performance.
3.2 Balance Sheet
The balance sheet provides a snapshot of a company’s assets, liabilities, and equity at a point in time.
Assets: Resources the company owns (cash, inventory, equipment).
Liabilities: Debts or obligations (loans, accounts payable).
Equity: Owners’ stake in the company (Assets − Liabilities).
Example:
High cash reserves and low debt often indicate a financially stable company.
3.3 Cash Flow Statement
This statement tracks cash inflows and outflows in three categories:
Operating Activities: Cash from core business operations.
Investing Activities: Cash spent or earned on assets and investments.
Financing Activities: Cash from loans, dividends, or share issuance.
Example:
A company may report profits but have negative cash flow, signaling potential liquidity issues.
4. Key Financial Metrics for Analysis
Several ratios and metrics help traders interpret financial statements:
4.1 Profitability Ratios
Gross Margin: Gross Profit ÷ Revenue × 100
Indicates how efficiently a company produces goods.
Net Margin: Net Income ÷ Revenue × 100
Shows overall profitability.
Return on Equity (ROE): Net Income ÷ Shareholders’ Equity
Measures how effectively shareholders’ money generates profit.
4.2 Liquidity Ratios
Current Ratio: Current Assets ÷ Current Liabilities
Shows short-term debt-paying ability.
Quick Ratio: (Current Assets − Inventory) ÷ Current Liabilities
More stringent liquidity check.
4.3 Debt Ratios
Debt-to-Equity (D/E): Total Debt ÷ Shareholders’ Equity
Measures financial leverage.
Interest Coverage Ratio: EBIT ÷ Interest Expense
Assesses ability to pay interest.
4.4 Efficiency Ratios
Inventory Turnover: COGS ÷ Average Inventory
Indicates how quickly inventory sells.
Receivables Turnover: Net Credit Sales ÷ Average Accounts Receivable
Shows efficiency in collecting payments.
5. Valuation Methods
After analyzing financial health, the next step is valuation, which estimates the stock’s intrinsic value.
5.1 Discounted Cash Flow (DCF)
DCF estimates the present value of future cash flows:
Project future cash flows.
Discount them using a required rate of return.
Sum the discounted cash flows to get intrinsic value.
Insight: If DCF value > market price → undervalued; if DCF < market price → overvalued.
5.2 Price-to-Earnings (P/E) Ratio
P/E ratio = Market Price ÷ Earnings per Share (EPS)
High P/E → Market expects growth, or stock is overvalued.
Low P/E → Potential undervaluation, or growth concerns.
5.3 Price-to-Book (P/B) Ratio
P/B ratio = Market Price ÷ Book Value per Share
Useful for asset-heavy industries.
Low P/B can indicate undervaluation.
5.4 Dividend Discount Model (DDM)
DDM values companies based on future dividends:
Estimate future dividends.
Discount them to present value.
Suitable for stable dividend-paying companies.
5.5 Other Ratios
EV/EBITDA: Enterprise Value ÷ Earnings Before Interest, Taxes, Depreciation, and Amortization.
PEG Ratio: P/E ÷ Earnings Growth Rate, adjusts for growth expectations.
6. Industry and Sector Analysis
Analyzing a company in isolation is not enough. Industry and sector trends can significantly affect performance.
Growth Industry: Fast-growing sectors like technology may justify high valuations.
Mature Industry: Slower growth sectors may offer stability and dividends.
Competitive Landscape: Number of competitors, entry barriers, and pricing power.
Cyclical vs Non-Cyclical: Cyclical industries (automobiles, real estate) follow the economy, while non-cyclical (food, healthcare) remain stable.
Example:
During an economic boom, cyclicals may outperform, whereas during recessions, defensive stocks are preferred.
7. Economic and Market Factors
Fundamental analysis also incorporates macroeconomic indicators:
7.1 GDP Growth
Strong GDP growth generally supports corporate profits and stock market performance.
7.2 Inflation
High inflation increases costs, potentially squeezing margins.
7.3 Interest Rates
Rising rates increase borrowing costs and reduce spending. Conversely, lower rates stimulate growth.
7.4 Currency Fluctuations
Important for exporters/importers, affecting revenue and costs.
7.5 Political and Regulatory Environment
Government policies, taxes, and regulations can significantly impact profitability and risk.
8. Qualitative Analysis
Numbers alone are not enough. Qualitative factors help complete the picture:
Management Quality: Leadership vision, integrity, and experience.
Brand Strength: Customer loyalty and reputation.
Innovation & R&D: Ability to stay ahead of competition.
Corporate Governance: Ethical practices, transparency, and accountability.
Example:
Two companies with similar financials may differ in future prospects based on leadership quality and innovation.
9. Steps to Apply Fundamental Analysis in Trading
Define your objective: Long-term investment vs short-term swing trading.
Select the company: Choose based on industry preference or market trends.
Collect financial data: Annual reports, quarterly statements, and filings.
Analyze financials: Use ratios, margins, and cash flow statements.
Perform valuation: Apply DCF, P/E, P/B, or other methods.
Assess macro factors: Consider economic, political, and market conditions.
Check qualitative factors: Leadership, brand, innovation, and governance.
Compare with peers: Relative valuation within the industry.
Make a decision: Buy, hold, or avoid based on intrinsic value vs market price.
10. Advantages of Fundamental Analysis
Provides a deep understanding of a company’s true value.
Helps in identifying long-term investment opportunities.
Reduces reliance on market sentiment and short-term volatility.
Useful for risk management by identifying financially weak companies.
Can identify undervalued stocks with potential for growth.
Conclusion
Fundamental analysis is a cornerstone of intelligent investing. By combining financial metrics, qualitative evaluation, and macroeconomic understanding, traders can make informed decisions that go beyond market noise. While it requires patience and diligence, FA provides a roadmap for sustainable investment and risk management.
When applied carefully, it helps traders identify undervalued stocks, avoid risky bets, and build a portfolio with long-term growth potential. Remember, in trading, knowledge is power, and fundamental analysis gives you the power to see beyond the price chart.

Trading Master Class With ExpertsRisk and Reward in Options
Options provide defined risk for buyers and potential risk for sellers:
Buyers: Maximum loss = premium paid, profit = theoretically unlimited for calls, limited for puts.
Sellers (writers): Maximum profit = premium received, risk = potentially unlimited for uncovered calls, high for puts.
Example:
Selling a call without owning the stock (naked call) can lead to unlimited losses if the stock skyrockets.
Buying a put limits risk but can still profit from sharp downward moves.
Hedging with Options
Options are a powerful tool for hedging investments:
Protective Put: Buying a put on a stock you own protects against a decline.
Collar Strategy: Buy a put and sell a call to limit both upside and downside risk.
Portfolio Insurance: Large investors use index options to protect portfolios during market volatility.

Reliance 1 Day View Key Levels (1-Day Time Frame)
Based on data from Investing.com and Moneycontrol:
Day’s Range: ₹1,407.90 – ₹1,423.40
Recent Daily High (Aug 21): ₹1,431.90
Recent Daily Low (Aug 11): ₹1,361.20
From chart commentary (TradingView):
Support Zone: ₹1,385–1,400
Resistance Level: Around ₹1,423–1,431
Interpretation & Notes
Intraday activity shows movement between roughly ₹1,408 to ₹1,423.
A daily low near ₹1,408 may serve as short-term support; breaking below could test the ₹1,385–1,400 zone.
On the upside, a close above ₹1,423–1,431 might open potential to push higher.
Remember: technical levels provide guidance, not guarantees—market dynamics and fundamentals can shift price action quickly. Always cross-check with live charts and broader analysis.
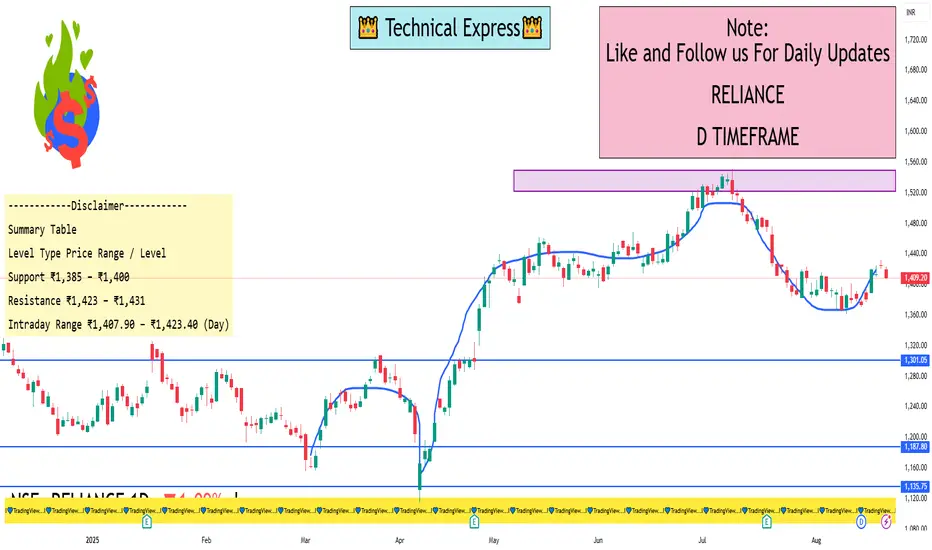
Part 2 Trading MasterclassOption Trading vs Stock Trading
Stocks = Ownership, long-term growth, dividends.
Options = Contracts, leverage, flexible strategies.
Stocks = Simpler, but capital-intensive.
Options = Complex, but require less capital and offer hedging.
For example:
Buying 100 shares of Reliance at ₹2500 = ₹2,50,000.
Buying 1 call option of Reliance at ₹100 premium with lot size 250 = only ₹25,000.
This leverage makes options attractive—but also riskier.
Real-Life Examples & Case Studies
Case 1: Bull Market
A trader buys Nifty 20000 Call at ₹200 premium. Nifty rallies to 20500. Profit = ₹300 (500 – 200). Huge return on a small premium.
Case 2: Bear Market
Investor holds TCS shares but fears a fall. Buys a protective put. When stock drops, put increases in value, reducing losses.
Case 3: Neutral Market
Trader sells an Iron Condor on Bank Nifty, betting price will stay range-bound. Premium collected = profit if market stays sideways.

Part 1 Master Candle Sticks PatternRisk Management in Options
Position Sizing: Don’t risk more than 1–2% of capital in one trade.
Stop Loss: Exit before premium erodes completely.
Avoid Over-leverage: Options look cheap but risk is real.
Hedge Positions: Combine with futures or other options.
Psychology of Option Traders
Greed: Chasing high-return trades without risk control.
Fear of Missing Out (FOMO): Jumping in near expiry due to excitement.
Patience: Waiting for correct setup is key.
Discipline: Stick to rules, avoid revenge trading.
Modern Trends in Option Trading
Weekly Expiry Craze: Thursday = biggest trading day.
0DTE (Zero Day to Expiry) Options: Popular for scalping.
Algo & AI Trading: Automated strategies now dominate.
Retail Participation Explosion: India has seen retail option traders grow 5x in 3 years.

Trading Psychology & Discipline1. What Is Trading Psychology?
Trading psychology refers to the mental and emotional aspects of trading that influence your decision-making. It’s how your mind reacts to:
Profits and losses
Winning and losing streaks
Uncertainty and market volatility
Temptation to break your rules
Two traders can have the same chart, same strategy, and same entry point — yet one will exit calmly and profitably, while the other will panic-sell at the bottom or hold a losing position too long. The difference? Mindset management.
Why It Matters:
Prevents emotional trading
Encourages rule-based decision-making
Builds resilience after losses
Allows consistent execution over years
In short, psychology determines whether your trading plan is a machine or a lottery ticket.
2. Core Psychological Biases That Hurt Traders
Even the smartest traders are vulnerable to mental shortcuts (biases) that distort judgment.
a) Loss Aversion
Losing ₹1,000 feels more painful than the joy of gaining ₹1,000.
This causes traders to hold losers too long and cut winners too early.
Example: You short Nifty futures, it moves against you by 50 points. You refuse to close, thinking “it will come back,” but it keeps falling.
Solution: Predefine your stop-loss before entering the trade.
b) Overconfidence Bias
Believing you “can’t be wrong” after a winning streak.
Leads to oversized positions, ignoring risk limits.
Example: After three profitable Bank Nifty scalps, you double your lot size, only to get stopped out instantly.
Solution: Keep position sizing rules fixed regardless of winning streaks.
c) Recency Bias
Giving too much weight to recent events, ignoring the bigger picture.
Example: Because last two trades were losses, you think your strategy “stopped working” and change it prematurely.
Solution: Judge performance over at least 20-30 trades, not 2-3.
d) FOMO (Fear of Missing Out)
Chasing entries after a move has already happened.
Example: Nifty gaps up 100 points, you jump in late — and the market reverses.
Solution: Accept that missing a trade is better than taking a bad one.
e) Anchoring Bias
Fixating on an initial price or opinion.
Example: You think Reliance “should” be worth ₹3,000 based on past data, so you keep buying dips even as fundamentals change.
Solution: Let current price action guide your bias, not past assumptions.
f) Confirmation Bias
Seeking only information that supports your existing trade idea.
Example: You’re long on TCS and only read bullish news, ignoring bearish signals.
Solution: Actively look for reasons your trade could fail.
3. The Emotional Cycle of Trading
Most traders unknowingly go through this psychological cycle repeatedly:
Optimism – You spot a setup and feel confident.
Euphoria – Trade moves in your favor, confidence peaks.
Complacency – Risk management slips.
Anxiety – Market starts reversing.
Denial – “It’s just a pullback…”
Panic – Price drops further, emotions explode.
Capitulation – Exit at the worst point.
Depression – Regret and loss of confidence.
Hope & Relief – New setup appears, cycle repeats.
Breaking this cycle requires discipline and awareness.
4. Discipline: The Backbone of Trading Success
Discipline in trading means doing what your plan says, even when your emotions scream otherwise.
Key traits:
Following entry & exit rules
Respecting stop-losses without hesitation
Avoiding overtrading
Sticking to position size limits
Logging and reviewing trades regularly
Why It’s Hard:
Because discipline often requires you to act against your instincts. Your brain is wired to avoid pain and seek pleasure — but trading sometimes demands taking small losses (pain) to protect against bigger ones, and resisting impulsive wins (pleasure) for long-term gains.
5. Mental Frameworks of Top Traders
a) Probabilistic Thinking
Each trade is just one outcome in a series of many.
Win rate and risk-reward ratio matter more than any single trade.
b) Process Over Outcome
Judge success by how well you followed your plan, not whether you made money that day.
c) Emotional Neutrality
Avoid becoming too euphoric on wins or too crushed by losses.
d) Long-Term Mindset
Focus on yearly consistency, not daily fluctuations.
6. Daily Habits for Psychological Resilience
Pre-Market Routine
Review economic calendar, market trends, and your trade plan.
Mental rehearsal: visualize sticking to stops and targets.
In-Trade Mindfulness
Avoid checking P&L every few seconds.
Focus on chart patterns, not emotions.
Post-Market Review
Journal every trade: entry, exit, reason, emotion, lesson.
Physical Health
Good sleep, hydration, exercise — all improve decision-making.
7. Practical Tools to Develop Discipline
Trading Journal – Document trades and emotions.
Checklists – Verify setups before entry.
Alarms & Alerts – Avoid staring at charts unnecessarily.
Automation – Use bracket orders to enforce stops.
Accountability Partner – Share your trade plan with someone who will question you if you deviate.
8. Common Psychological Traps & Fixes
Trap Example Fix
Revenge Trading Doubling size after loss Take mandatory cooldown break
Overtrading Taking random trades Set daily trade limit
Analysis Paralysis Too many indicators Stick to 1–3 core setups
Performance Pressure Forcing trades to meet target Focus on A+ setups only
9. A Complete Psychological Training Plan
Here’s a 4-week discipline-building plan you can use:
Week 1 – Awareness
Keep a real-time emotion log.
Identify when you break rules.
Week 2 – Rule Reinforcement
Write your trading plan in detail.
Keep it visible while trading.
Week 3 – Controlled Exposure
Trade smaller lot sizes to reduce fear.
Focus purely on execution quality.
Week 4 – Review & Adjust
Analyze mistakes.
Create a “Rule Violation Penalty” (e.g., paper trade next session).
Repeat the cycle until discipline becomes second nature.
10. Final Thoughts
You can have the best technical strategy in the world, but if your psychology is fragile and your discipline weak, the market will expose you.
Think of trading psychology as mental risk management — without it, capital risk management won’t save you.
Mastering this area won’t just improve your trades, it will improve your confidence, patience, and ability to thrive in any high-pressure decision-making environment.
Risk Management & Trading PsychologyIntroduction
In the world of trading—whether it’s stocks, forex, commodities, crypto, or derivatives—success is rarely determined by who has the most “secret” indicator or complex algorithm. Instead, it often comes down to two invisible forces:
Risk Management – the discipline of protecting capital and minimizing losses.
Trading Psychology – the mindset, emotions, and discipline that shape decision-making.
Many traders fail not because they lack knowledge, but because they lack the discipline to follow rules and the mental strength to handle stress, uncertainty, and losses. In fact, the famous trader Mark Douglas once said:
“Trading is not about being right. It’s about managing money so you can stay in the game.”
This guide will dive deeply into both pillars—Risk Management and Trading Psychology—because they are interconnected. Even the best strategy collapses without them.
Part 1: Risk Management in Trading
1.1 What is Risk Management?
Risk management is the process of identifying, assessing, and controlling risks in trading to protect your capital. It’s about ensuring that no single trade or series of trades can wipe you out.
It is not about avoiding risk completely (impossible in trading) — it’s about controlling and managing it wisely.
1.2 Why Risk Management is the Foundation of Trading
Most traders obsess over entries, patterns, and indicators. But professional traders focus first on capital preservation. Without proper risk control:
You can lose big on a single trade.
Emotions take over after large losses.
Recovery becomes exponentially harder.
Example:
If you lose 50% of your capital, you need a 100% return just to break even. That’s why avoiding large drawdowns is critical.
1.3 Core Principles of Risk Management
Let’s break them down.
A) Position Sizing
Determine the amount of capital allocated to each trade.
Common rule: Risk 1-2% of account equity per trade.
Formula:
Position Size = (Account Risk per Trade) / (Stop Loss in Points × Value per Point)
B) Stop Losses
A stop loss is a predefined exit point to cap losses.
Never move your stop loss further away because of “hope.”
Types:
Hard Stop – placed in the market.
Mental Stop – not placed in system, but requires discipline.
C) Risk-Reward Ratio
Compares potential reward to risk.
Professional traders often aim for R:R of 1:2 or higher.
Even with a win rate of 40%, a good R:R can make you profitable.
D) Diversification
Don’t put all capital in one asset or sector.
Spread exposure to reduce the impact of one bad move.
E) Avoid Overleveraging
Leverage amplifies both gains and losses.
Many accounts blow up because traders use excessive leverage.
1.4 Advanced Risk Management Concepts
A) Maximum Drawdown Limit
Set a personal limit (e.g., 15% of total equity). Stop trading if hit, review strategy, and reassess.
B) Kelly Criterion
Mathematical formula for optimal bet sizing based on win probability and payoff ratio.
C) Volatility-Based Position Sizing
Adjust trade size based on market volatility (e.g., ATR – Average True Range).
D) Hedging
Using related instruments to offset risk (e.g., buying gold when stocks are falling).
1.5 Common Risk Management Mistakes
No stop loss – leads to catastrophic losses.
Overtrading – too many positions at once increases risk exposure.
Risking too much on one trade – emotional pressure skyrockets.
Averaging down – adding to losing positions without a plan.
Ignoring correlation – multiple trades moving in the same direction increase risk.
Part 2: Trading Psychology
2.1 Why Psychology Matters in Trading
In theory, trading is simple—buy low, sell high. In reality, human emotions complicate the process:
Fear causes you to exit early.
Greed makes you overtrade.
Hope keeps you in losing trades.
Overconfidence leads to oversized bets.
The market doesn’t just test your strategy—it tests your patience, discipline, and emotional control.
2.2 Core Psychological Challenges in Trading
A) Fear
Fear of losing money → hesitation to enter.
Fear of missing out (FOMO) → chasing bad trades.
B) Greed
Leads to ignoring rules and overtrading.
Causes traders to hold winning trades too long.
C) Revenge Trading
After a loss, trying to “win it back” quickly leads to more mistakes.
D) Overconfidence
Winning streaks create a false sense of invincibility.
Causes overleveraging and sloppy risk management.
2.3 Building the Right Trading Mindset
A) Process over Outcome
Focus on following your trading plan, not just profit and loss.
B) Emotional Detachment
Think of trades as numbers and probabilities, not personal victories or failures.
C) Patience
Wait for high-probability setups rather than forcing trades.
D) Adaptability
Markets change—strategies need adjustment. Avoid rigid thinking.
2.4 Psychological Tools for Traders
A) Journaling
Record every trade: entry, exit, reason, emotions.
Review regularly to spot patterns.
B) Meditation & Mindfulness
Reduces impulsive decisions.
Improves focus.
C) Pre-Trade Routine
Check news, review charts, set risk levels before entering.
D) Post-Trade Review
Learn from both wins and losses.
2.5 How Risk Management and Psychology Connect
Strong risk management reduces emotional pressure.
Smaller losses keep confidence intact.
Knowing your worst-case scenario is limited allows you to follow the plan calmly.
Part 3: Combining Risk Management & Psychology into a Trading Plan
3.1 Components of a Trading Plan
Strategy rules – when to enter/exit.
Risk per trade – fixed % of capital.
Max daily/weekly loss – stop trading after hitting it.
Review schedule – weekly/monthly performance check.
Psychological rules – avoid trading under stress or fatigue.
3.2 Example: Professional Approach
Let’s say a trader has:
Account: ₹10,00,000
Risk per trade: 1% (₹10,000)
Stop loss: 20 points × ₹500 per point = ₹10,000
Risk-Reward ratio: 1:2 (₹10,000 risk for ₹20,000 potential gain)
Even with a 40% win rate, the trader can remain profitable.
3.3 The 3 Golden Rules
Preserve capital – your first goal is to survive.
Follow the plan – consistency beats luck.
Manage yourself – discipline is your ultimate edge.
Conclusion
Risk management and trading psychology are the true edge in markets.
You can copy someone’s strategy, but you can’t copy their discipline or mindset. A trader with average technical skills but strong risk control and emotional discipline will outperform a brilliant analyst who cannot manage losses or emotions.
The market will always test you. The question is—will you react emotionally, or will you act according to your plan?
Mastering both risk management and psychology ensures that no matter what the market throws your way, you will still be standing, ready for the next opportunity.

Part 2 Ride The Big MovesAdvanced Options Strategies
Butterfly Spread
When to Use: Expect stock to stay near a specific price.
How It Works: Buy 1 ITM option, sell 2 ATM options, buy 1 OTM option.
Risk: Limited.
Reward: Highest if stock ends at middle strike.
Example: Stock ₹100, buy call ₹95, sell 2 calls ₹100, buy call ₹105.
Calendar Spread
When to Use: Expect low short-term volatility but possible long-term move.
How It Works: Sell short-term option, buy long-term option at same strike.
Risk: Limited to net premium.
Reward: Comes from time decay of short option.
Ratio Spread
When to Use: Expect limited move in one direction.
How It Works: Buy 1 option, sell multiple options at different strikes.
Risk: Unlimited on one side if not hedged.
Diagonal Spread
When to Use: Expect gradual move over time.
How It Works: Buy long-term option at one strike, sell short-term option at different strike.
