Part2 Ride The Big Moves Intermediate Options Strategies
Bull Call Spread
When to Use: Expect moderate price rise.
How It Works: Buy a call at a lower strike, sell a call at higher strike.
Risk: Limited to net premium paid.
Reward: Limited to strike difference minus premium.
Example: Buy call at ₹100 (₹5), sell call at ₹110 (₹2). Net cost ₹3. Max profit ₹7.
Bear Put Spread
When to Use: Expect moderate decline.
How It Works: Buy put at higher strike, sell put at lower strike.
Risk: Limited to net premium paid.
Reward: Limited but cheaper than buying a single put.
Example: Buy put ₹105 (₹6), sell put ₹95 (₹3). Net cost ₹3. Max profit ₹7.
Tatasteel

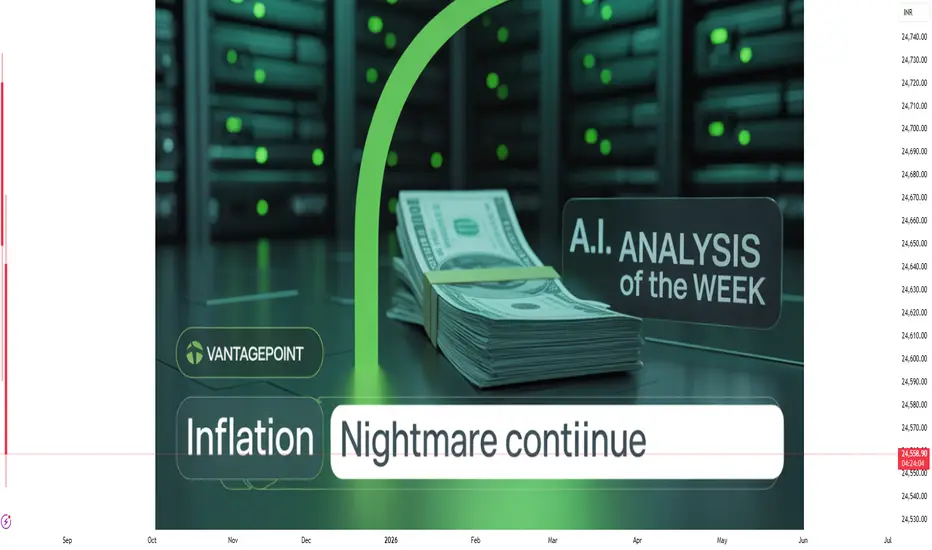
Inflation NightmareIntroduction
Inflation—defined as the general rise in prices of goods and services over time—is a double-edged sword in any economy. When moderate, it can stimulate spending and investment. But when inflation spirals out of control, it becomes an economic nightmare that can erode savings, destroy purchasing power, disrupt businesses, and destabilize entire nations. An inflation nightmare is not merely about rising costs—it is a systemic, psychological, and financial breakdown that touches every layer of society.
This 3000-word exploration of the "Inflation Nightmare" will take you through its root causes, real-world examples, economic consequences, societal impact, central bank responses, and lessons for investors, policymakers, and citizens.
1. What Is Inflation?
Inflation is measured by tracking price increases across a basket of essential goods and services, usually using indices such as the Consumer Price Index (CPI) or Wholesale Price Index (WPI). A modest inflation rate (2–3% annually) is often considered healthy for economic growth. However, inflation turns into a nightmare when it exceeds manageable levels—either due to demand-pull factors (too much money chasing too few goods), cost-push dynamics (rising production costs), or monetary mismanagement.
Types of Inflation:
Creeping Inflation – Slow and steady; manageable.
Walking Inflation – Moderate; begins to affect spending and investment.
Galloping Inflation – High inflation (10%+ annually); dangerous.
Hyperinflation – Extreme, uncontrolled inflation (50%+ monthly); catastrophic.
2. Causes of an Inflation Nightmare
a. Monetary Policy Failure
Central banks print money to boost economic activity. But excessive money printing without corresponding growth in goods and services leads to inflation. When governments run large fiscal deficits and monetize debt, it can fuel this process.
Example: Zimbabwe in the 2000s printed massive amounts of currency, leading to hyperinflation of over 79.6 billion percent.
b. Supply Chain Disruptions
Events like wars, pandemics, or natural disasters disrupt supply chains, causing shortages. When supply drops but demand remains the same or increases, prices rise steeply.
Example: COVID-19 caused global supply shocks, while stimulus packages increased demand—fueling inflation globally.
c. Commodity Price Shocks
Inflation can also result from surging prices of vital commodities like oil, food, or metals. Since these are inputs to many industries, cost increases ripple throughout the economy.
Example: The 1973 oil embargo quadrupled oil prices, leading to stagflation (high inflation + stagnation).
d. Wage-Price Spiral
As prices rise, workers demand higher wages. Businesses pass increased labor costs onto consumers, creating a self-reinforcing cycle that’s hard to break.
3. The Mechanics of the Nightmare
a. Currency Devaluation
When inflation surges, a nation’s currency loses value—both domestically and internationally. Imports become expensive, debt burdens grow, and investor confidence drops.
b. Collapse of Savings and Pensions
As purchasing power erodes, fixed income sources like pensions become inadequate. Retirement savings lose value unless indexed to inflation.
c. Middle-Class Erosion
The middle class bears the brunt of inflation. Their incomes don’t rise as fast as prices, while the wealthy shift assets into inflation-protected investments, widening inequality.
d. Business Disruptions
Price instability affects inventory, planning, contracts, and wages. Businesses may delay investments, leading to job losses and reduced output.
e. Social Unrest
Food and fuel inflation can trigger protests, strikes, and even revolutions. The Arab Spring began with rising bread prices.
4. Historical Inflation Nightmares
a. Germany – Weimar Republic (1921–1923)
War reparations and excessive printing led to hyperinflation.
Prices doubled every few days; people used wheelbarrows to carry money.
Middle class lost their wealth, leading to political radicalization.
b. Zimbabwe (2000–2009)
Land reforms destroyed agricultural productivity.
The government printed money to cover expenses.
Monthly inflation reached 89.7 sextillion percent.
A loaf of bread cost Z$10 billion.
c. Venezuela (2010–Present)
Oil dependence, corruption, and mismanagement.
Currency collapsed; citizens rely on barter or foreign currency.
Basic items like toilet paper and flour became luxuries.
5. The Psychological Toll
An inflation nightmare is not just economic—it alters behavior, perception, and trust.
a. Hoarding Behavior
Fear of future price hikes makes people stockpile essentials. This worsens shortages and further fuels inflation.
b. Loss of Trust in Currency
When money loses value daily, it ceases to serve as a store of value. People seek hard assets like gold, real estate, or foreign currency.
c. Dollarization
In some countries, people abandon local currency altogether. In Zimbabwe and Venezuela, U.S. dollars and cryptocurrencies replaced the national currency in everyday use.
6. Central Bank Dilemma
Fighting inflation is a central bank's primary task. But during an inflation nightmare, tools become limited and the stakes higher.
a. Raising Interest Rates
Higher rates reduce borrowing and spending, cooling demand. However, excessive rate hikes can cause a recession or debt crisis.
b. Quantitative Tightening
Reversing previous monetary expansion helps control money supply, but may reduce market liquidity and risk financial instability.
c. Policy Credibility
Central banks must act decisively and maintain public confidence. Any delay or miscommunication can worsen the situation.
Example: The U.S. Federal Reserve’s delayed response in the 1970s led to persistent inflation. Paul Volcker's sharp rate hikes in the 1980s finally broke the cycle—at the cost of a deep recession.
Modern Inflation Risks (2020s and Beyond)
a. Global De-Dollarization
If global confidence in the U.S. dollar weakens due to debt and deficits, it could create worldwide inflation pressure.
b. Deglobalization
Protectionism, reshoring, and geopolitical tensions raise production costs globally.
c. Climate Change and ESG
Carbon taxes, green transitions, and resource scarcity may contribute to structural inflation.
d. Digital Inflation
Digital goods seem deflationary, but tech monopolies and algorithmic pricing may create price opacity and hidden inflation.
Conclusion
The "Inflation Nightmare" is not just about rising prices—it's about loss of control, confidence, and continuity. It reflects systemic cracks in policy, governance, production, and social structure. Whether triggered by reckless monetary policy, geopolitical shocks, or mismanagement, once inflation spirals beyond a threshold, it unleashes chaos across all sectors.
Understanding the anatomy of an inflation nightmare is essential for policymakers, investors, businesses, and citizens. While inflation is a natural economic phenomenon, preventing it from becoming a catastrophe requires foresight, discipline, and global coordination.
The past has shown us how devastating uncontrolled inflation can be. Let us not sleepwalk into another nightmare.
Intraday & Swing TradingIntroduction
Trading in the financial markets can be approached in many ways, but two of the most popular and widely practiced styles are intraday trading and swing trading. Both offer opportunities to capitalize on short-term price movements, yet they differ significantly in their strategies, holding periods, risk profiles, and psychological demands.
Whether you’re a beginner trying to choose your trading path or an intermediate trader refining your style, understanding the intricacies of intraday and swing trading is crucial. In this detailed guide, we’ll explore both trading approaches in depth and help you determine which might suit you best.
1. What is Intraday Trading?
Definition
Intraday trading, also known as day trading, involves buying and selling financial instruments (like stocks, options, forex, or futures) within the same trading day. The goal is to profit from short-term price fluctuations by entering and exiting positions before the market closes.
Key Characteristics
Timeframe: Minutes to hours; positions are closed before the market ends.
No overnight risk: All trades are squared off within the day.
High frequency: Multiple trades per day are common.
Focus on liquidity & volatility: Traders prefer highly liquid stocks that show good intraday movement.
2. What is Swing Trading?
Definition
Swing trading is a medium-term trading strategy that involves holding positions for several days to weeks. The aim is to profit from “swings” in the market — i.e., short- to medium-term price trends.
Key Characteristics
Timeframe: Several days to a few weeks.
Overnight holding: Positions are often held over multiple sessions.
Trend-based: Trades follow short- to medium-term trends.
Fewer trades: Compared to intraday trading, swing trading involves less frequent trading.
3. Tools & Indicators Used
Common Technical Indicators
Indicator Intraday Trading Swing Trading
Moving Averages EMA (5, 20), VWAP SMA (20, 50, 200)
RSI RSI (14) for quick overbought/oversold RSI for identifying pullbacks
MACD Less used due to lag Commonly used to confirm trends
Bollinger Bands For breakout strategies For range-bound swing trades
Volume Profile Key for entry/exit points Confirms breakout/breakdown
Support & Resistance Intraday levels like VWAP, pivots Daily, weekly levels matter more
Chart Timeframes
Intraday: 1-min, 5-min, 15-min charts.
Swing: 1-hour, 4-hour, daily charts.
4. Strategy Differences
Intraday Trading Strategies
Scalping
Super-fast trades, often held for seconds or minutes.
Requires tight spreads and high liquidity.
Momentum Trading
Buy assets showing strong upward or downward movement.
Follows news, earnings releases, or market momentum.
Breakout Trading
Enter when price breaks key levels (resistance/support).
High volume confirmation needed.
VWAP Reversion
Trade around Volume Weighted Average Price.
Mean reversion strategy used by institutions too.
Swing Trading Strategies
Trend Following
Enter trades in the direction of the prevailing trend.
Use moving averages and channels to ride the trend.
Pullback Strategy
Enter after a retracement in a trend.
Look for confirmation via candlesticks or RSI divergence.
Breakout Swing
Identify consolidation zones and enter on breakout.
Targets are based on previous swing highs/lows.
Support & Resistance Bounce
Buy at key support, sell at resistance.
Requires clear zones and strong candles for confirmation.
5. Risk Management Techniques
Intraday Trading
Stop-loss: Tight, usually 0.5–1.5% of capital.
Risk-to-Reward Ratio: Typically 1:2 or better.
Capital allocation: No more than 2% risk per trade.
Position sizing: Based on volatility (ATR) and SL.
Swing Trading
Stop-loss: Wider, often based on key support/resistance.
Risk-to-Reward: Usually 1:2 to 1:3.
Capital allocation: Diversified across a few trades.
Overnight risks: Consider earnings, news, gap-ups/downs.
6. Psychological Challenges
Intraday Trading Psychology
Stressful: Requires intense focus and fast decision-making.
Emotionally draining: Rapid changes may induce anxiety.
FOMO & Overtrading: Common due to market noise.
Patience & discipline: Needed to avoid chasing trades.
Swing Trading Psychology
Patience is key: Waiting for setups and letting trades develop.
Discipline: Not reacting emotionally to minor price swings.
Confidence: Trusting your analysis over multiple days.
Fear of overnight gaps: Especially during earnings season.
7. Pros and Cons
Intraday Trading
Pros:
No overnight risk.
Quick profits possible.
Many opportunities daily.
Leverage can enhance returns.
Cons:
Requires constant screen time.
High transaction costs.
Emotionally demanding.
Requires fast decision-making.
Swing Trading
Pros:
Less screen time needed.
Potential for larger profits per trade.
Can combine with full-time job.
Better suited for trend traders.
Cons:
Exposure to overnight risk.
Slower profit realization.
Can be affected by news and gaps.
Requires patience and broader analysis.
8. Which One Should You Choose?
Choose Intraday Trading If:
You can dedicate 3–6 hours daily to watch the market.
You enjoy fast-paced decision-making.
You’re good at technical analysis and price action.
You have a stable internet connection and good trading tools.
Choose Swing Trading If:
You have a full-time job or limited screen time.
You’re more patient and prefer holding trades longer.
You want to combine technicals with fundamentals.
You prefer trend-following strategies.
9. Important Tools & Platforms
For Intraday Traders
Brokerages with fast execution (e.g., Zerodha, Angel One, Upstox).
Charting platforms (TradingView, Chartink).
Screeners for intraday volume, price spikes, etc.
News feeds (Moneycontrol, CNBC, Twitter for live catalysts).
For Swing Traders
Daily/weekly screeners for breakouts or oversold stocks.
Fundamental filters (ROE, PE, EPS growth).
Economic calendar to watch major events.
Backtesting tools to test swing strategies.
10. Real-Life Example Comparison
Let’s assume a stock, XYZ, is trading at ₹200.
Intraday Trade:
Breaks intraday resistance at ₹202.
Buy at ₹202, target ₹206, SL at ₹200.
Risk: ₹2, Reward: ₹4 (1:2 RR).
Trade duration: 1 hour.
Swing Trade:
Breaks out from a 2-week consolidation at ₹200.
Buy at ₹202, target ₹215, SL at ₹195.
Risk: ₹7, Reward: ₹13 (1:2 RR).
Holding period: 7–10 days.
11. Combining Both Approaches
Some experienced traders combine both strategies:
Use intraday profits to fund swing positions.
Trade options intraday, while holding cash equities swing.
Use swing trade analysis to set intraday bias.
Hybrid trading can diversify risk and improve overall performance.
12. Common Mistakes to Avoid
In Intraday Trading:
Overtrading due to boredom.
Ignoring risk-reward ratios.
Trading illiquid stocks.
Reacting emotionally to market noise.
In Swing Trading:
Holding losers too long.
Lack of trade journal or analysis.
Ignoring macroeconomic factors.
No exit plan on profit.
Conclusion
Intraday and swing trading are both viable paths for active market participants. Intraday trading suits those seeking quick profits with high engagement, while swing trading appeals to those who prefer a more relaxed and trend-based approach.
Neither is inherently better — the choice depends on your personality, lifestyle, risk appetite, and financial goals.

Momentum, Swing & Day Trading StrategiesTrading in financial markets offers a variety of strategies suited to different timeframes, risk appetites, and goals. Among the most popular trading methodologies are Momentum Trading, Swing Trading, and Day Trading. These strategies, while overlapping in some aspects, are distinct in their approach to capitalizing on market opportunities. Each appeals to a particular type of trader and requires different skills, tools, and psychological traits.
This guide provides a deep dive into these three trading styles, helping aspiring traders understand how they work, what tools are needed, and how to determine which might be the best fit for their goals.
1. Momentum Trading
Definition
Momentum trading is a strategy that seeks to capitalize on the strength of existing market trends. Momentum traders aim to buy securities that are moving up and sell them when they show signs of reversing—or go short on securities that are moving down.
The underlying belief is that stocks which are already trending strongly will continue to do so in the short term, as more traders jump on the bandwagon.
Core Principles
Trend Continuation: Assets that exhibit high momentum will likely continue in their direction for a while.
Volume Confirmation: High volume typically confirms the strength of momentum.
Short-term holding: Positions are held for a few minutes to several days.
Relative Strength: Comparing the performance of securities to identify leaders and laggards.
Example Strategy
Identify stocks with high relative volume (5x or more average volume).
Look for breakouts above recent resistance with strong volume.
Enter the trade once confirmation occurs (price closes above resistance).
Use a trailing stop-loss to ride the trend while locking in gains.
2. Swing Trading
Definition
Swing trading involves taking trades that last from a few days to a few weeks in order to capture short- to medium-term gains in a stock (or any financial instrument). Swing traders primarily use technical analysis due to the short-term nature of the trades but may also use fundamental analysis.
This strategy bridges the gap between day trading and long-term investing.
Core Principles
Trend Identification: Traders look for mini-trends within larger trends.
Support & Resistance: Entry and exit points are often based on technical levels.
Risk-to-Reward Ratios: Focus on setups with favorable risk/reward profiles (typically 1:2 or better).
Market Timing: Entry and exit are more strategic and less frequent than day trading.
Example Strategy
Scan for stocks in a clear uptrend or downtrend.
Wait for a pullback to a key moving average or support zone.
Enter on a bullish/bearish reversal candlestick pattern.
Set stop-loss just below support or recent swing low.
Set target profit at next resistance level or use a trailing stop.
3. Day Trading
Definition
Day trading is a strategy that involves buying and selling financial instruments within the same trading day. Traders aim to exploit intraday price movements and typically close all positions before the market closes to avoid overnight risks.
This strategy demands intense focus, fast decision-making, and a strong grasp of technical analysis.
Core Principles
Speed: Executing trades rapidly and precisely.
Volume & Liquidity: Only liquid assets are traded to ensure quick execution.
Leverage: Often used to increase potential profits (and losses).
Volatility: The more a stock moves, the better for day trading.
Example Setup
Identify a high-volume stock with a news catalyst.
Wait for an opening range breakout.
Enter long/short based on breakout with tight stop-loss.
Set profit targets based on support/resistance or risk-reward ratio.
Tools Commonly Used Across All Strategies
Regardless of the strategy, traders typically use the following tools:
Charting Platforms: TradingView, ThinkorSwim, MetaTrader, NinjaTrader.
Screeners: Finviz, Trade Ideas, MarketSmith.
News Feed Services: Benzinga Pro, Bloomberg, CNBC, Twitter/X.
Brokerage Platforms: Interactive Brokers, TD Ameritrade, E*TRADE, Fidelity.
Risk Management Software: Used to calculate position sizing, stop losses.
Risk Management: The Cornerstone of All Strategies
No matter the strategy, risk management is essential. Key practices include:
Position Sizing: Never risk more than 1–2% of capital per trade.
Stop-Loss Orders: Automatically exits a losing trade at a predefined level.
Risk-Reward Ratio: Most successful traders seek at least a 1:2 ratio.
Diversification: Avoid overexposing to one sector or asset.
Conclusion: Which Strategy is Right for You?
Choosing the right trading strategy depends on your:
Time availability: Can you watch the markets all day?
Capital: Can you meet margin and liquidity requirements?
Personality: Are you calm under pressure, or do you prefer slower decision-making?
Experience level: Some strategies are more forgiving and suitable for beginners.
Master Institutional Trading✅ Introduction: What Is Institutional Trading?
Institutional trading refers to the strategies and market activities carried out by big players—like hedge funds, mutual funds, insurance companies, foreign institutional investors (FIIs), banks, and proprietary trading firms.
Unlike retail traders (individuals), institutions manage large capital, influence markets, and use advanced data-driven strategies to enter and exit positions silently and smartly.
"Master Institutional Trading" is all about learning how these big players operate, how they make decisions, and how you—an individual trader—can read their moves and trade alongside the smart money instead of against it.
🧠 Why Learn Institutional Trading?
Most retail traders lose money because they trade emotionally or follow the crowd. Institutional traders, on the other hand:
Follow data, not emotions
Trade with discipline and risk management
Use volume, price action, and order flow
Focus on capital protection as much as profits
Mastering Institutional Trading helps you:
Understand how smart money moves
Identify hidden demand and supply zones
Trade with precision using volume and price action
Avoid retail traps and manipulation zones
Develop a rule-based, professional approach
📘 What You Learn in Master Institutional Trading
Here’s what a full-fledged Master Institutional Trading program or strategy guide includes:
1️⃣ Market Structure: Understanding the Battlefield
Difference between retail and institutional behavior
Market cycles: Accumulation → Manipulation → Distribution
Price action and how institutions create fake breakouts
Liquidity hunting: How institutions trap retail traders
2️⃣ Smart Money Concepts
Smart money refers to capital controlled by professional institutions. You’ll learn:
How to track smart money footprints
Concepts like Order Blocks, Liquidity Zones, Fair Value Gaps (FVG)
Role of volume spikes and open interest in showing big trades
How smart money builds positions slowly to avoid moving the market
3️⃣ Volume Profile and Order Flow
Institutional traders focus on volume and flow, not indicators.
How to use Volume Profile (POC, Value Area High/Low)
Footprint charts and Delta analysis
How to read Buy vs Sell pressure
Spotting imbalances where smart money takes control
4️⃣ Institutional Candlestick Behavior
Candles tell a story—especially when institutional players are involved.
You’ll learn:
Master Candle setups
Break of Structure (BOS) and Change of Character (CHOCH)
Identifying manipulation wicks and liquidity grabs
Candlestick rejections at key institutional levels
5️⃣ Option Chain Analysis (Institutional Option Trading)
Institutions use options to hedge and speculate quietly.
Interpreting Open Interest (OI) data
Spotting institutional positions at strikes
Using PCR (Put Call Ratio) and Max Pain
Advanced option strategies like short straddles/strangles, iron condors
6️⃣ Institutional Risk Management
Institutions are masters of risk.
You will learn:
Capital allocation strategy
Stop-loss planning based on liquidity zones, not random points
Scaling into trades, position sizing
Trade management and profit-booking plans
7️⃣ Market Psychology & Trap Detection
Institutional traders create fake moves to trap retail traders.
How to avoid bull traps and bear traps
Understand news-based manipulation
The concept of dumb money vs smart money
Mindset training for following your edge
8️⃣ Building Your Institutional Strategy
The final goal is to trade like an institution, even with a small account.
You will build:
A structured plan based on smart money concepts
Entry/Exit criteria using price action + volume
Trade journaling system
Performance review framework
💼 Who Is This For?
"Master Institutional Trading" is ideal for:
Intermediate and advanced traders
Option traders looking to time entries better
Intraday, swing, and positional traders
Traders tired of using random indicators
Anyone serious about building a long-term profitable system
🧭 Real-World Application Examples
Bank Nifty Levels: Institutions often build positions using weekly options and defend key OI levels.
Nifty50 Zones: Watch for institutional buying during heavy dips or selling into rallies.
Futures Volume: A sudden spike in Bank Nifty Futures + Open Interest jump = Institutional entry.
Option Writers: At resistance zones, call writing increases sharply = probable reversal zone.
🎓 Conclusion
Mastering Institutional Trading is not about getting secret indicators or magic tips. It’s about understanding the market at its core—through price, volume, structure, and behavior of smart money.
Once you learn this, you stop following the herd. You become a confident, calm, data-driven trader who knows how to read the market like a pro.
🔹 Whether you're trading Nifty, Bank Nifty, stocks, or forex – the principles of institutional trading remain the same

Banknifty 1D Timeframe📈 Bank Nifty – Market Overview
Opening Price: Opened strong near 57,250–57,300.
Intraday High: Touched around 57,286 in early trading hours.
Intraday Low: Dropped towards 56,730 during mid to late session.
Current Trading Range: Between 56,730 and 57,280, with a mild negative bias.
Previous Close: Around 56,953.
Current Loss: Trading -0.3% to -0.5% lower compared to previous close.
🔍 Key Drivers Today
Private Banks Hold Strength: Stocks like HDFC Bank and ICICI Bank showed resilience, limiting the downside.
PSU Banks Under Pressure: Public sector banks including SBI, PNB, and Canara Bank underperformed, causing the index to drift lower.
Profit Booking Seen: After an early positive move, intraday profit booking pulled the index back.
Low Volatility: Reduced intraday swings, though a narrow downtrend was visible after the first hour.
📊 Technical Picture
Support Zone: Strong support is visible around 56,730–56,700. A breach could see a quick move toward 56,500–56,000.
Resistance Zone: Resistance remains at 57,250–57,300. If this level is crossed, the next upside target is around 57,500–57,700.
Trend Bias: Neutral to bearish for the day due to selling pressure after opening strength.
✅ Summary Conclusion
Bank Nifty is showing slight weakness today, mainly dragged by public sector banks. The index gave up early gains, but private banks kept the fall in check. Current range is 56,730–57,280. Watch for either a bounce above 57,300 or a break below 56,700 for the next clear trend direction.

HDFCBANK 1D Timeframe📈 HDFC Bank – Intraday Overview
Opening Price: Opened strong around ₹2,005–₹2,010.
Intraday High: Touched approximately ₹2,018 during early trading.
Intraday Low: Maintained support around ₹2,000.
Current Price: Trading near ₹2,016, showing a gain of around +0.8% to +0.9%.
Previous Close: ₹2,005.
🔍 What’s Driving HDFC Bank Today
Positive Earnings Effect: Strong Q1 earnings with around 12% year-on-year profit growth, bonus share announcements, and dividends have boosted buying interest.
Sector Leadership: Among the strongest performers in the banking sector, helping to support indices like Nifty50 and Bank Nifty.
Consistent Volume: Healthy trading volumes indicate sustained institutional participation.
Strong Sentiment: Momentum remains high with overall positive cues from private banking space.
📊 Technical Summary
Support Level: Strong support exists around ₹2,000–₹2,005.
Resistance Level: Intraday resistance at ₹2,018 with major resistance near ₹2,027 (recent all-time high).
Trend Direction: Bullish trend, as it is making higher lows and maintaining strength above the psychological ₹2,000 mark
✅ Summary Conclusion
HDFC Bank is trading positively today with sustained momentum after strong earnings and corporate actions. Intraday action shows bullish strength above ₹2,000, with the possibility of new highs if it crosses ₹2,018–₹2,027 levels. Technical trend remains positive to bullish for the day.

Advance Option Trading📊 Advance Option Trading – Complete Professional Guide
Advance Option Trading focuses on mastering professional-grade strategies that go beyond simply buying Call and Put options. This approach uses multi-leg strategies, Option Greeks, and volatility analysis to help traders profit in bullish, bearish, sideways, or even volatile and low-volatility markets with better control over risk and reward.
This is how professional traders and institutions trade options — systematically, with probability, and smart risk management.
💡 What is Advanced Options Trading?
In Advanced Options Trading, you learn:
✅ Complex Strategies like Spreads, Straddles, Strangles, Iron Condor
✅ How to combine multiple options in one trade
✅ Reading and using Option Greeks to manage your trades
✅ Analyzing Implied Volatility (IV) to predict market reactions
✅ Managing risk and reward scientifically
🎁 What You Master in Advanced Option Trading
1. Option Greeks
Delta — How much option price moves with the underlying.
Theta — Time decay; how much premium you lose every day.
Gamma — Rate of change of Delta; helps in intraday adjustments.
Vega — Sensitivity to volatility changes.
Rho — Impact of interest rates (minor but useful).
➡️ Professionals use Greeks to adjust their positions and decide when to enter, exit, or hedge trades.
2. Volatility Trading
High IV Strategies → Sell Options (Iron Condor, Credit Spread).
Low IV Strategies → Buy Options (Straddle, Strangle).
IV Crush → Profit from fast drop in implied volatility after events (like earnings/news).
3. Advance Risk Management Techniques
Adjusting trades dynamically as price moves.
Hedging positions when necessary.
Avoiding big losses using proper position sizing.
Managing trades based on Greeks exposure
✅ Benefits of Advanced Options Trading
✅ Predictable Profitability — higher consistency
✅ Works in all market conditions
✅ Controlled Risk, Limited Loss
✅ Higher Win Rate Strategies
✅ Option Greeks help you stay professional
✅ Volatility analysis increases trade accuracy
📝 Who Should Learn Advanced Options Trading?
✅ Traders who know basics and want more control
✅ Those interested in hedging and capital protection
✅ Swing or positional traders wanting steady income
✅ Intraday traders aiming for high probability setups

Institution Option Trading📈 Institutional Option Trading – Complete Detailed Guide
Institutional Option Trading refers to how big financial institutions, such as banks, hedge funds, and proprietary trading firms, use options strategically in the market to manage risk, maximize profits, and control large positions with precision. This approach is highly systematic, data-driven, and based on volume, volatility, and liquidity analysis — very different from how retail traders trade options.
💡 What is Institutional Option Trading?
Institutions don’t gamble with options — they use options for:
✅ Hedging — Protecting big portfolios from market drops.
✅ Income Generation — Earning regular profits through premium selling.
✅ Directional Bets — Placing large directional trades with minimal risk.
✅ Volatility Trading — Making profits from changes in volatility without caring about market direction.
📚 Key Features of Institutional Option Trading
1. Focus on Liquidity
Institutions trade highly liquid options, usually:
Index Options (NIFTY, BANKNIFTY, SPX)
Blue-Chip Stocks (Apple, Reliance, TCS, Infosys)
Commodity Options (Gold, Crude Oil)
They avoid low-volume contracts and always trade in markets where they can enter and exit positions without slippage.
2. Use of Option Greeks
Institutions are masters of Option Greeks:
Delta for direction,
Theta for time decay profits,
Vega for volatility play,
Gamma for adjusting positions dynamically.
They don’t trade blindly but monitor how their positions react to price, time, and volatility changes.
3. Premium Selling Bias
Most institutional setups involve selling options (not just buying).
✅ Credit Spreads, Iron Condors, and Covered Calls are preferred.
Why? Because time decay works in their favor, giving consistent income.
4. Hedging Big Positions
Institutions always hedge their trades.
✅ Example: They may hold large stock positions and sell Covered Calls or buy Protective Puts to reduce risk.
✅ This creates balanced portfolios, minimizing market shocks.
✅ Institutional Trading Tools
Open Interest Analysis
Option Chain Data
IV (Implied Volatility) charts
Volume Profile & Market Profile
Real-time Greeks exposure tools
Delta-neutral hedging platforms
📝 Example of Institutional Option Trade
Scenario: NIFTY at 22,000, sideways expectation for next week.
✅ Strategy: Sell 22,500 Call, Sell 21,500 Put (Iron Condor).
✅ Buy hedges: 23,000 Call, 21,000 Put.
✅ Profit Range: If NIFTY stays between 21,500-22,500 → Max Profit.
✅ Risk Managed: Losses capped, steady time decay profit.
🚀 Benefits of Learning Institutional Option Trading
✅ Consistent income instead of gambling
✅ Risk protection using proper hedging
✅ Trade size management for scalability
✅ Ability to handle big accounts with steady growth
✅ Professional market understanding

Option Trading📈 Option Trading – Complete Beginner to Advanced Guide
Option Trading is a powerful method used in stock, forex, commodity, and index markets where you trade contracts (options) instead of buying the actual stock or asset. With options, you get the right, but not the obligation, to buy or sell an asset at a specific price within a specific time. This allows traders to profit in bullish, bearish, and sideways markets — with controlled risk and higher flexibility.
💡 What is Option Trading?
In simple words:
You buy or sell a contract, not the stock itself.
You can control big positions with less money (leverage).
You can make money even if the market goes up, down, or stays sideways.
🎁 Advantages of Option Trading
✅ Small capital, high profits with leverage
✅ Limited risk, especially in buying options
✅ Opportunity to earn in any market direction
✅ Flexible strategies for income, hedging, or speculation
✅ Ideal for short-term trades (1 day to a few weeks)
Simple Example:
You think NIFTY will rise from 20,000 to 20,500 in a week.
You buy a NIFTY Call Option (Strike Price: 20,000).
Pay premium ₹50.
If NIFTY moves to 20,500, your option value increases (maybe ₹200).
Profit = ₹150 per unit (₹200 - ₹50).
With small investment, you earn bigger returns.
✅ Basic Rules for Successful Option Trading
Trade with trend direction (use technical analysis).
Always check Open Interest & Volume.
Avoid holding close to expiry to avoid time decay (theta loss).
Start with single-leg options, move to spreads later.
Risk only 1-2% of your capital per trade.
🎯 Benefits of Mastering Option Trading
✅ Higher returns with lower capital
✅ Master multiple market conditions
✅ Ideal for intraday, swing, and positional trades
✅ Opportunity to hedge existing investments
✅ Fast skill growth in financial markets

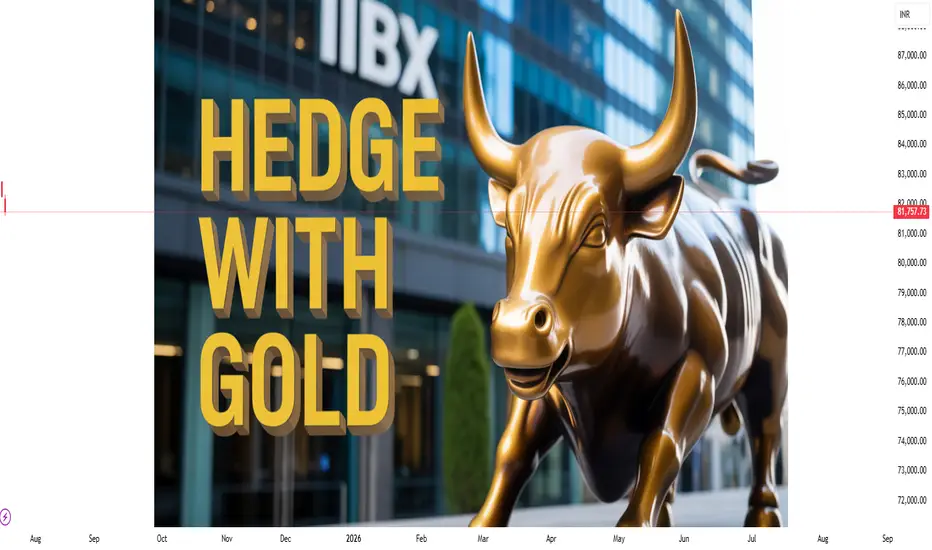
New Hedging Opportunity: Gold Futures at IIBX1. What Is IIBX—and Why Are Gold Futures a Game Changer?
India International Bullion Exchange (IIBX), based in GIFT City, Gujarat, launched gold futures trading in July 2025.
This marks the first-ever opportunity for Indian entities to hedge gold price risk onshore but in US dollars with global pricing—bridging domestic participants and international benchmarks.
Unlike traditional futures on MCX, which are rupee-denominated and influenced heavily by Indian domestic factors, IIBX futures track international market dynamics, aligning with real-time global valuations.
Why is this significant?
India is the world’s second-largest consumer of gold—by introducing a dollar-denominated, globally priced futures contract, IIBX allows traders and jewellers to hedge currency and commodity risk simultaneously.
This initiative reduces dependence on foreign exchanges like COMEX or Singapore and supports RBI/IFSCA's goal to develop a robust, transparent bullion trading ecosystem domestically.
2. Who Can Use These Futures—and How Do They Hedge?
Eligible Participants:
Qualified jewellers
Bullion dealers
Refineries
TRQ (Tariff Rate Quota) holders (currently 441+, with more in the pipeline)
Any business entity with gold-related risk exposure
Hedging Scenarios:
Jewellers: Protect import cost from rising gold prices. If they expect gold to cost $2,000/oz in three months, they can lock in prices via futures.
Refiners and Dealers: Manage margin volatility and ensure stable profit spreads regardless of gold price shifts.
TRQ operators: Offset exposure to tariff-based import risks.
Hedging Mechanics:
Buy futures if expecting price increases, offsetting rising import cost.
Sell futures (short positions) to hedge inventory or production, locking in current prices.
Since trades occur in US dollars and settle physically or in cash, participants hedge both commodity and currency risk.
3. Contract Features: What IIBX Has Built-In
📃 Specifications:
Contract unit: 1 kg gold (approx 32.15 oz)
Denomination: U.S. dollars per Troy ounce
Tick size: $0.01 per oz
Minimum trading size: 1 kg; maximum 10 kg per order
Contracts listed: Three consecutive months plus all even-months in a 13-month window (total 8 concurrent maturities)
Trading hours: 09:00–23:30 IST—keeping sync with global gold trading sessions
Risk & Margin Management:
Initial margin: At least 6% of contract value or calculated via Value‑at‑Risk (VaR)
Extreme Loss Margin (ELM): 1% buffer
Daily Mark-to-Market (MTM) settlement
Collateral controls: Members cannot fully exhaust collateral—risk-reduction thresholds are triggered at 85–90%
Concentration & spread margins: Encourage diversification by offering margin benefits for calendar spreads
Settlement:
Daily MTM in USD
Final settlement: Cash or physical delivery, based on pre-declared intent
These features ensure transparency, member protection, and global alignment—while maintaining strong oversight by IIBX and IFSCA.
4. What Makes This Hedging Opportunity Unique Now
💱 Hedge Gold and Currency Simultaneously
Standard MCX contracts hedge gold price risk but not USD/INR fluctuations.
With IIBX’s Dollar-based futures, businesses effectively lock both gold and currency exposures in one contract—critical for imports and exports.
🌍 Real-Time Global Price Alignment
IIBX uses Bloomberg’s XAU–USD spot pricing, so domestic hedges match international market moves.
This synchronisation is ideal for global trading, arbitrage, and better risk pricing.
🏛 Onshore Containerization of Hedging
Previously, Indian entities hedged overseas or bypassed through subsidiaries abroad.
Now, they can do it in GIFT City via Indian AD banks—streamlining compliance, saving on setup costs, and avoiding legal complexities.
🚀 Liquidity Boost via LES
IIBX launched a Liquidity Enhancement Scheme to incentivize market makers through rebates and reduced fees.
This seeds the market with tight spreads, better execution, and deeper order books over time.
5. Practical Use Cases for Gold Futures Hedging
✅ A. Jeweller Importer's Playbook
Estimate gold import date/volume
Sell equivalent IIBX futures at current prices
On expiry or near import — either physically take delivery or unwind position
Lock in gold cost, simplifying pricing and margin management
✅ B. Bullion Dealer/Retailer
Holds inventory — buys futures to guard against price drop
Over time, MTM fluctuations offset spot inventory gains/losses
Enables accurate working capital forecasting
✅ C. Refinery Example
Producing gold bars from scraps or raw gold
Sells refined gold in INR, but raw gold bought internationally in INR/USD
Hedging reduces mismatch, stabilizes profit margins
✅ D. Speculative/Arbitrage Traders
Play price differentials between MCX and IIBX
Exploit basis arbitrage or global/regional price plays
(Though speculative traders must be cautious of margin and regulatory requirements
7. Broader Impacts & Market Implications
🌐 Strengthening GIFT City Ecosystem
Diversifies offerings beyond forex and securities to bullion
Supports India’s vision of GIFT City as a global commodity hub
💰 Incentivizing Domestic Financial Institutions
AD banks can provide clients with hedging capabilities
Banks earn commissions and fees while helping reduce gold dependence on cash markets
🔄 Reducing Reliance on Overseas Exchanges
By offering global pricing and technology in India, overseas trading reductions save costs and complexity
🧰 Integration with Spot & Physical Markets
IIBX also operates spot segments for gold and silver
Interlinked spot-futures structure enables improved cash management and delivery coordination
8. Outlook: What Traders and Businesses Should Do Now
Assessment: Evaluate gold/currency exposures in your business (imports, inventory, exports)
Registration: Engage with AD banks for required approval and collateral setup
Education: Use IIBX’s website tutorials and circulars to understand margining and settlement norms
Start Small: Begin with a 1–2 contract hedge; monitor margin and execution
Expand Strategy: From spot hedges to calendar spreads and global arbitrage
For traders, domestic traders and arbitragers, a new tool has entered their toolbox—one that can level the playing field vs global participants.
9. Final Thoughts
The launch of Gold Futures on IIBX is a major evolution in India’s financial markets. It brings a sophisticated hedge mechanism—previously only available via overseas platforms—into the regulatory fold of GIFT City, in US dollars, tied to international prices. For jewellers, dealers, refiners, importers, and treasury teams, this is a powerful new instrument.
If adopted well, over time, it may reduce India’s dependence on international exchanges, bring more trading depth, and reduce gold price volatility for domestic stakeholders—all while supporting GIFT City’s vision as a world-class financial hub.
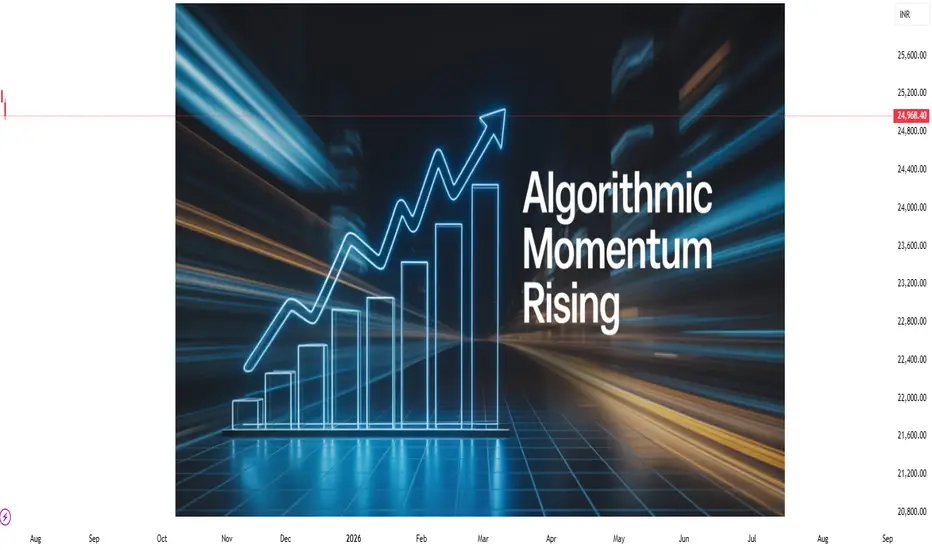
Rise of Algorithmic & Momentum-Based Strategy Innovation🧠 Introduction
The world of trading has changed drastically in recent years. Gone are the days when investors made decisions based on gut feeling, tips from friends, or simply following news headlines. Today, technology and data dominate the markets. A big part of this transformation is due to two fast-evolving areas of strategy:
Algorithmic Trading (Algo Trading)
Momentum-Based Trading Strategies
Together, these innovations are not just making trading faster—they're making it smarter, more scalable, and, in some cases, more profitable. Let’s explore this rise of strategy-driven trading in simple, relatable terms.
⚙️ What Is Algorithmic Trading?
Algorithmic trading (or "algo trading") refers to using pre-programmed computer code to buy and sell stocks or other financial assets. These programs follow specific sets of rules and conditions like:
Price movements
Volume changes
Timing of the trade
Technical indicators
News sentiment (in advanced models)
Instead of a human watching charts all day, the algorithm scans multiple assets simultaneously and executes trades at lightning speed when conditions are met.
🔍 Why Is It Popular?
Speed: Algos react in milliseconds.
Accuracy: Reduces human errors.
Discipline: Emotions like fear or greed don’t interfere.
Scalability: Can track hundreds of instruments at once.
⚡ What Is Momentum-Based Trading?
Momentum trading is based on a simple principle:
"What is going up will likely keep going up (at least for a while), and what is going down will keep going down."
Momentum traders try to ride these price trends. They don’t care much about why something is moving—they care that it is moving.
A momentum-based strategy focuses on:
Relative Strength Index (RSI)
Moving Averages
Breakouts above previous highs
Volume surges
In today’s digital world, most momentum strategies are now executed through algorithms, bringing us to the heart of this innovation wave.
💡 Why Is Strategy Innovation Booming in 2025?
1. Availability of Real-Time Data
In the past, getting real-time stock prices or volume data was expensive or difficult. Today, thanks to modern brokers and APIs, anyone can access tick-by-tick data in real time. This has democratized trading innovation.
2. Cloud Computing & Machine Learning
Cloud platforms like AWS, GCP, and Azure now allow even small traders to run complex models. Add machine learning to the mix, and you can build:
Predictive price models
Auto-optimizing strategies
Real-time anomaly detectors
This tech stack is fueling rapid innovation in custom algos and momentum-based systems.
3. Rise of API Brokers
Brokers like Zerodha (via Kite Connect), Upstox, and Dhan offer APIs that allow traders to:
Place trades programmatically
Access order books
Monitor positions via code
This has opened the doors for retail coders and quant enthusiasts to create strategies from their bedrooms—something only institutions could do a decade ago.
4. Market Volatility & Liquidity
Modern markets, especially post-COVID and now with geopolitical unrest, are fast-moving and noisy. Traditional long-term investing sometimes feels too slow. This has created fertile ground for short-term strategies like intraday momentum and algo scalping.
🧬 Types of Momentum-Based Algo Strategies Gaining Popularity
1. Breakout Algos
Entry: When price breaks above a resistance level or 52-week high.
Exit: After achieving target return or on breakdown.
2. Mean Reversion Momentum
Belief: Stocks that over-extend eventually revert back to mean.
Algo buys on dips and sells on peaks, based on Bollinger Bands or Moving Average deviations.
3. Relative Momentum Rotation
Focus: Switch between sectors/stocks showing strongest momentum.
Example: If Auto sector shows higher returns than Pharma over 4 weeks, the algo reallocates capital into Auto.
4. High-Frequency Momentum
Based on volume spikes, price speed, and Level-2 data.
Needs co-location or ultra-low latency to profit from small tick movements.
📊 Real-World Examples (2025 Trends)
Nifty and Bank Nifty Momentum Bots
Retail algo traders now use trend-following strategies on Nifty weekly options, taking intraday calls when the index crosses VWAP + 2%.
SME IPO Listing Day Momentum Plays
Some traders have built algos that scan listing price action and jump in when a stock breaks opening highs with volume.
AI-Augmented Algos
AI-powered bots use NLP (Natural Language Processing) to analyze earnings calls, company announcements, and even tweets. If sentiment is strongly positive, they take long positions.
🧠 Benefits of These Innovations
✅ For Retail Traders:
Better access to tools once exclusive to hedge funds.
Ability to automate their edge.
Save time watching screens all day.
✅ For Institutions:
Lower execution costs.
Scalable strategies across global markets.
Statistical models reduce dependence on human traders.
🧱 Challenges and Limitations
❌ Overfitting in Backtests
Just because a strategy worked in the past doesn't guarantee future success. Many algos “look perfect” in backtests but fail in live trading.
❌ API Latency and Downtime
Retail infrastructure is not as reliable as institutional setups. Brokers may experience order delays or API failures.
❌ Regulation Risk
SEBI and global regulators are watching algo trading closely. Flash crashes or manipulative algos can bring scrutiny and even bans.
❌ Emotional Disengagement
Too much automation can make traders disconnected from market context. Sometimes, manual intervention is needed.
🧭 What’s the Future of These Strategies?
🔮 1. AI + Algo = Self-Learning Bots
The next wave of bots may not follow fixed rules. They may adapt automatically by learning from market behavior—almost like an evolving trader.
🔮 2. Regulation Around Algo Trading
Expect more regulation in 2025–2026 to ensure fairness and stability. SEBI may require audits or sandbox testing before public deployment.
🔮 3. Community-Based Innovation
Open-source algo trading platforms (like Blueshift, QuantConnect, etc.) are becoming collaborative hubs where traders share and upgrade each other's strategies.
🔄 How Can a Retail Trader Start?
✅ Step 1: Learn Python or Use No-Code Platforms
Python is the language of algo trading. If you can’t code, use platforms like AlgoTest, Tradetron, or Streak.
✅ Step 2: Start Small
Begin with paper trading or small capital. Don’t go all-in until you have confidence and historical data.
✅ Step 3: Choose a Clean Strategy
Start with something simple—like RSI + Moving Average crossover, and backtest on Nifty.
✅ Step 4: Track Metrics
Measure win ratio, drawdown, average profit per trade. Good algo traders analyze more than they trade.
✍️ Final Words
The rise of algorithmic and momentum-based strategy innovation is reshaping India’s trading landscape. It’s making the game smarter, faster, and more competitive. But like every tool, it depends on how you use it. These strategies aren’t magic bullets—they're systems that require patience, research, and constant optimization.
For traders willing to invest in knowledge and tools, the opportunities are exciting. For those hoping to “copy-paste” quick riches, the market may prove costly.
In 2025 and beyond, the best traders may not be those with the sharpest eyes—but those with the smartest code.
SEBI’s Derivatives Market Reforms & Jane Street Fallout1. The Bigger Picture: Why SEBI Intervened
India is currently the world’s largest equity derivatives market in terms of contracts traded. On expiry days, the trading volume in index derivatives—especially options—is often more than 300 times higher than that of the cash market. This unprecedented scale might sound like a success story at first glance, but SEBI, the Securities and Exchange Board of India, saw warning signs flashing bright red.
Over the past few years, retail traders have swarmed into the derivatives space, especially index options like Bank Nifty and Nifty 50. Most of them are drawn in by the promise of quick profits and leveraged exposure. However, a SEBI study revealed that 91% of retail traders in derivatives ended up losing money. That’s an alarming statistic. It signaled that the market was becoming speculative rather than investment-oriented.
Additionally, the structure of the market had become heavily tilted towards short-tenure options—weekly, and even daily expiries—turning it into a speculative playground. This over-dependence on weekly contracts resulted in wild swings, sharp intraday moves, and extreme volatility, especially on Thursdays (the weekly expiry day). This environment wasn't healthy—neither for long-term investors nor for the broader financial ecosystem.
SEBI saw this as a structural issue and decided to take bold steps to reform the derivatives market and make it safer, more rational, and more sustainable.
2. SEBI’s Core Reforms: Changing the Game
a) Extending Contract Tenure
One of the biggest problems SEBI identified was the overuse of ultra-short-term contracts. Weekly options had become the norm, with traders focusing on short bursts of market movement rather than making informed investment or hedging decisions.
To counter this, SEBI is planning to extend the tenure of derivative contracts. This means:
Less frequent expiries.
Longer-dated instruments becoming more liquid.
Reduced scope for expiry-based volatility and manipulation.
By pushing the market toward longer expiry contracts (like monthly and quarterly), SEBI wants to encourage thoughtful strategies, proper hedging, and discourage fast-money, short-term gambling.
b) Discouraging Retail Over-Speculation
Retail participation in the F&O market has skyrocketed, but most retail traders don’t fully understand the risks involved. SEBI has already taken several steps to discourage reckless speculation, such as:
Reducing the number of expiries per month.
Increasing the lot size of index futures and options, making it harder for small-ticket traders to over-leverage.
Introducing detailed risk disclosures on broker apps to educate traders about potential losses.
These steps are aimed at protecting small investors and bringing more stability to the market.
c) Focusing on the Cash Market
India’s cash equity market is relatively underdeveloped when compared to its derivatives segment. SEBI aims to rebalance this. By encouraging growth in the cash market, SEBI hopes to reduce the over-reliance on F&O and create a healthier, more resilient market structure.
3. The Jane Street Controversy: What Happened?
In July 2025, SEBI dropped a regulatory bombshell by banning Jane Street, a major US-based high-frequency trading (HFT) firm, from Indian markets. This wasn’t just a slap on the wrist—it was a full-blown interim order with massive consequences.
The Allegations:
SEBI alleged that Jane Street engaged in manipulative expiry-day strategies over a multi-year period. Here’s what SEBI believes happened:
In the morning of expiry days, Jane Street allegedly bought large volumes of index-heavy stocks. This artificially pushed the index higher.
At the same time, they opened short positions in index options, betting that the index would fall later.
In the afternoon, they unwound their stock positions, which pulled the index down.
As the index dropped, their short options positions profited heavily.
This strategy allowed them to make massive profits on expiry days, using their firepower to allegedly manipulate both the cash and derivative markets.
SEBI’s Action:
Barred Jane Street from trading in Indian markets.
Ordered them to deposit over ₹4,800 crore (~$570 million) in suspected unlawful gains.
Accused the firm of using its dominant market position to rig expiry-day movements.
Jane Street, of course, denied the allegations, claiming that their trades were legal arbitrage and part of liquidity provisioning. They are challenging the order in court, but the damage—both reputational and market-wide—has already been done.
4. The Immediate Fallout: Markets Take a Hit
The ban on Jane Street had a chilling effect on the market. Here's what followed:
a) Volume Drops
Jane Street was a major market maker in India’s derivatives space, especially on expiry days. After the ban:
F&O volumes dropped by over 30%.
Index options saw significantly reduced liquidity.
The premium turnover on the NSE fell by nearly 36%.
This wasn’t just a temporary blip. It revealed how dependent the Indian market had become on a few HFT firms to provide liquidity and manage spreads.
b) Volatility Dips
Interestingly, India’s volatility index (VIX) dropped to multi-month lows post the ban. With fewer players like Jane Street aggressively trading expiry moves, the markets became calmer. While this might seem good, too little volatility can reduce trading opportunities and narrow market participation.
c) Wider Spreads and Execution Slippage
With fewer market makers and less volume, traders—especially institutions—began facing wider bid-ask spreads. That means it became more expensive to execute trades, especially in large quantities. This can hurt mutual funds, FIIs, and even large domestic traders.
5. Broader Implications for the Indian Market
a) SEBI’s Strength as a Regulator
This episode showcases that SEBI is serious about enforcing discipline, even if it means challenging a global giant like Jane Street. That sends a strong signal to both domestic and international players: India’s markets are not a free-for-all.
b) Liquidity Vacuum
With Jane Street gone, there's a temporary liquidity vacuum. Other firms are cautious, unsure if they might be targeted next. SEBI needs to strike a balance—encouraging good players while weeding out bad behavior.
c) Investor Confidence and Market Maturity
While retail traders might find the new reforms and lower volatility frustrating, long-term investors and institutions are likely to benefit from a more predictable and transparent market.
6. Legal Battle and Global Ramifications
Jane Street has taken the legal route, depositing the required funds while appealing the SEBI ban. Depending on how the case proceeds:
It could set new legal precedents in Indian market jurisprudence.
It may influence how SEBI handles future cases involving algorithmic or HFT trading.
Other global firms might review or revise their India strategies, balancing opportunity with regulatory risk.
If SEBI wins the case, it strengthens its position as a tough, credible regulator. If Jane Street wins, it may force SEBI to revisit how it defines and regulates market manipulation, especially in the algo/HFT space.
7. What This Means for You (the Trader/Investor)
For Retail Traders:
Expect fewer sharp expiry-day moves. Strategies based on quick, expiry-day scalping may need to be adapted.
Market may feel slower, but potentially safer.
You’ll need to focus more on strategy, research, and planning, instead of gambling on weekly moves.
For Institutions:
Market access costs may rise due to wider spreads.
Less volatility may reduce arbitrage and quant trading opportunities.
Need for more diversified trading models, including participation in the cash and bond markets.
For Market Observers and Policy Thinkers:
This is a rare opportunity to watch a major regulatory shift unfold.
India’s market is transitioning from being a trader’s playground to an investor’s ecosystem.
8. What Comes Next?
SEBI will likely roll out more reforms—stricter monitoring, revised rules for expiry days, and enhanced surveillance.
New market makers may enter the space, possibly Indian firms or global ones with stronger compliance protocols.
Jane Street’s legal outcome will influence how aggressively foreign algo firms operate in India going forward.
✍️ Final Word
The SEBI vs Jane Street saga is more than a single enforcement action—it’s a symbol of India’s market maturity. By reforming derivatives and holding big players accountable, SEBI is trying to create a safer, more balanced market for everyone—from retail investors to institutional giants.
The road ahead may involve some pain—lower volumes, fewer trading thrills—but the foundation being laid could ensure a more sustainable, fair, and globally respected financial market

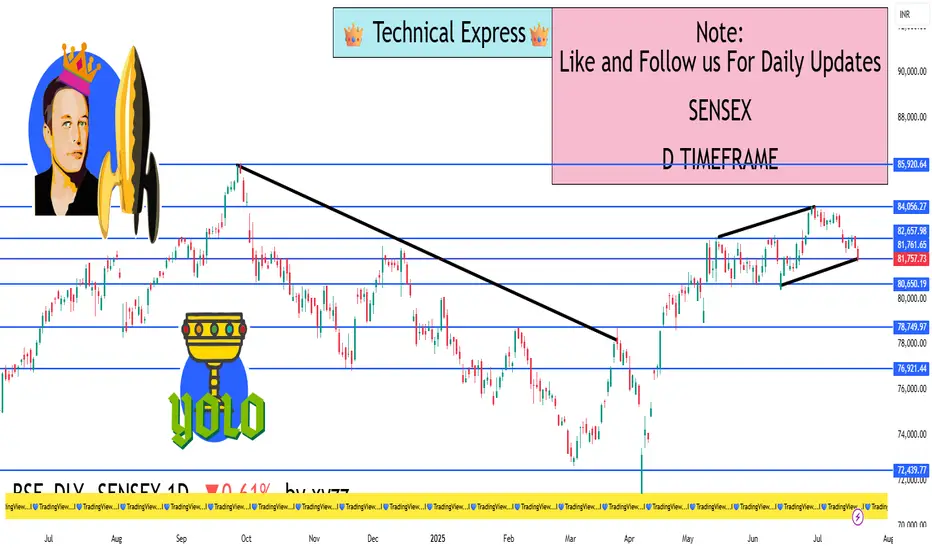
Sensex 1D Timeframe✅ Current Market Status:
Closing Price: ₹82,452.00
Change: –148.32 points
Percentage Change: –0.18%
Day’s Range: ₹82,300.70 – ₹82,892.30
52-Week Range: ₹65,302.20 – ₹83,822.00
🔍 Key Technical Levels:
📌 Support Zones:
Support 1: ₹82,200 – minor trendline support
Support 2: ₹81,800 – recent bounce zone
Support 3: ₹81,000 – strong institutional buying level
📌 Resistance Zones:
Resistance 1: ₹82,900 – intraday high rejected
Resistance 2: ₹83,400 – multi-session top
Resistance 3: ₹83,800 – all-time high zone
🕯️ Candlestick Pattern:
Candle Type: Bearish body with upper wick
Formation: Reversal candle after a small bounce
Implication: Supply seen near highs; indicates hesitation in buying
📈 Indicator Status (1D Timeframe):
Indicator Value & Signal
RSI (14) ~45 – Neutral but slipping downward
MACD Bearish crossover – sellers gaining control
20 EMA ~₹82,780 – Price below this level (short-term bearish)
50 EMA ~₹82,000 – May act as dynamic support soon
📊 Price Structure Summary:
Sensex is in a tight range between ₹81,800 and ₹83,400.
The price rejected from ₹82,900, showing sellers are active.
If ₹82,200 breaks, we might see movement toward ₹81,800 and ₹81,000.
A bullish breakout will only occur above ₹83,400 with strong volume.
🧠 Market Sentiment & Institutional View:
Volatility: Moderate — no extreme panic or euphoria
Volume: Average — no big accumulation seen
Smart Money Activity: Likely waiting near breakout levels or lower discount zones (₹81,000)
🔚 Summary:
🔴 Short-Term Bias: Slightly Bearish
🟡 Key Range: ₹81,800 – ₹83,400
✅ Buyers' Entry Point: Above ₹83,400
⚠️ Sellers' Trigger: Below ₹82,200 or ₹81,800 for more downside
Learn Institutional Trading Part-9🎯 Why Learn Advanced Option Trading?
Advanced option trading lets you:
✅ Profit in bullish, bearish, or sideways markets
✅ Use time decay to your advantage
✅ Limit risk while maximizing potential reward
✅ Create non-directional trades
✅ Build hedged and balanced positions
✅ Use data, not emotion for decision making
It shifts you from being a trader who hopes for direction to one who profits from market behavior — movement, volatility, time decay, and imbalance.
🧠 Core Concepts in Advanced Option Trading
1. Option Greeks
Understanding the Greeks is essential for advanced strategies.
Delta: Measures price sensitivity to the underlying (helps with directional trades).
Theta: Measures time decay. Option sellers use Theta to earn premium.
Vega: Measures sensitivity to implied volatility (IV).
Gamma: Measures how Delta changes — useful for adjustments and hedging.
Rho: Interest rate sensitivity (used in long-term options).
Greeks help you balance risk and reward and fine-tune your strategies based on volatility and time.
2. Implied Volatility (IV) & IV Rank
IV shows the market’s expectation of future volatility.
High IV = high premium; low IV = cheap premium.
IV Rank compares current IV to its past 52-week range — essential for deciding whether to buy or sell options.
💡 Advanced rule:
High IV + High IV Rank = Favor selling options
Low IV + Low IV Rank = Favor buying options
3. Multi-Leg Strategies
Multi-leg trades involve using more than one option to hedge, balance, or amplify your position.
Here are the most popular advanced option strategies:
🔼 Bullish Strategies
🔹 Bull Call Spread
Buy one lower strike Call, sell a higher strike Call
Profits if the market rises within a defined range
Lower cost than buying a single Call
🔹 Synthetic Long
Buy a Call and Sell a Put of the same strike
Replicates owning the underlying, but with options
🔽 Bearish Strategies
🔹 Bear Put Spread
Buy a higher strike Put, sell a lower strike Put
Profits if market falls within a defined range
🔹 Ratio Put Spread
Buy one Put, sell two lower-strike Puts
Low-cost or credit strategy with higher reward if price falls moderately
🔁 Neutral or Range-Bound Strategies
🔹 Iron Condor
Sell one Call spread and one Put spread
Profits if market stays between both spreads
Ideal in low volatility, sideways markets
🔹 Iron Butterfly
Sell ATM Call and Put, buy OTM wings
Profits from time decay and stable price
High Theta, limited risk and reward
🔹 Straddle (Buy/Sell)
Buy/Sell ATM Call and Put
Used when expecting high volatility (Buy) or low volatility (Sell)
🔹 Strangle
Buy/Sell OTM Call and Put
Lower cost than Straddle, wider profit zone
🛡️ Hedging Strategies
🔹 Protective Put
Hold underlying asset, buy a Put to limit downside
Like insurance for your long position
🔹 Covered Call
Hold stock, sell a Call to generate income
Profitable if the stock stays flat or rises slightly
🔹 Collar Strategy
Hold stock, buy Put and sell Call
Risk defined, reward capped — good for conservative investors
📊 Open Interest & Option Chain Analysis
Open Interest (OI) shows where the majority of contracts are built.
High OI + Price Rejection = Institutional Resistance/Support.
Watching Call/Put buildup gives clues about range, breakout zones, and expiry-day moves.
💡 PCR (Put Call Ratio): A sentiment indicator.
PCR > 1: More Puts → Bearish
PCR < 1: More Calls → Bullish
⏱️ Time Decay & Expiry Trades
Advanced traders use weekly options to capitalize on Theta decay. Weekly expiry strategies include:
Short Straddles/Strangles
Iron Condors
Calendar Spreads
These strategies make use of:
Fast premium decay on Thursday/Friday
Stable market periods
Defined risk setups
🧠 Advanced Psychology & Risk Control
Professional option traders don’t overtrade or overleverage. They:
Follow the 1–2% risk per trade rule
Avoid trading during event-based spikes (e.g., budget, Fed speeches)
Take non-directional trades in consolidating markets
Focus on probability over prediction
Maintain a trading journal and review setups
🎓 Pro Tips to Master Advanced Option Trading
✅ Understand the Greeks — especially Theta & Vega
✅ Use multi-leg strategies to reduce risk and cost
✅ Follow IV Rank — don’t buy expensive options
✅ Use high reward-to-risk setups
✅ Track OI build-up and option chain flow
✅ Avoid gambling — options are tools, not lottery tickets
✅ Always use hedged positions, especially when selling options
🧘 Final Words: Become the Strategist, Not the Speculator
Advanced Option Trading is not about guessing where the market will go — it’s about constructing trades that win in multiple scenarios.
It empowers you to:
Manage risk like a professional
Generate regular income from time decay
Adjust and defend trades when things go wrong
Trade with confidence, not emotion
If you’re ready to move beyond basic buying and start mastering the real edge in options, advanced strategies are your next level. This is how institutions trade. This is how real consistency is built.

Learn Institutional Trading Part-7🎯 What is Institutional Trading?
Institutional trading is the process by which large entities — such as investment banks, hedge funds, mutual funds, and proprietary trading firms — participate in the market using large volumes of capital. These institutions don’t follow the strategies used by most retail traders. Instead, they use techniques that are based on market structure, liquidity, and logic, not indicators or news.
When you master institutional trading, you learn how to think like the smart money. You understand why price moves, not just how. This knowledge allows you to anticipate large moves instead of reacting to them late.
🔍 Key Concepts to Master
✅ Market Structure Phases
Institutions move through four major phases:
Accumulation – Quiet buying or selling in a range
Manipulation – False moves to trap retail traders
Expansion – Sharp move in the real direction
Distribution – Profit-taking while the crowd enters late
Understanding these phases helps you spot entries early and avoid fakeouts.
✅ Liquidity & Stop Hunts
Institutions need liquidity to enter large positions. They often drive price toward zones full of stop-losses or breakout traders, then reverse the market. These areas are called liquidity pools.
Retail traders get stopped out — smart traders enter after the trap, with the institutions.
✅ Order Blocks & Imbalances
Institutions often leave footprints through large unbalanced candles or zones (called order blocks and fair value gaps). These areas act as magnets for future price moves. Mastering these zones gives you high-accuracy entries with solid risk-reward.
💼 Why It Works
Retail traders lose because they follow emotion and indicators. Institutional traders win because they:
Wait for precision setups
Manage risk with discipline
Trade based on logic, structure, and liquidity
Don’t chase trades — they let the market come to them
When you master institutional trading, you adopt this same mindset. You become patient, calculated, and consistent

Learn Institutional Trading Part-4📌 What is Institutional Trading?
Institutional trading refers to the strategies, mindset, and techniques used by large financial institutions when they participate in the markets. These entities trade with huge volumes and require liquidity, accuracy, and control in their execution.
Unlike retail traders who might buy or sell a few lots or shares, institutions often enter with millions of dollars at a time. If they enter the market carelessly, they would move the price against themselves. Hence, they use highly calculated and strategic methods to enter and exit positions without creating obvious footprints.
These strategies are often referred to as Smart Money Concepts (SMC) — techniques that revolve around price manipulation, liquidity traps, and understanding market structure.
🎯 Why Do You Need to Learn Institutional Trading?
Most retail traders lose because:
They chase price.
They follow lagging indicators.
They get trapped in fake breakouts.
They trade based on emotions, not logic.
Institutional trading flips that mindset. You learn to:
Trade with the big players, not against them.
Identify where the real buying and selling is happening.
Understand why price reverses suddenly — often after retail entries.
Predict market moves based on logic and liquidity, not noise.
By learning how institutions think and act, you become a more disciplined, data-driven trader with higher probability setups and better risk management.
🧠 Core Concepts of Institutional Trading
Let’s dive into the most important concepts every institutional trader must understand:
1. Market Structure
Institutions operate within clear phases of market movement:
Accumulation: Smart money quietly builds positions in a range.
Manipulation: They fake breakouts or induce retail traders to create liquidity.
Expansion: The actual move begins in the intended direction.
Distribution: They offload their positions to late traders before reversing.
If you can identify these phases, you’ll always know where you are in the market — and what’s likely to come next.
2. Liquidity Pools
Liquidity is the fuel institutions need to place trades. They don’t use limit orders like retail traders. Instead, they seek zones with large clusters of stop-losses, pending orders, and breakout trades to enter and exit positions.
These zones are:
Swing highs and lows
Trendline breaks
Support/resistance levels
Retail breakout levels
You’ll often see the market spike into these areas and reverse — that’s not a coincidence. That’s institutional activity.
3. Order Blocks
An order block is a candle (usually bearish or bullish) where institutions placed large orders before a major market move. These zones often act as future supply and demand levels, where price returns to fill orders again.
Order blocks help you:
Identify powerful entry points.
Predict reversals or continuations.
Understand institutional footprints on the chart.
4. Fair Value Gaps (FVG)
A Fair Value Gap is a price imbalance between buyers and sellers — often created when institutions enter with speed and aggression. The market typically returns to fill this gap before continuing the trend.
FVGs are great for:
Entry confirmations
Predicting retracements
Identifying imbalance zones where price is “unfair”
6. Inducement & Mitigation
Inducement: Institutions create fake signals to trick retail traders into entering, generating the liquidity they need.
Mitigation: Institutions revisit previous zones to close old trades or rebalance positions — often creating hidden entries.
These tactics show how institutions intentionally manipulate price to maximize their position efficiency.
📊 Tools Institutional Traders Use
While many retail traders rely heavily on indicators like RSI, MACD, or Bollinger Bands, institutional traders focus more on:
Price action
Volume analysis
Open interest in options/futures
Liquidity maps
Time-based market behavior (sessions: London, NY, Asia)
Their edge comes from understanding what the market is doing, not what an indicator is telling them.
🧱 Institutional Risk Management
Institutions don’t gamble. Every trade is backed by:
Precise entry, stop-loss, and take-profit levels
Predefined risk percentages
Diversification and hedging
Capital allocation rules
They don’t revenge trade. They don’t overtrade. They focus on high-probability setups with calculated risk.
Retail traders can learn from this by:
Sticking to a trading plan
Managing emotions
Risking only a small % of their capital
Focusing on quality over quantity
📈 Institutional Trading in Action (Example)
Let’s say the market has been ranging for 3 days. Suddenly, price spikes up through a resistance level — a breakout! Retail traders jump in long.
But then, within minutes, price reverses sharply downward. Stop-losses are hit. Panic sets in.
What happened?
Institutions induced a breakout, used retail stop-losses as liquidity, filled their short positions, and now the real move — downward expansion — begins.
Understanding this flow helps you trade with the move, not against it.
👨🏫 Who Should Learn Institutional Trading?
This approach is ideal for:
Day traders looking for accurate short-term moves
Swing traders seeking strong trend setups
Options traders who want to align positions with institutional flow
Forex and crypto traders who want to stop chasing signals and start following structure
🚀 Benefits of Learning Institutional Trading
✅ Higher accuracy entries
✅ Better reward-to-risk ratios
✅ Less emotional trading
✅ Deeper understanding of price movement
✅ Freedom from lagging indicators
✅ Long-term trading consistency
🎓 Final Thoughts: Become the Hunter, Not the Hunted
Retail traders are often the prey in a game designed by institutions. But by learning institutional trading, you flip the script. You become the hunter — identifying setups, planning moves, and acting with precision.
Institutional trading is not about being right every time — it's about being strategic, calculated, and aligned with the flow of money

AI & Algo-Based Automated Trading🤖 What Is Algorithmic Trading?
Algorithmic Trading, or simply Algo Trading, is when computer programs automatically place buy/sell orders based on pre-defined rules, without human intervention.
Imagine giving your laptop a checklist like:
“If Nifty goes above 22,500 AND RSI is above 60 AND volume is high, then BUY.”
The computer will monitor the market 24x7—and the moment this condition is met, it will execute the trade automatically in milliseconds.
This kind of rule-based, automated trading using programs is Algo Trading.
🧠 What Is AI in Trading?
AI-based trading goes a step further.
Unlike basic algos that follow fixed rules, AI can learn, adapt, and improve with experience—just like humans.
Using technologies like:
Machine Learning (ML)
Natural Language Processing (NLP)
Neural Networks
Predictive Analytics
AI systems analyze massive amounts of data, including charts, volumes, news, tweets, macro events, and more—and predict future price movements or generate smart trading signals.
So while Algo Trading is like giving instructions to a robot, AI Trading is like training a robot to think like a trader
How Does Algo Trading Work?
Algo trading usually follows a 4-step cycle:
Strategy Design:
You create a trading rule, e.g. “Buy if 5 EMA crosses 20 EMA”.
Execution:
Set it up with your broker or software to trade automatically.
Monitoring:
Keep an eye to adjust for market conditions or technical issues.
Common Algo Strategies:
Moving average crossovers
Mean reversion
Arbitrage (buy low, sell high across markets)
Trend following
Momentum trading
Scalping (multiple small profits in quick trades)
🔮 How Does AI-Based Trading Work?
AI-based systems do all the above PLUS:
Analyze news sentiment (good or bad for a stock)
Understand social media buzz (like Twitter or Reddit)
Learn from historical chart patterns and price movements
Adjust strategies based on outcomes (self-improvement)
Example:
An AI bot could learn that when crude oil prices rise + VIX increases + USDINR weakens → certain oil & gas stocks tend to rally → it may buy those stocks automatically.
This is smart prediction, not just following a rule.
🌐 Who Uses AI & Algo Trading?
✅ Institutional Investors:
Mutual Funds
FIIs (Foreign Institutional Investors)
Insurance companies
Banks and proprietary trading desks
✅ Hedge Funds:
Quant funds like Renaissance Technologies, Two Sigma, Citadel use AI at scale
💰 Benefits of AI & Algo Trading
Speed – Trades happen in milliseconds. You can’t beat that manually.
Discipline – No emotional trading, no greed or fear.
Scalability – Run multiple strategies on multiple stocks at once.
Precision – Orders are accurate, slippages can be minimized.
⚠️ Risks & Challenges
It’s not all sunshine and profits. Here are some things to be cautious about:
Risk Description
Overfitting Your model may work in the past but fail in live market.
Black Swans Unforeseen events can destroy even smart systems.
Data Issues Bad data = bad trades. Accuracy matters.
Connectivity/Tech If system crashes mid-trade, results can be brutal.
Emotional Blindness AI can't feel panic—good for rules, bad for crisis.
🧠 Real World Use Cases
✅ Example 1: Intraday Scalping Bot
Scans top 100 NSE stocks
Enters trades on VWAP bounces with strict SL
Exits with 0.5-1% target
Runs 50 trades/day across stocks
✅ Example 2: AI News Sentiment Strategy
Uses NLP to scan headlines, tweets, earnings
Classifies news into “Positive”, “Negative”, or “Neutral”
Trades in the direction of sentiment before retail even reacts
✅ Example 3: Pair Trading Algo
Compares movement of two related stocks (e.g. HDFC Bank vs ICICI Bank)
If one deviates too far from the other, it creates a hedge
Buy one, sell the other—profit from convergence
🔁 The Future: AI + Algo + Quantum + Blockchain?
The future of markets is combining:
AI (Decision Making)
Algo (Execution)
Blockchain (Transparency)
Quantum Computing (Speed & Accuracy)
Large financial institutions are already hiring AI scientists and coders instead of traditional analysts. Markets are evolving—and so should we.
🧾 Conclusion
AI & Algo Trading is the future—and the present. It’s fast, smart, and scalable.
Big institutions are already using them to make crores from micro-movements. For retail traders, this is an opportunity to level up, automate emotions out, and trade systematically
Option Selling Strategies for Monthly Income📘 What is Option Selling?
In options trading, you have two parties:
Option Buyer – Pays premium to buy the right (but not obligation) to buy/sell a stock or index
Option Seller (Writer) – Receives that premium, but takes on the obligation to deliver, if the buyer exercises
📌 So, in option selling:
You earn premium upfront
Your profit comes if the option expires worthless
Time is your friend (theta decay helps you)
The odds of success are higher, but risk is theoretically unlimited (if not managed well)
🔧 Core Concepts You Must Know Before Selling Options
✅ 1. Time Decay (Theta)
Option prices fall as expiry nears (especially if OTM)
Sellers benefit because buyers lose value daily
✅ 2. Implied Volatility (IV)
Higher IV = Higher Premiums = Better for sellers
Sell when IV is high, buy when IV is low
✅ 3. Margin Requirement
You need sufficient funds (or collateral) to sell options
Brokers block margin depending on your strategy
✅ 4. Strike Price Selection
Selling options far away from current price reduces risk
Choose strikes based on support/resistance or option chain OI
📦 Top 4 Option Selling Strategies for Monthly Income
Let’s look at the most trusted, beginner-to-pro level strategies used for monthly income.
🔹 1. Covered Call – Best for Stock Investors
You own a stock and you sell a Call Option against it.
Generates income from stocks you already hold
You earn premium every month
If stock stays below strike → you keep stock + premium
If stock crosses strike → your stock may get sold (with profit)
Example:
You hold 1 lot of TCS (300 shares) at ₹3,600
Sell 3700CE for ₹40 premium
If TCS stays below ₹3700, you keep ₹12,000 premium (₹40 × 300)
✅ Low risk
✅ Good for long-term investors
🚫 Limited upside on stock
🔹 2. Cash-Secured Put (CSP) – Get Paid to Buy Stocks
You sell a Put Option for a stock you’re willing to buy at a lower price.
You collect premium
If stock falls below strike → You must buy it
You effectively get stock at discount
Example:
Sell 3600PE in TCS and collect ₹50 premium
If TCS closes above ₹3600, you keep the ₹15,000 premium
If TCS drops below ₹3600, you get to buy it—but at an effective price of ₹3550
✅ Ideal for long-term investors
✅ Safer than naked put selling
🚫 Requires full cash or margin
🔹 3. Short Strangle – Good for Range-Bound Market
You sell one Out-of-the-Money Call and one OTM Put.
Profit if the stock/index remains in a range
You earn premium from both sides
Risk if price moves too much either way
Example (Nifty at 24,000):
Sell 24200CE at ₹100 and 23800PE at ₹120
Total premium = ₹220 (₹11,000 per lot)
Max profit = ₹11,000 if Nifty stays between 23800 and 24200 till expiry
✅ High premium potential
🚫 Unlimited risk if market breaks range
✅ Can be hedged with far OTM buys
🔹 4. Iron Condor – Limited Risk, Limited Reward
This is an advanced version of strangle with protection.
Sell 1 OTM Call + 1 OTM Put
Buy 1 further OTM Call + 1 further OTM Put
You form a “box” where profit is limited, but losses are capped
Example (Nifty at 24000):
Sell 24200CE (₹100) + 23800PE (₹120)
Buy 24400CE (₹30) + 23600PE (₹40)
Total premium = ₹220 – ₹70 = ₹150
Max profit = ₹150 × 50 = ₹7,500
Max loss = ₹50 (difference in strikes – net credit)
✅ Great for peace of mind
✅ No unlimited risk
🚫 Less profit than naked strangle
📅 How to Use These Strategies for Monthly Income
🔄 Repeat Monthly:
Choose 1 or 2 strategies
Select stocks or index with high liquidity
Sell options 20–30 days before expiry
Exit before expiry (if needed) or let decay work
📌 Ideal Instruments:
Nifty / Bank Nifty
Liquid stocks: Reliance, HDFC Bank, Infosys, ICICI, TCS
🧠 Smart Practices:
Trade with capital you can afford to lock for a few weeks
Don’t sell options blindly – check news, IV, support/resistance
Use alerts or trailing stops
⚠️ Risks and How to Manage Them
Risk How to Handle
Unlimited Loss Use hedging (e.g., iron condor) or stop-losses
Sudden Market Moves Avoid during events (budget, elections, Fed)
Low Premium Don't sell too close to expiry with low reward
Margin Call Keep extra buffer; monitor exposure
Overtrading Stick to 1–2 good trades per expiry
✅ Final Thoughts
Option selling is not a get-rich-quick tool—but it’s a powerful way to generate stable income month after month, when done with patience, logic, and discipline.
You don’t need to be a genius—just:
Understand how premiums behave
Focus on low-risk, high-probability trades
Use hedges and stop-losses
Stick to tested rules
Track your performance and learn from mistakes
Sensex – 1D Timeframe📅 Sensex Daily Timeframe Analysis (1D) – As of 19 July 2025
📊 1. Market Summary
Closing Price: ₹81,758
Change from Previous Day: –502 points (–0.61%)
Day’s High: ₹82,193
Day’s Low: ₹81,609
52-Week High/Low: ₹85,978 / ₹71,425
➡️ Sensex dropped for the third day in a row and is showing signs of continued weakness.
🕯️ 2. Candlestick Behavior (1-Day Chart)
The candle formed is a bearish candle with a small body and an upper wick.
This means that the price went up intraday but couldn't hold and was sold off by the end of the day.
Sellers are actively pushing price down, especially near ₹82,000.
📉 3. Trend Direction
The market is in a clear downtrend.
This is seen by:
Lower highs (each peak is smaller than the last one)
Lower lows (each dip is deeper)
Sensex is unable to break back above key levels like ₹82,200 – showing strong selling pressure.
🧠 Trend Summary:
Price action is confirming bearish momentum. Buyers are weak, sellers are in control
📘 6. Volume & Market Strength
Volume is average to slightly rising on red (down) candles.
This shows active selling by institutions or large players.
No large green candle with volume = no strong buyer support yet.
💹 7. Simple Trading Strategy Based on 1D Timeframe
✅ If You’re a Swing Trader:
Bearish Bias: Sell on rise near ₹82,200 or ₹82,600
Target 1: ₹81,466
Target 2: ₹81,174
Stop Loss: Above ₹82,600 (or use trailing SL)
⚠️ If You’re Waiting for a Buy Opportunity:
Wait for price to touch ₹80,739 – ₹81,174 zone, then look for bullish reversal signals (big green candle, volume, RSI > 35)
🔚 Final Thoughts:
Sensex is under pressure.
No major recovery sign is seen yet.
A bounce is possible only near major support zones, but for now, bears are winning.
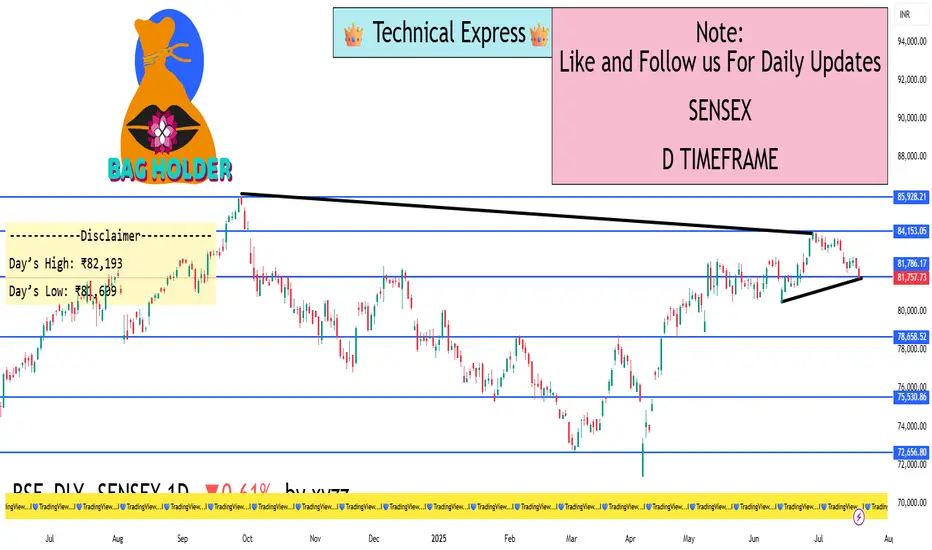
Option Trading✅ Why Trade Options?
📊 Profit in All Market Conditions — Whether markets go up, down, or stay flat, options allow you to build strategies for every scenario.
💰 Limited Risk, High Reward — With proper strategies like buying options, you can limit your risk to the premium paid but enjoy unlimited upside.
🔒 Hedge Existing Investments — Investors use options to protect their portfolios from market crashes.
🧩 Flexibility — Options allow for creative trade setups such as income generation, speculation, and hedging.
📉 Leverage — Control larger positions with less capital.
✅ Key Concepts in Option Trading
1. Call Option (Buy Side):
Gives the buyer the right to buy an asset at a certain price before expiry.
✅ Call Buyer profits when price goes up.
✅ Call Seller (Writer) profits when price stays flat or falls.
2. Put Option (Sell Side):
Gives the buyer the right to sell an asset at a certain price before expiry.
✅ Put Buyer profits when price goes down.
✅ Put Seller profits when price stays flat or rises.
✅ Important Terms to Know
Strike Price – The fixed price at which you can buy or sell the underlying asset.
Premium – The cost paid by the option buyer to the seller for the right to exercise.
Expiry Date – The date when the option contract becomes void.
In-the-Money (ITM) – Option has intrinsic value (profitable if exercised).
Out-of-the-Money (OTM) – Option has no intrinsic value (unprofitable if exercised).
At-the-Money (ATM) – Option strike is closest to the current market price.
✅ Popular Option Trading Strategies
1. Directional Strategies:
Long Call – Profit from rising markets.
Long Put – Profit from falling markets.
2. Non-Directional Strategies:
Iron Condor – Profit from range-bound markets.
Straddle/Strangle – Profit from big movements in either direction.
Butterfly Spread – Low-cost strategy for limited movement with high reward potential.
3. Income Strategies:
Covered Call – Selling calls on owned stocks for premium income.
Cash-Secured Put – Selling puts on stocks you want to own at a lower price.
✅ Advanced Concepts for Institutional-Level Trading
📌 Implied Volatility (IV): Measures expected future volatility; options become expensive when IV rises.
📌 Theta Decay: Time decay that eats away premium, favoring option sellers.
📌 Delta, Gamma, Vega, Theta (Greeks): Quantify how option prices react to changes in market conditions.
📌 Hedging with Options: Professionals hedge large portfolios using protective puts or collars.
📌 Liquidity and Open Interest: High open interest means better liquidity, tighter spreads, and easier trade execution.
✅ Why Institutions Prefer Option Trading
Institutions, banks, and hedge funds use options to:
Hedge large stock portfolios.
Generate steady returns through premium collection.
Manage volatility exposures.
Create complex structured products.
They use strategic adjustments, rollovers, and risk-defined positions to control large portfolios with precision.
✅ Common Mistakes to Avoid in Options
❌ Trading without understanding volatility impact.
❌ Ignoring time decay when buying options.
❌ Going all-in on OTM options with low probabilities.
❌ Not managing trades near expiry.
❌ Trading without considering the Greeks.
✅ Final Thoughts
Option Trading is not gambling — it’s a professional tool for risk management, income generation, and speculation. When used correctly, options offer high flexibility, controlled risk, and diverse profit opportunities. However, success requires education, discipline, and strategy.
Learn the true power of Option Trading, master market behavior, and you will have one of the most versatile weapons in your financial toolkit

Divergence Secrets✅ What is Divergence?
Divergence occurs when price action and an indicator (usually a momentum oscillator) move in opposite directions. This signals a disconnection between price and momentum, often happening before significant reversals.
Most Common Indicators Used:
RSI (Relative Strength Index)
MACD (Moving Average Convergence Divergence)
Stochastic Oscillator
CCI (Commodity Channel Index)
✅ Types of Divergence
1. Regular Divergence (Classic Divergence)
Bullish Divergence: Price makes lower lows, but the indicator makes higher lows → Suggests potential upward reversal.
Bearish Divergence: Price makes higher highs, but the indicator makes lower highs → Suggests potential downward reversal.
📌 Use Case: Best applied during downtrends (bullish divergence) or uptrends (bearish divergence) to catch reversals.
2. Hidden Divergence (The Professional’s Favorite)
Bullish Hidden Divergence: Price makes higher lows, but indicator makes lower lows → Signals trend continuation upwards.
Bearish Hidden Divergence: Price makes lower highs, but indicator makes higher highs → Signals trend continuation downwards.
📌 Use Case: Hidden divergence is used to confirm trend continuation after pullbacks, ideal for trend traders.
3. Exaggerated (Extended) Divergence
Price forms equal highs/lows, but the indicator shows higher lows/lower highs → Signals momentum build-up for reversal.
📌 Use Case: Seen at range breakouts or market tops/bottoms.
✅ Why Divergence Works (Institutional View)
Liquidity Manipulation: Institutions push price to make new highs/lows to grab liquidity, but momentum slows because real volume decreases.
Momentum Imbalance: Even as price extends, internal market strength weakens, revealed through divergence.
Smart Money Accumulation/Distribution: Divergence often appears when institutions quietly build or offload positions, creating momentum shifts.
✅ Advanced Divergence Trading Secrets
🔥 Secret #1: Multi-Timeframe Divergence
Always check divergence on higher timeframes (H4, Daily), then execute entries on lower timeframes (M15, H1).
A daily divergence holds more power than M15 divergence.
🔥 Secret #2: Confluence with Support/Resistance or Order Blocks
Divergence is strongest when it happens at a key structure level (support, resistance, order block, or imbalance zone).
Don’t trade divergence alone — combine it with price reaction at major zones.
🔥 Secret #3: Wait for Structure Break Confirmation
After divergence, wait for Break of Structure (BOS) or Change of Character (CHoCH) to confirm reversal.
This filters out many false divergence signals.
🔥 Secret #4: Volume Confirmation
Confirm divergence with volume drop or volume spike reversal.
Divergence with low participation increases reversal probability.
✅ Pro Divergence Entry Method
✅ Spot Divergence at key levels.
✅ Wait for candlestick confirmation (engulfing candle, pin bar, inside bar).
✅ Look for Break of Minor Structure.
✅ Enter on retest of BOS/CHoCH zone or order block.
✅ Stop loss below swing low/high, target next liquidity pool or imbalance zone.
✅ Common Mistakes to Avoid
❌ Trading divergence without context (e.g., countering a strong trend blindly).
❌ Ignoring higher timeframe trend direction.
❌ Entering without confirmation candle or structure break.
❌ Using lagging indicators without understanding price action.
✅ Final Thoughts
Divergence is a leading indicator, but it must be combined with market structure, key levels, and confirmation price action. Professionals use divergence as a warning sign, not an instant entry trigger. By mastering divergence, you can predict market exhaustion, capture high-reward reversals, and avoid common retail traps.
Divergence is one of the hidden secrets of market timing — master it, and your trading accuracy will improve dramatically

Support and Resistence Part-2✅ The True Meaning of Support and Resistance
At the core, support and resistance levels are psychological price areas where supply and demand dynamics shift. However, in institutional trading, these levels are engineered by large players to trigger retail reactions — such as false breakouts, stop hunts, and liquidity grabs.
Institutions use these levels to:
Accumulate large positions without moving the market.
Manipulate price to create breakout traps.
Trigger liquidity pools where retail stop-losses and pending orders are stacked.
✅ Types of Advanced Support and Resistance
1. Liquidity-Based Zones
Institutions seek liquidity to fill their large orders. They target zones where retail traders:
Place stop losses.
Have pending buy/sell orders.
Expect breakout continuations.
These zones are rarely clean horizontal lines but broader zones where price can spike in and quickly reverse.
2. Order Blocks
Order blocks are the last bullish or bearish candles before a significant price move caused by institutional orders. These are key institutional support/resistance levels where price often returns for mitigation or re-entry.
Bullish Order Block = Support Zone
Bearish Order Block = Resistance Zone
3. Breaker Blocks
When support breaks and flips to resistance (or vice versa), institutions often retest breaker blocks to add positions or induce liquidity.
4. Fibonacci Confluence Zones
Advanced traders use Fibonacci retracement and extension levels in combination with support and resistance zones to identify high-probability trade setups. Common levels like 61.8% and 78.6% often align with key order blocks.
5. Dynamic Support & Resistance (Moving Averages, VWAP)
Institutions monitor:
200 EMA/SMA on higher timeframes as dynamic resistance/support.
VWAP (Volume Weighted Average Price) as an institutional support/resistance during intraday moves.
These dynamic levels often act as price magnets during trend days.
✅ Institutional Manipulation Around Support/Resistance
🔹 Liquidity Grabs (Fake Breakouts):
Price breaks a key level (support or resistance), triggers stops, grabs liquidity, and violently reverses.
Common in forex, indices, and crypto markets.
🔹 Stop Loss Hunting:
Institutions drive price into known stop zones to fill large orders cheaply, especially during low-volume sessions.
🔹 Re-Tests and Confirmations:
Professional traders wait for confirmation after breakouts.
A common method: Break – Retest – Continuation setup, especially around higher timeframe support/resistance.
✅ How to Trade Support and Resistance Like an Institution
Mark Zones, Not Lines: Use zones (20-50 pip zones in forex or 1-2% zones in stocks), not fixed lines.
Use Multi-Timeframe Confluence: Identify higher timeframe levels (Daily, Weekly) and trade based on lower timeframe confirmations (M15, M30, H1).
Wait for Confirmations: Avoid blind entries. Wait for:
Rejection Candles (Pin Bar, Engulfing, Doji)
Break of Structure (BOS) or Change of Character (CHoCH) after grabbing liquidity.
Target Imbalance Zones: Combine support/resistance with fair value gaps (FVG) or imbalances where price is likely to revisit.
Track Volume Reaction: Volume spikes at support/resistance zones often indicate institutional activity.
✅ Pro Tips for Mastering Support and Resistance
Never chase price. Let the market come to your zones.
Higher timeframe levels = stronger reaction zones.
Watch for ‘fakeouts’ during news releases – institutions use volatility to create liquidity spikes.
Learn to recognize exhaustion (long wicks, low momentum) after liquidity grabs to confirm reversals.
Institutional levels often align with market sessions – London Open, New York Open tend to respect these zones more than Asian session.
✅ Final Thoughts
At an advanced level, support and resistance aren’t simple price levels — they are strategic zones used by institutions to trap uninformed traders. Once you start recognizing these patterns, you’ll stop reacting emotionally and start anticipating market behavior like a professional. You’ll know when to stay patient, when to avoid traps, and when to capitalize on market inefficiencies with high-probability, low-risk trades.
