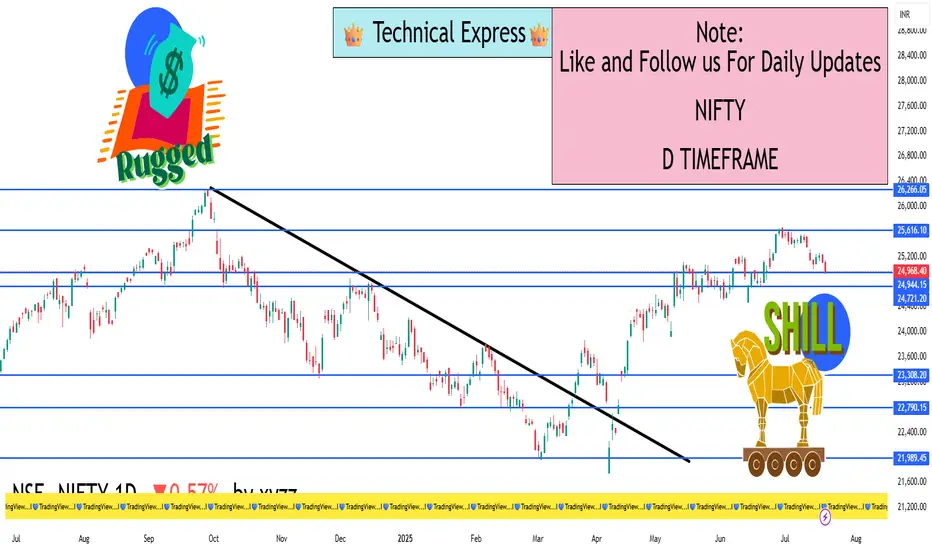
Nifty 50 – 1 Day Timeframe✅ Closing Summary:
Closing Price: ₹24,968.30
Change: −₹143.55 (−0.57%)
Opening Price: ₹25,108.55
Intraday High: ₹25,144.20
Intraday Low: ₹24,919.10
Nifty 50 traded in a narrow but bearish range throughout the session, losing nearly 0.6%, as market sentiment remained weak due to earnings pressure and global cues.
🔍 Key Reasons for the Decline:
Banking Sector Drag:
Major private sector banks like Axis Bank reported weaker-than-expected earnings, sparking a broad sell-off in financials.
Financial stocks make up a large portion of Nifty 50, pulling the entire index lower.
Cautious Investor Sentiment:
Global uncertainty regarding U.S. Federal Reserve interest rate decisions and economic slowdown concerns weighed on overall risk appetite.
Investors are also being cautious ahead of major Indian corporate earnings from companies like HDFC Bank, ICICI Bank, Reliance Industries, and others.
Foreign Institutional Selling (FII):
FIIs continued to sell Indian equities, especially large-cap financials and IT stocks.
This added selling pressure even as some domestic institutional investors tried to buy the dips.
Technical Weakness:
The index slipped below the 25,000 psychological support level, a sign of short-term technical weakness.
Intraday recoveries were capped near resistance, confirming the bearish tone.
📈 Technical Outlook (Short-Term):
Support Zone: ₹24,900 to ₹24,850
This is the next critical area. If broken, further decline toward ₹24,600 is likely.
Resistance Zone: ₹25,150 to ₹25,300
Bulls need to reclaim this zone for the trend to turn positive again.
Momentum Indicators:
RSI: Slipping below 45, showing weakening momentum.
MACD: Bearish crossover; trend remains under pressure.
Volume: Slightly above average, indicating serious selling interest at the top.
📆 Recent Trend Performance:
1-Day Return: −0.57%
1-Week Return: −0.35%
1-Month Return: +2.10%
6-Month Return: +12.8%
1-Year Return: +10.9%
Nifty 50 remains in a medium- to long-term uptrend, but short-term correction is underway, largely due to sector-specific drag and earnings volatility.
🧠 What Traders & Investors Should Know:
Day Traders: Watch for quick reversals near support at ₹24,900; consider shorting near resistance if recovery fails.
Swing Traders: Wait for either a bullish reversal candle or RSI bounce before entering fresh long positions.
Long-Term Investors: Despite the dip, the market remains healthy. This could be a buy-on-dip opportunity, especially in sectors like auto, pharma, and capital goods that are holding well.
💬 Conclusion:
Nifty 50 showed weakness on July 18 due to negative earnings surprises and bearish sentiment in financials. While technical indicators suggest short-term downside pressure, the broader long-term trend remains intact. Key support at ₹24,900 is crucial. A bounce from that zone can trigger a recovery, but a sustained break below it could accelerate the decline
Tatasteel
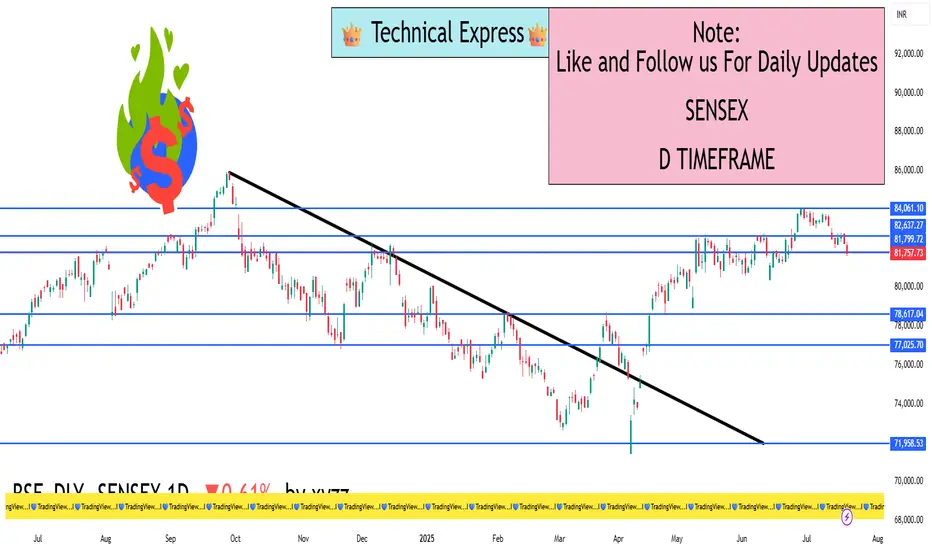
Sensex – 1 Day Timeframe✅ Closing Summary:
Closing Price: ₹82,540.65
Change: −₹501.34 (−0.60%)
Opening Price: ₹83,081.80
Intraday High: ₹83,114.95
Intraday Low: ₹82,488.25
The Sensex fell over 500 points, reflecting broad-based selling across banking, IT, and financial services. The index struggled to hold gains and faced resistance at higher levels throughout the day.
🔍 Key Reasons for the Decline:
Weak Earnings from Financials:
Axis Bank and other financial stocks reported disappointing quarterly results.
As financial stocks hold significant weight in the Sensex, this created negative sentiment across the board.
IT and Tech Sector Pressure:
Global uncertainty, U.S. Fed rate concerns, and weak guidance from global tech firms contributed to a fall in Indian IT stocks like Infosys and TCS, dragging the index.
Foreign Institutional Investor (FII) Selling:
FIIs were net sellers in July, putting pressure on large-cap blue-chip stocks.
Persistent outflows created downward pressure on the index despite support from domestic institutional buyers.
Global Market Cues:
Mixed global signals, rising oil prices, and uncertain interest rate outlooks kept risk sentiment subdued.
Caution ahead of major global economic data further prevented buying enthusiasm.
📈 Technical Outlook (Short-Term):
Support Zone: ₹82,300 to ₹82,000
This is a key demand zone. A breakdown below could lead to further downside towards ₹81,500.
Resistance Zone: ₹83,150 to ₹83,500
Any bounce-back will face selling near this region unless backed by strong buying volume.
Indicators:
RSI: Dropped below 45, indicating weakening strength.
MACD: Shows a bearish crossover, confirming short-term negative momentum.
Volume: Heavier than average, signaling increased institutional activity on the sell side.
📆 Recent Trend Performance:
1-Day Return: −0.60%
1-Week Return: −0.45%
1-Month Return: +1.85%
6-Month Return: +12.3%
1-Year Return: +11.7%
The index remains strong over the long term, but the short-term chart reflects a corrective phase amid sectoral weakness.
🧠 What Traders & Investors Should Know:
Short-Term Traders: Monitor the 82,300 level for signs of bounce or breakdown. Potential intraday setups are forming, but caution is advised.
Swing Traders: Wait for a confirmation candle—like a bullish engulfing or hammer—near the support before entering long positions.
Long-Term Investors: This correction may offer a healthy buy-on-dip opportunity, particularly in stocks with strong fundamentals in auto, capital goods, and FMCG sectors.
💬 Conclusion:
The Sensex declined nearly 0.60% due to earnings pressure from major financials and global uncertainty impacting IT and large-cap stocks. While the market sentiment remains weak in the short term, the long-term uptrend is still intact. Key support around ₹82,300 will determine the near-term direction. If held, a rebound may follow next week, especially if major earnings turn out better than expected.
Bitcoin (BTC/USD) – 1D Timeframe✅ Closing Summary:
Closing Price: ~$119,138 USD
Change: +$836 (+0.7%)
Opening Price: ~$118,302
Intraday High: ~$120,714
Intraday Low: ~$117,715
Bitcoin continued to show resilience by holding above the crucial $118,000 support level, despite facing overhead resistance near its previous high. The price action reflects bullish consolidation following recent surges above $120,000.
🔍 Key Reasons Behind the Price Action:
Institutional Demand Strengthening:
Bitcoin ETFs in the U.S. are witnessing rising inflows.
Hedge funds and family offices are seen increasing allocations, especially as digital assets gain legitimacy post-regulation discussions.
Regulatory Momentum:
U.S. Congress is pushing clearer frameworks around crypto taxation and stablecoins.
Global regulatory certainty (from EU & Japan) boosts confidence among investors and traders.
Weakening U.S. Dollar Index (DXY):
The DXY declined slightly, indirectly aiding BTC’s upward momentum.
Bitcoin remains a favored alternative store of value during fiat uncertainty.
Limited Miner Selling:
On-chain data shows a decline in miner distribution, meaning less sell-side pressure.
Miners seem optimistic about long-term prices and are holding reserves.
📈 Technical Outlook (Short-Term):
Support Zone: $117,500 to $118,000
Price found strong buyers in this range. It’s crucial that Bitcoin holds this level to maintain bullish structure.
Resistance Zone: $120,700 to $122,500
Previous highs around $122K serve as the next resistance. A daily candle close above this may trigger momentum buying.
Indicators:
RSI (Relative Strength Index): ~62 (bullish but not overbought)
MACD: Bullish crossover confirmed
Volume: Moderate, but above 20-day average
📆 Recent Trend Performance:
1-Day Return: +0.7%
1-Week Return: +2.1%
1-Month Return: +12.8%
3-Month Return: +35.4%
YTD Return: +61.2%
Bitcoin continues to outperform traditional asset classes, showing strong long-term growth despite short-term volatility.
🧠 What Traders & Investors Should Know:
Short-Term Traders: Consider range trading between $118K–$122K. Breakout above $122K may signal fresh upside potential.
Swing Traders: Watch for bullish continuation patterns (bull flags or cup-and-handle). Enter long if price closes above $121.5K on high volume.
Long-Term Investors: Accumulation at current levels could be ideal before the next halving cycle and broader adoption via ETFs and institutions.
🛠️ Chart Behavior and Candlestick Analysis:
Candle Type: Bullish candle with long lower wick, indicating buying pressure near support.
Pattern: Minor flag formation with potential breakout above $121K on next daily move.
🧭 Macro-Level Catalysts to Watch:
U.S. Bitcoin ETF weekly flows (Friday updates)
Fed interest rate guidance (next FOMC meeting)
Crypto regulation developments in U.S., EU, and APAC
On-chain metrics: exchange inflow/outflow, whale accumulation
💬 Conclusion:
BTC/USD is showing solid structure in the 1D chart. With strong institutional demand, improving global regulation, and technical support holding, Bitcoin is in a healthy uptrend. The short-term outlook remains bullish as long as BTC holds above $118K. A breakout above $122K could fuel the next leg towards $125,000–$130,000.

Master Institutional TradingWhat is Master Institutional Trading?
Master Institutional Trading is the advanced knowledge and skill set focused on understanding how big institutions operate in the market. It includes learning about market structure, order flow, liquidity zones, and smart money concepts. The goal is to understand where and why institutional players are placing their trades so individual traders can follow their footprint rather than trade blindly.
Key Elements of Institutional Trading
Smart Money Concepts (SMC):
This focuses on how "smart money" (institutions) moves in the market, including liquidity grabs, fakeouts, and manipulation of retail traders. Mastering SMC helps traders identify high-probability trade setups.
Order Blocks:
Institutions don’t place orders like retail traders. They use large block orders, which leave visible patterns on charts called “order blocks.” Learning to identify these helps in predicting price movements accurately.
Liquidity Pools:
Institutions hunt liquidity because they need large volumes to execute trades. Stop-loss levels and obvious support/resistance zones are common liquidity areas. Master institutional traders learn to identify where liquidity sits in the market.
Market Structure:
Understanding market structure (higher highs, lower lows, break of structure) is critical. Institutions move the market in phases — accumulation, manipulation, expansion, and distribution.
Volume and Order Flow Analysis:
Mastering institutional trading includes studying how volume flows in the market, using tools like volume profile, footprint charts, and delta analysis to see where institutional money is entering or exiting.
Benefits of Learning Master Institutional Trading
Higher Accuracy: You trade with the market makers, increasing your chance of success.
Better Risk Management: Institutional strategies often involve precise entry points and tighter stop-losses.
Avoiding Retail Traps: Most retail traders lose money because they trade in the wrong direction. Institutional trading helps you avoid these traps.
Consistency: You develop a rule-based approach, avoiding emotional decisions.
Why Institutions Dominate the Market
Institutions control over 70% of daily market volume, especially in forex, stocks, and commodities. They have advanced technologies like high-frequency trading (HFT), deep market data, and insider information that allow them to manipulate short-term price actions. By understanding their strategies, you can ride the momentum they create rather than getting trapped.
Final Thoughts
Mastering Institutional Trading is not about predicting the market but reading it correctly. By learning how institutional players think and operate, you can make more informed, disciplined, and profitable trading decisions. It transforms your trading approach from gambling to a professional strategy. This knowledge is essential for anyone serious about making consistent profits in the financial markets

FMCG & ConsumptionThink about your daily life — the toothpaste you use, the biscuits you eat, the shampoo you prefer, the tea you drink, the food delivery app you order from. Every one of these touches a part of the FMCG & consumption sector.
Now multiply that by 1.4 billion Indians, and you realize the size of this engine.
In 2025, the FMCG (Fast-Moving Consumer Goods) and consumption-driven stocks are at the center of a powerful story — one shaped by:
India's rising middle class
Rural income revival
Urban premiumization
Growth of e-commerce and quick commerce
Digital payments & new-age D2C (Direct-to-Consumer) brands
This isn't just a theme — it's a structural growth trend that never goes out of fashion.
Let’s break it down step-by-step.
🧼 What is FMCG & Consumption Sector?
FMCG stands for Fast-Moving Consumer Goods. These are everyday products people buy frequently:
Food & beverages (biscuits, noodles, soft drinks, snacks)
Personal care (soap, shampoo, deodorant)
Household items (detergent, floor cleaner, toothpaste)
Over-the-counter (OTC) products (balms, cough syrup, nutrition)
The Consumption theme expands on this to include:
Retail (organized & unorganized)
Quick commerce (Blinkit, Zepto)
E-commerce (Amazon, Flipkart, Nykaa)
Food delivery (Zomato, Swiggy)
Apparel & footwear (Trent, Aditya Birla Fashion)
Durables & electronics (TVs, fridges, fans, phones)
So whether it’s Maggi or Myntra, Parle-G or Paytm Mall — it all fits under Consumption.
🔥 Why FMCG & Consumption Is Trending in 2025
Let’s look at what’s driving this sector today:
1️⃣ Rural Demand Is Rebounding
After 2 years of low rural growth due to inflation and erratic monsoons, 2025 has brought strong crop output, stable agri prices, and more cash in hand.
Rural India forms over 40% of FMCG consumption, especially:
Entry-level soaps, snacks, tea
Sachet products
Local brands
Companies like Dabur, HUL, Marico, and Emami have all confirmed rural growth is picking up fast.
2️⃣ Premium Urban Consumption Is Booming
At the same time, India’s cities are upgrading:
Tier-2 cities now demand premium face creams, health foods, organic juices
Young consumers are choosing branded wear, subscription boxes, and gourmet snacks
Working women are driving personal care product sales
Urban India is moving from price to value, and that’s a goldmine for consumer brands.
3️⃣ Quick Commerce Is Changing Habits
Apps like Blinkit, Zepto, Swiggy Instamart are:
Delivering goods in 10–20 minutes
Creating new demand cycles (midnight snacking, impulse buys)
Becoming a new channel for FMCG sales
For FMCG companies, this means higher turnover and visibility, especially for smaller SKUs (sachets, ₹5/₹10 packs).
4️⃣ Direct-to-Consumer (D2C) Boom
New-age startups like:
Mamaearth (beauty, baby care)
WOW Skin Science (natural shampoos)
BoAt (audio & smart accessories)
Licious (fresh meats)
…are bypassing traditional stores and selling directly online.
This model:
Cuts middlemen
Boosts margins
Creates brand intimacy
And now many of these brands are listed or IPO-ready, adding fire to the consumption story.
5️⃣ China+1 & Make in India Push
Many global companies now manufacture in India, not China:
Personal care
Cosmetics
Packaged foods
This reduces costs, improves supply chains, and boosts exports of Indian FMCG brands too.
📈 Stock Market Performance (2023–2025)
Let’s take a look at how some top names have performed:
Stock Jan 2023 Price July 2025 Price Return
ITC ₹340 ₹460+ 35%
Hindustan Unilever ₹2,500 ₹2,800+ 12%
Dabur ₹550 ₹675+ 22%
Nestle India ₹18,000 ₹24,000+ 33%
Zomato ₹55 ₹195+ 250%+
Nykaa ₹120 ₹180+ 50%
Mamaearth (Honasa) ₹320 (IPO) ₹460+ 44%
Quick commerce, D2C and food delivery stocks have been top gainers.
Traditional FMCG majors are more slow & steady compounders.
🛒 Segments Inside FMCG & Consumption
Let’s divide this into sub-themes:
🍪 1. Packaged Foods & Beverages
Britannia (biscuits)
Nestle India (Maggi, chocolates)
Tata Consumer (tea, coffee, salt)
Varun Beverages (Pepsi bottling)
Bikaji, Prataap Snacks (local snacks)
🧼 2. Personal & Household Care
HUL (Dove, Surf Excel, Lifebuoy)
Dabur (Chyawanprash, Vatika)
Marico (Parachute, Saffola)
Godrej Consumer (Goodknight, Cinthol)
Emami (Fair & Handsome, Navratna)
🛍️ 3. Retail Chains & Apparel
Trent (Westside, Zudio)
V-Mart
Avenue Supermarts (D-Mart)
Aditya Birla Fashion (Pantaloons, Van Heusen)
Shoppers Stop
🍕 4. Online Food & Quick Commerce
Zomato
Jubilant Food (Domino’s)
Devyani International (KFC, Pizza Hut)
Zepto (IPO coming soon)
Blinkit (part of Zomato)
💄 5. Beauty & D2C Personal Care
Honasa (Mamaearth)
Nykaa
Lotus Herbals (Private)
WOW Skin Science (IPO Expected)
💡 Why Traders and Investors Love This Sector
✅ Always in Demand – Recession or boom, people still need soap and toothpaste.
✅ Strong Brand Power – Consumer loyalty = pricing power = margin stability.
✅ Low Capex Businesses – High return on capital, especially for asset-light D2C models.
✅ Growth via Premiumization – Indians are trading up from "cheap" to "value".
✅ Earnings Predictability – FMCG companies often beat or meet earnings estimates.
📊 How to Trade or Invest in This Theme
🎯 For Long-Term Investors:
Pick 3–4 companies across segments:
One traditional FMCG major (HUL, ITC)
One high-growth food player (Nestle, Varun Beverages)
One retail/delivery stock (Zomato, Trent)
One new-age D2C story (Mamaearth, Nykaa)
Hold for 3–5 years. These stocks are slow compounders with low risk + decent reward.
📉 For Traders:
Look for volume breakouts after consolidation
Track monthly updates on rural/urban growth
Trade around quarterly results and guidance
Use options strategy around earnings for volatility plays (like Zomato)
⚠️ Risks to Watch Out For
Risk Explanation
Inflation Pressure Higher input costs (milk, palm oil) hurt margins
Valuation Concerns Some D2C stocks may be overpriced
Competition from Local Players Especially in rural and Tier-3 cities
Dependency on Monsoon A weak monsoon can dent rural demand
🚀 The Road Ahead (2025–2030)
India is expected to:
Add 250 million middle-class consumers by 2030
See online retail double in size
Witness over 500 million people shop on mobile phones
Grow FMCG exports to Asia & Africa
The Indian consumption engine is just starting up. This isn't a temporary trend — it’s a secular, multi-decade opportunity.
✅ Conclusion
The FMCG & consumption story in India is:
Stable during slowdowns
Explosive during booms
Universal in reach — touching every home, city, and village
Now evolving rapidly with D2C, quick commerce, and premiumization
Whether you're an investor looking for consistent compounding or a trader looking for smart momentum plays, this is one of the most powerful sectors to focus on in 2025 and beyond

Difference Between Technical Analysis and Option Chain Analysis✅ 1. What is Technical Analysis?
Technical Analysis (TA) is the art and science of predicting future price movements based on historical price and volume data.
It’s like checking a stock’s past behavior on a chart to guess what it might do next.
🧠 How Does It Work?
Uses charts (candlestick, line, bar)
Studies patterns (head and shoulders, cup & handle, flags, etc.)
Applies indicators (RSI, MACD, Moving Averages, Bollinger Bands)
Identifies support & resistance levels
Helps time entry and exit points
📊 What Does It Tell You?
Is the stock trending up or down?
Is it overbought or oversold?
Where are strong support/resistance zones?
Is a breakout or breakdown happening?
🧰 Tools Used in Technical Analysis:
TradingView, Chartink, Zerodha Kite, Upstox Pro, etc.
Indicators: RSI, MACD, EMA, VWAP, Supertrend
Patterns: Breakout, Double Top, Flag Pattern, etc.
✅ 2. What is Option Chain Analysis?
Option Chain Analysis is specific to derivatives trading. It looks at open interest (OI), premiums, and strike prices to understand what option traders are betting on.
It helps you decode the behavior of big players (institutions) in the options market — especially on indices like Nifty, Bank Nifty or liquid stocks like Reliance, HDFC Bank, etc.
🧠 How Does It Work?
An option chain shows all available strike prices and their:
Call (CE) and Put (PE) premiums
Open Interest (OI) — how many contracts are outstanding
Changes in OI — fresh buying/selling activity
Volume traded
Implied Volatility (IV) — market’s expectations of volatility
📊 What Does It Tell You?
Where is the market expecting resistance? (High Call OI = resistance)
Where is the market expecting support? (High Put OI = support)
What are option writers (big players) doing?
Is the market bullish, bearish, or neutral?
🧰 Tools Used in Option Chain Analysis:
NSE Website (Option Chain)
Sensibull, Opstra, QuantsApp, StockMock
Open Interest Analysis Tools
PCR (Put Call Ratio)
Max Pain Theory
⚖️ Key Differences: Technical Analysis vs Option Chain Analysis
Feature Technical Analysis Option Chain Analysis
Used For Any stock, index, or crypto Only in derivatives (Options)
Data Based On Price, volume, chart patterns OI, strike prices, premiums, IV
Who Uses It? All traders (equity, F&O, forex, crypto) Mostly F&O traders and option
Time Horizon Intraday to long-term Intraday to expiry-based
📌 Practical Example (Nifty)
🔍 Technical View:
Nifty is making higher highs, higher lows
RSI = 60 → Momentum is still strong
20 EMA is acting as support
➡️ Suggests bullish trend — buy on dips
📈 Option Chain View:
Highest Call OI at 24,000 → Strong resistance
Highest Put OI at 23,500 → Strong support
Put writing increasing at 23,600 → Bulls defending this level
➡️ Suggests market may stay between 23,500–24,000
🎯 When to Use Which?
Situation Use This
Want to analyze a stock's trend Technical Analysis
Trading non-derivativ e stocks Technical Analysis
Intraday scalping Both (TA + OI levels)
Trading Nifty/Bank Nifty Options Option Chain Analysis
Looking for expiry range predictions Option Chain
Want to confirm breakout strength Combine both!
💡 Best Strategy: Combine Both!
Professional traders don’t treat these as either-or.
They often use:
📉 Technical analysis to find chart setups
🧠 Option chain data to confirm big player positions
Example:
A breakout on chart + strong Put OI at breakout level = high-probability trade.
✅ Summary
Aspect Technical Analysis Option Chain Analysis
Based on Charts, price, volume OI, premiums, strike data
Used for All trading instruments Only options
Helps in Timing trades, spotting patterns Predicting expiry range
Tools RSI, MACD, Patterns, EMAs OI, IV, Max Pain, PCR
Users Retail + institutional traders Mainly option traders, F&O players
🚀 Final Thought
Both tools are powerful in their own right. But when used together, they give you a 360° edge in the markets.
Technical analysis shows you what's happening on the chart.
Option chain analysis shows you what traders expect to happen behind the scenes.
Mastering both is the true trader’s advantage
Define Option Chain✅ Definition of Option Chain (Explained Simply)
An Option Chain is a table or list that shows all available option contracts (Calls and Puts) for a particular stock or index — along with key data like strike prices, premiums, open interest, and more.
It helps option traders quickly analyze where the market expects the stock or index to move, reverse, or stay range-bound.
📘 In Simple Terms:
An option chain is like a scoreboard of what traders are betting on — whether prices will go up or down, and at what level.
🧩 What Does an Option Chain Show?
An option chain is divided into two parts:
Call Options (CE) 🔵Strike Price Put Options (PE) 🔴
Each row in the option chain represents:
A specific strike price
Its call and put premiums
Open interest (OI) — number of contracts open
Change in OI — fresh buying/selling activity
Volume — how many contracts traded
Implied Volatility (IV) — market’s expected volatility
🧠 Key Terms in Option Chain (Explained Simply)
Term Meaning in Easy Words
Strike Price The price at which you can buy/sell the underlying asset
Call Option (CE) Bets the price will go up
Put Option (PE) Bets the price will go down
Premium The price you pay for buying 1 option
Open Interest (OI) How many contracts are currently open
Change in OI How many contracts were added or closed today
Volume Number of contracts traded today
IV (Implied Volatility) Market’s prediction of future price fluctuation
📊 What You Can Learn From It:
Where traders expect support (high Put OI zones)
Where traders expect resistance (high Call OI zones)
Which strikes are seeing new buying/selling activity
Possible expiry range (Max Pain level)
📍 Example (Bank Nifty Option Chain Sample):
CE (Call Options) Strike PE (Put Options)
OI: 5.2 lakh 49,000 OI: 6.1 lakh
OI: 8.4 lakh 🟩 49,500 OI: 10.3 lakh 🟥
OI: 12.1 lakh ✅ 50,000 OI: 9.5 lakh
✅ Highest Call OI = 50,000 → Resistance
✅ Highest Put OI = 49,500 → Support
➡️ So, market may stay between 49,500 and 50,000 for now
🧠 Why Option Chain Matters for Traders:
Helps spot support/resistance without charts
Identifies where big institutions are writing options
Assists in building option strategies (like Iron Condor, Straddles)
Key for expiry day (Thursday) trades
✅ Summary:
Option Chain Is... Option Chain Helps You...
A table of all calls & puts Find support & resistance from OI levels
Loaded with strike-wise data See where traders are buying/selling most
Used in options trading Predict expiry range & big player activity

What is FII and DII✅ What is FII and DII?
These are two major types of investors who invest huge amounts of money in the Indian stock market.
Acronym Full Form Meaning
FII Foreign Institutional Investor Big investors from outside India
DII Domestic Institutional Investor Big investors within India
🧠 Let’s Understand Them One by One:
🔵 FII – Foreign Institutional Investor
These are large investment firms, hedge funds, mutual funds, pension funds, insurance companies, etc. from outside India.
They invest in Indian equity markets, debt markets, bonds, etc.
Registered with SEBI to invest in Indian markets
📌 Examples:
Morgan Stanley
BlackRock
Goldman Sachs
Vanguard
JP Morgan Asset Management
🎯 Why They Invest in India?
Growth opportunity in Indian economy
Higher returns compared to developed markets
Long-term story of India = bullish
🔥 When FII inflow increases:
Nifty, Sensex, Bank Nifty usually go up
Especially impacts large-cap stocks (Reliance, HDFC, ICICI Bank)
🔴 DII – Domestic Institutional Investor
These are big Indian institutions that invest in Indian markets.
Includes:
Mutual Funds (like SBI MF, ICICI Pru MF)
Insurance companies (LIC, HDFC Life)
Banks (SBI, HDFC Bank treasury)
Pension funds (EPFO)
📌 They manage common people's money, and invest in:
Equity (stocks)
Debt (bonds, government securities)
🎯 Why DIIs Matter?
Provide stability to markets
When FIIs sell, DIIs often support the market by buying
📊 FII vs DII - Key Differences
Factor FII DII
Based I Foreign Countries India
Regulated By SEBI SEBI
Invest In Equity, Bonds, Derivatives Equity, Bonds, Mutual Funds
Impact On Market Highly volatile, quick to enter/exit More stable, long-term investing
Popular Examples BlackRock, JP Morgan, Nomura LIC, SBI Mutual Fund, ICICI Pru MF
🧭 Why Traders Watch FII/DII Data Daily
📈 FII/DII Activity Shows Market Mood
When FIIs are buying, markets often trend up
When FIIs are selling, markets can become volatile
When DIIs are buying, they may be supporting the market
Example:
"FII bought ₹2,500 Cr, DII sold ₹500 Cr"
→ Strong bullish sign, smart money is entering
🔄 What Happens When FIIs Sell and DIIs Buy?
FIIs sell during global tension or USD strength (they pull out money)
DIIs buy at dips to average out long-term positions
This creates volatility but also buying opportunities
🧠 Final Thoughts
FII = Foreign money → fast movers, sensitive to global news
DII = Indian money → stable investors, long-term focused
Daily FII/DII data tells us where smart money is flowing
📌 Smart traders always check FII/DII data before taking major trades — especially in Nifty, Bank Nifty, Reliance, Infosys, HDFC twins
KOTAKBANK 1D TimeframeWhy KOTAKBANK?
Kotak Mahindra Bank is one of India’s most reputed private banks. It’s known for its conservative lending practices, healthy balance sheet, and strong retail plus corporate banking mix. Over the past few quarters, the bank has focused on digital transformation, stable asset quality, and maintaining margins despite rising interest rate pressures. Because of this, it’s always on the radar of long-term investors.
Now in 2025, with the financial sector showing resilience, KotakBank is gaining attention again—especially among those looking to buy on dips or add during consolidation phases.
✅ Current Price Range
As of mid-July 2025, KotakBank is trading near ₹2,185–₹2,190.
On the 1-day chart, it is showing signs of sideways consolidation with support at lower levels and limited upside pressure—this is perfect for long-term accumulation.
🔍 Key Investment Levels (Support & Resistance)
Let’s break it down into zones:
🟩 Support Zones (Ideal Buy Areas)
These are the levels where buyers often enter and prices tend to bounce back.
₹2,160 – ₹2,175
→ This is your first buy zone. It’s a cushion where the price may fall and stabilize before heading back up. Great for small quantity entry.
₹2,140 – ₹2,154
→ A stronger support zone. If the stock dips further, this is where serious long-term buyers often start accumulating. This level has held up multiple times in the past few months.
₹2,125 – ₹2,130
→ This is the last major support level on the daily timeframe. If the price falls below this zone, it might signal short-term weakness, and one should be cautious or wait for stability.
🟥 Resistance Zones (Profit Booking Areas)
These are levels where the stock might face selling pressure, especially short-term traders looking to book profits.
₹2,194 – ₹2,196
→ This is the first resistance area. If you’re already holding from lower levels, consider partial profit booking here.
₹2,209 – ₹2,228
→ A stronger resistance zone. This has acted as a ceiling for the stock recently. If KotakBank closes above this with strong volume, it may break out for fresh highs.
Above ₹2,228
→ If the stock closes above this level on the daily chart, it could start a new rally towards ₹2,260–₹2,300 zone. This level becomes a breakout confirmation point.
🧠 How to Use These Levels (Simple Plan)
🟢 If You’re a Long-Term Investor:
Start buying small quantities if KotakBank dips to ₹2,160–₹2,175.
Add more at ₹2,140–₹2,154 only if market sentiment remains stable.
Stop-loss: If price goes below ₹2,125 and stays there, pause further buying. It may need time to consolidate.
🔵 If You Already Hold the Stock:
Watch for price to approach ₹2,194–₹2,228.
Book partial profits if you’re short-term focused.
If it breaks above ₹2,228, consider holding more or adding for the breakout rally.
Keep trailing your stop-loss upward as the price moves.
📈 Price Behavior (Technical Summary)
Trend: Currently neutral to slightly bullish.
Volume: Not too aggressive, but steady—shows strong hands are holding.
Momentum: RSI (Relative Strength Index) near 50–55 zone on daily timeframe; neither overbought nor oversold.
Volatility: Controlled; perfect for accumulation, not short-term speculation.
📝 Final Thoughts – Human Summary
KotakBank is not in a breakout mode right now, but it’s forming a base.
If you’re a long-term investor, this is the kind of setup you wait for: clear supports, low volatility, and no hype.
The ₹2,140–₹2,175 area is your opportunity zone.
Just make sure to manage your risk below ₹2,125 and don’t go all-in at once. Gradual accumulation works best in these setups.
If it breaks ₹2,228, get ready for action. That’s your green signal for the next rally

BANKNIFTY 1D TimeframeCurrent Context
The index is trading near 56,900 – 57,000. Overbought signals have appeared but the overall trend remains bullish to neutral
🔄 Classic Pivot Points for Bank Nifty (Today)
Level Value Description
R1 57,323.5 First resistance—sell/reduce on strength
Pivot 57,180.7 Central bias: above = bullish, below = cautious
S1 57,070.75 First support—gentle dip-buy zone
S2 56,927.95 Deeper support—stronger buy zone
S3 56,818 Last buffer before bearish risk increases
🛡️ Support Zones (Where Buyers Typically Step In)
₹57,070 – ₹57,080 (S1): Good for light entries on dips
₹56,930 – ₹56,940 (S2): Solid zone to add more
₹56,818 (S3): Final defense—watch carefully for breakdown risk
🚧 Resistance Levels (Where Profit Booking May Kick In)
₹57,323 (R1): Near-term ceiling—consider booking profit
Above ₹57,323 with follow-through: Momentum may push toward R2 (~57,600–57,700)
🎯 Simple Strategy Guide
✅ If You’re Holding:
Stay invested while above 57,070.
Consider trimming near 57,320–57,400, especially if signs of overbought persist.
🟢 Looking to Buy the Dip?
Start buying at dips to 57,070–57,080 (S1).
Add more near 56,930–56,940 (S2) if momentum stays healthy.
🔵 Breakout Play:
A clean close above 57,323 with volume could open momentum to 57,600–57,700.
You can add post-breakout with confidence.
🛑 Risk Control:
If Bank Nifty closes below 56,818 (S3), reel in exposure—market direction may turn uncertain.
🧭 Quick Snapshot
Support: 57,070 → 56,930 → 56,818
Resistance: 57,323 → 57,600+ on breakout
Action Zones:
Buy zones: 57,070 / 56,930
Book profits: ~57,323
Add on breakout: above 57,323
🧠 Why Use These Levels?
Pivot-based zones are widely used by traders and algos, acting as natural turning points in daily price action
. Combining them with observed overbought conditions gives you a structured approach: buy smart, book gains, and manage risk effectively.

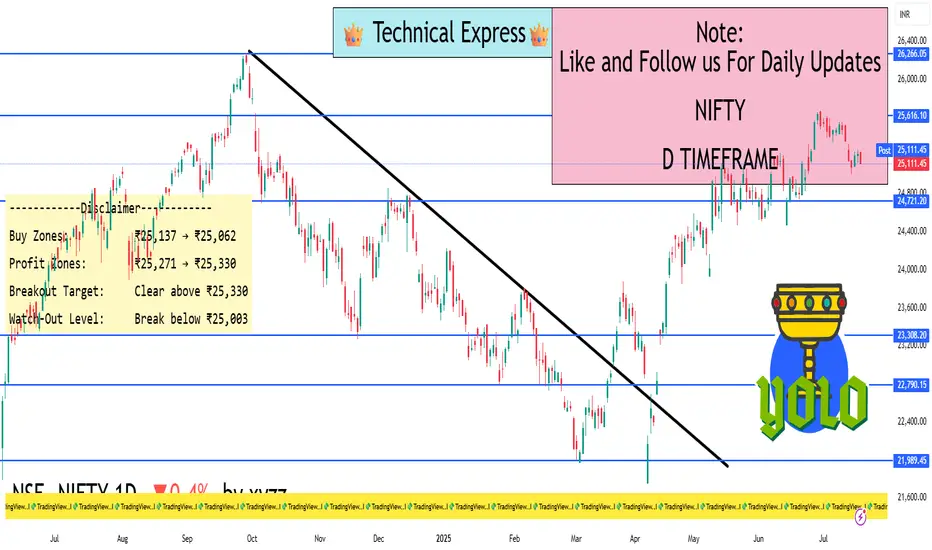
NIFTY 1D TimeframeToday’s Pivot Levels & Zones
(Data sourced from Moneycontrol – based on previous day’s trading range)
Level Type Price (₹)
Pivot Point 25,196
Resistance 1 (R1) 25,271
Resistance 2 (R2) 25,330
Resistance 3 (R3) 25,405
Support 1 (S1) 25,137
Support 2 (S2) 25,062
Support 3 (S3) 25,003
🛡️ Support Levels (Potential Buy Zones)
₹25,137 (S1) – The first support level where buying interest usually emerges during mild pullbacks.
₹25,062 (S2) – A deeper support and safer buying zone if the dip extends.
₹25,003 (S3) – Significant support; break below this may signal deeper correction.
🚧 Resistance Levels (Exit or Caution Zones)
₹25,271 (R1) – Immediate ceiling where profit-taking could occur.
₹25,330 (R2) – Next hurdle; a daily close above this could spark a bullish breakout.
₹25,405 (R3) – Major resistance; a strong move past this would pave the way for higher targets.
✅ How to Trade or Invest Based on These Levels
🔹 If You’re Already Holding
Stay invested while Nifty trades above ₹25,062 (S2).
Consider trimming positions around ₹25,271–25,330 on strength.
🟢 Looking to Buy on Dips?
Enter in tranches at S1 ₹25,137, and add more at S2 ₹25,062.
If Nifty drops toward S3 ₹25,003, you can accumulate more conservatively.
🔵 Planning for a Breakout?
A clean daily close above R2 (₹25,330) can be a signal to add strongly.
Post-breakout, the next target is R3 at ₹25,405.
🛑 Risk Management
If Nifty falls below ₹25,003 (S3), consider reducing exposure—trend bias may shift downward.
🎯 Quick Strategy Summary
Buy Zones: ₹25,137 → ₹25,062
Profit Zones: ₹25,271 → ₹25,330
Breakout Target: Clear above ₹25,330 → aim for ₹25,405
Watch-Out Level: Break below ₹25,003 → trend at risk
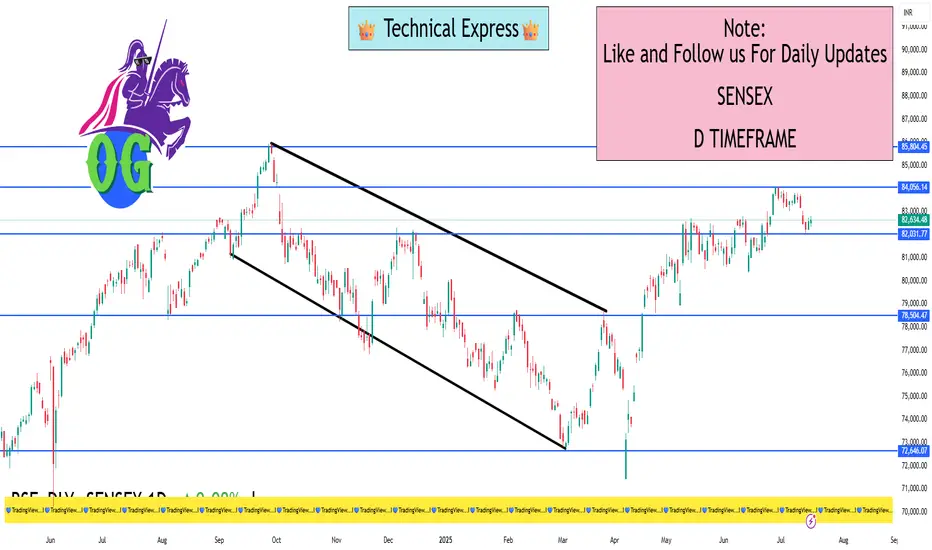
SENSEX 1D TimeframeCalculated Pivot Levels for Today
Classic Pivots:
Resistance 1 (R1): 82,831.8
Resistance 2 (R2): 83,029.2
Resistance 3 (R3): 83,273.7
Pivot Point (PP): 82,587.4
Support 1 (S1): 82,390.0
Support 2 (S2): 82,145.6
Support 3 (S3): 81,948.2
Fibonacci Pivots:
R1: 82,756.2
R2: 82,860.4
R3: 83,029.2
PP: 82,587.4
S1: 82,418.6
S2: 82,314.4
S3: 82,145.6
Camarilla Pivots:
R1: 82,675.0
R2: 82,715.5
R3: 82,756.0
PP: 82,587.4
S1: 82,594.0
S2: 82,553.5
S3: 82,513.0
📊 Why These Levels Matter
Pivot Point (PP) is the central reference — if Sensex trades above it, bias is bullish; below → bearish
Support Levels (S1–S3): potential zones to buy on dips.
Resistance Levels (R1–R3): profit-booking zones or areas where upside may pause.
🧭 How to Use This Today
✅ Trade Ideas
If Sensex stays above 82,587, the trend is positive — look to hold or buy dips.
Ideal dip buys:
Around 82,390–82,400 (S1) for gentle pullbacks.
82,145–82,150 (S2) for deeper retracement buyers.
🚀 Upside Strategy
Consider booking partial gains near 82,831–83,029 (R1–R2).
On breakout above 83,029, next target is 83,273–83,300 (R3).
🛑 Risk Control
If Sensex closes below 81,948 (S3), broader market risk rises — consider reducing exposure
Key Takeaway (Simple Terms)
Above 82,587? Trend remains upbeat — look for dip-buying opportunities.
Between S1 and PP (82,390–82,587)? Good entry zone for cautious buying.
Between R1 and R2 (82,831–83,029)? A likely profit-taking region—watch closely.
Breakouts above 83,029? Potential for new highs (up to R3).
Drop below S3 (81,948)? Consider tightening risk—market may shift downward

Tech & Digital Transformation (AI, Automation, EV)Introduction
We live in a time where machines can think, cars can drive themselves, and businesses are run by algorithms and automation. This isn’t a sci-fi movie — it’s happening now.
In 2025, the technology and digital transformation wave is in full swing in India. From Artificial Intelligence (AI) to robotic automation, and from electric vehicles (EVs) to cloud-based services, industries across the board are being reshaped.
This isn’t just about fancy tech buzzwords. It’s about:
Creating new businesses
Changing how old industries operate
Giving rise to new investment and trading opportunities
Let’s break down this major trend in a way that’s simple, clear, and real — so whether you’re a trader, investor, student, or entrepreneur, you’ll understand exactly what’s going on and how you can benefit.
🔍 What Is Digital Transformation?
Digital Transformation means using technology to make businesses smarter, faster, and more efficient.
For example:
A factory installs sensors and AI software to reduce waste
A hospital uses AI to detect diseases faster
A cab company replaces petrol cars with electric vehicles and uses an app to manage rides
It’s not just about using computers — it’s about rethinking how we do things using modern technology.
🚀 What’s Driving the Tech Transformation in 2025?
Let’s look at what’s fueling this massive shift:
✅ 1. Government Support & Policies
India’s government is pushing hard for:
AI adoption in governance, education, and healthcare
EV ecosystem with PLI schemes, subsidies, and charging infra
Digital India 2.0 for internet access, 5G, and digital services
This strong policy backing is giving tech companies the freedom to scale quickly.
✅ 2. Rise of Young Tech-Savvy Population
India has over 700 million internet users and a median age of 29. That means:
More digital consumption
More startups building tech products
More users adopting AI, EVs, and online services
✅ 3. Global Tech Trends Are Local Now
AI models like ChatGPT, MidJourney, and Copilot are being used in:
Schools
Small businesses
Customer service
Indian firms are localizing this tech — using it for regional languages, agriculture, finance, etc.
✅ 4. Corporate India Is Adopting Automation
From TCS to Tata Steel, companies are:
Automating HR, finance, supply chains
Using AI for predictive maintenance and demand forecasting
Adopting cloud computing for scale and security
This saves time, reduces cost, and improves profits — which markets love.
🧠 Let’s Dive Into 3 Key Areas
1️⃣ Artificial Intelligence (AI)
💡 What is AI?
AI is when machines are programmed to “think” like humans — they learn from data and make smart decisions.
Examples:
Google Maps finding fastest routes
YouTube recommending videos
Chatbots answering your bank queries
Indian AI Stocks to Watch
Tata Elxsi – AI in automotive, healthcare, media
Persistent Systems – AI in BFSI and digital transformation
Happiest Minds – AI-powered automation, analytics
LTTS (L&T Tech) – AI in industrial automation
Cyient DLM – Smart systems for defence and manufacturing
📈 Why AI Is a Hot Investment Theme
AI is not just a cost-saver — it creates entirely new business models
Global demand is exploding (even SMEs are adopting it)
India has rich data + cheap talent = AI leadership potential
2️⃣ Automation & Robotics
🤖 What is Automation?
Automation is when machines or software handle repetitive tasks without human help.
From factory robots to chatbots, automation is everywhere.
🏭 Where India Is Using Automation in 2025
Smart Factories: Robots assembling products, AI managing inventory
Warehousing: Amazon-style automated fulfillment
Banks: Robotic Process Automation (RPA) for account management, KYC
Transportation: Drones for delivery, automated traffic systems
🧑💼 Impact on Jobs & Skills
While some repetitive jobs may reduce, automation is creating new roles in:
Robotics management
AI training and supervision
Tech repair and integration
Data analytics
In short: Humans + Machines = Powerful combo
📊 Indian Automation Stocks to Watch
ABB India – Robotics & factory automation
Honeywell Automation – Process control tech
KPIT Tech – Automotive software automation
LTTS – Industrial and smart city automation
Tata Elxsi – Automation in EVs, healthcare, and rail
3️⃣ Electric Vehicles (EVs)
⚡ What are EVs?
EVs are vehicles powered by electric batteries instead of petrol/diesel.
They are:
Cleaner (no tailpipe emissions)
Cheaper to run (₹1/km vs ₹6/km for petrol)
Quieter and more efficient
🚗 Why India Is Going Electric in 2025
High petrol/diesel prices
Pollution control targets
Government incentives (FAME II, state subsidies)
Massive charging infra expansion
🏭 Companies Driving the EV Revolution
EV Manufacturers:
Tata Motors – India’s EV leader (Nexon EV, Tiago EV)
Mahindra & Mahindra – Born-EV architecture
Ola Electric – Two-wheelers and upcoming EV cars
Battery & Charging:
Exide Industries
Amara Raja Energy
Servotech Power
HBL Power Systems
Ancillary (parts, controllers, software):
Sona Comstar
Samvardhana Motherson
Electra EV (private)
📈 EV Investment Trend
Investors are eyeing battery tech, charging infra, and lightweight materials
Many EV stocks are already multi-baggers
PLI Scheme for battery storage and EV parts = big boost
📊 Performance Snapshot: Tech & Digital Leaders (Jan 2023 – July 2025)
Stock Jan 2023 Price July 2025 Price Approx. Gain
Tata Elxsi ₹6,500 ₹10,200 57%+
LTTS ₹3,800 ₹6,200 63%+
KPIT Tech ₹750 ₹1,560 108%+
Persistent Systems ₹4,000 ₹6,850 71%+
Servotech Power ₹45 ₹210+ 360%+
Tata Motors ₹400 ₹950+ 130%+
🧭 The Bigger Picture: Digital India 2.0
The Indian government is pushing:
5G/6G rollout
Smart city automation
AI in governance
Digital healthcare
Universal EV adoption by 2030
All of this means huge tailwinds for technology companies, startups, and R&D investments.
✅ Final Thoughts
The Tech & Digital Transformation theme in 2025 is not a bubble — it’s a fundamental shift in how India works, moves, learns, and grows.
AI is no longer future tech — it’s today’s business driver.
Automation is making Indian industries globally competitive.
EVs are no longer a dream — they’re on every city road.
This megatrend is not going away anytime soon. Whether you’re an investor, trader, or entrepreneur, now is the time to understand, explore, and ride the digital wave

Power & Utilities in 2025 Introduction: Why Power & Utilities Are Buzzing in 2025
Imagine running a growing city — there are electric buses on the roads, factories running 24/7, smart homes everywhere, and electric cars being charged in every neighborhood. Behind all of this is one invisible but powerful engine: electricity.
In 2025, India's power and utility sector is not just surviving — it is booming, evolving, and attracting massive investor interest. Whether it’s traditional power giants like NTPC or new-age energy plays like Tata Power and Servotech, this space is heating up because:
Power demand is at an all-time high
Government support is stronger than ever
Clean energy goals are transforming old players
The PLI scheme (Production Linked Incentive) is pushing domestic manufacturing
This is not just another sectoral rally — it's a structural shift. Let’s explore what’s driving this change and what it means for traders and investors in simple language.
🔌 What Is the Power & Utilities Sector?
The power and utilities sector includes companies that:
Generate electricity (thermal, hydro, solar, wind, nuclear)
Transmit and distribute it to homes, businesses, and factories
Make components like transformers, wires, batteries, solar modules
Operate infrastructure like smart grids, substations, power lines
These are the companies that light up India, literally.
Traditionally, this sector was slow-moving and PSU-dominated. But now, with renewables, EV charging, energy storage, and smart grids, it’s become a major growth story.
🌟 What’s Driving the Power Sector Boom in 2025?
Let’s break this into 6 easy-to-understand points:
✅ 1. Exploding Electricity Demand
India’s electricity demand is growing at 8–10% annually, faster than any major economy. Why?
Urbanization
More factories and data centers
EV charging needs
Heatwaves and air conditioners
Rural electrification
In short: More people + more machines = more electricity needed
✅ 2. Government Push for Renewable Energy
India is aiming for 500 GW of non-fossil fuel energy by 2030. This means huge support for:
Solar
Wind
Hydropower
Green hydrogen
Big players like NTPC, Adani Green, Tata Power, and ReNew Power are investing billions in clean energy. The budget also offers tax breaks, low-interest loans, and faster clearances.
✅ 3. PLI Scheme: Game-Changer for Power Equipment
PLI (Production Linked Incentive) is a government scheme that gives incentives to manufacturers based on their output.
In the power sector, PLI is being used for:
Solar panel/module manufacturing
Advanced battery storage
EV charging infrastructure
Smart meters and grid tech
This means companies making power equipment within India get rewarded — boosting domestic manufacturing and exports.
Examples of PLI Winners:
Tata Power Solar
Waaree Energies
Servotech Power
Amara Raja Energy
Exide Industries (battery PLI)
✅ 4. Modernization of Grid & Infrastructure
India’s power infrastructure is being upgraded and digitized.
Smart meters replacing old meters
Smart grids to manage load more efficiently
Underground cables, better transmission
PSUs like Power Grid Corporation, REC Ltd, and NHPC are leading this transformation. These upgrades improve efficiency, reduce loss, and bring more reliability.
✅ 5. EV Revolution = New Opportunity
Electric vehicles are the future. Every EV needs:
A charging station
Stable power supply
Smart grid support
So companies setting up EV charging infra (like Servotech, Tata Power, NTPC) are seeing new business models emerge. This link between mobility and energy is a major opportunity.
✅ 6. Private + PSU Partnership Model
Unlike the past, today’s power ecosystem sees collaboration between private players and PSUs. For example:
NTPC and Indian Oil working on hydrogen
Tata Power partnering with states for solar rooftops
Servotech tying up with PSUs for EV charging
This reduces risk, increases scale, and boosts trust for investors.How to Understand Different Power Stocks
🔌 Generation Stocks:
These companies produce electricity.
NTPC (thermal + renewable)
NHPC (hydropower)
SJVN (solar, hydro)
Adani Green (solar, wind)
⚡ Transmission & Distribution Stocks:
They carry electricity from plants to homes/factories.
Power Grid Corporation
Torrent Power
Tata Power
🔋 Equipment & Infra Stocks:
They make batteries, inverters, smart meters, charging stations
Servotech Power
Amara Raja Energy
Exide Industries
Hitachi Energy India
📈 Trading Strategies for Power Stocks
🛠️ For Swing Traders:
Watch for breakouts from consolidation patterns
Use indicators like volume + RSI divergence for entry
Example: Servotech consolidates for 3–5 days → breakout candle + high volume = entry
💼 For Long-Term Investors:
Pick companies with:
Consistent revenue/profit growth
Low debt
Green energy roadmap
SIP into leaders like NTPC, Tata Power, Power Grid
🔁 For Momentum Traders:
Use sector rotation charts (Nifty Energy Index)
Trade around policy news, budget updates, energy shortages, or global oil price moves
Outlook for 2025–2030
India’s power sector is not just about keeping lights on anymore. It’s about:
Powering a digital, electric, and green economy
Becoming a global energy exporter
Creating jobs and wealth through Make in India
Here’s what we can expect in coming years:
Massive growth in battery storage capacity
Rooftop solar + net metering in most cities
Hydrogen-based vehicles and fuel stations
India becoming a solar module export hub
In simple words: The power sector of tomorrow is smart, clean, connected — and investable.
✅ Final Thoughts
The Power & Utilities sector in 2025 is at a tipping point — supported by government policy, modern tech, global ESG demand, and rising consumption. It’s no longer “boring” or “slow.”
Whether it’s green energy leaders like Tata Power, efficient PSUs like NTPC, or disruptors like Servotech — this space is full of opportunity
IPO & SME Buzz📈 Why Are IPOs Booming in 2025?
Let’s understand what’s fuelling this mega wave:
✅ 1. Strong Market Sentiment
Both Nifty and Sensex are near all-time highs
Retail, FII, and mutual fund participation is rising
This bullishness is driving interest in new listings
✅ 2. Favorable Regulatory Environment
SEBI has streamlined IPO processes
Faster listing timelines (T+3 now), better SME disclosures
Attracting more genuine companies to go public
✅ 3. Retail Investor Explosion
Retail investors have grown from 4 crore to 12 crore+ in 3 years
Most IPOs are oversubscribed in the retail segment
Apps like Zerodha, Groww, Upstox have made IPO investing super easy
✅ 4. SMEs Want Capital + Visibility
SMEs are looking to raise capital for expansion, not just survival
Going public builds brand trust, creditworthiness, and long-term valuation
Also helps in professionalizing business operations
✅ 5. High Listing Gains = FOMO
Many IPOs (especially SME) are opening with 100%–500% premiums
This creates a rush — people apply hoping for quick profits
🚀 SME IPOs: The Real Game Changer
What is an SME IPO?
SME IPOs are for smaller companies (typically with ₹10–250 crore market cap), listed on:
NSE Emerge
BSE SME
These platforms are designed for high-growth businesses in manufacturing, IT, textiles, agriculture, infra, and other emerging sectors.
Why are SME IPOs buzzing?
Low valuation entries (IPO price ₹10–₹150 range)
Limited retail quota (35%) = quick oversubscription
Thin float (less available shares) = strong price movement
High retail interest, often driven by buzz on social media and brokers
Pros of SME IPOs:
Multibagger potential
Early entry into high-growth businesses
Often undervalued compared to mainboard peers
Cons of SME IPOs:
Low liquidity post-listing
Price volatility is high
Promoter quality needs deeper due diligence
Some may be “pump and dump” type plays
🧠 Should You Apply for IPOs?
Here’s how to decide whether an IPO is worth applying to:
🔍 Key Factors to Consider
Company Fundamentals
Revenue, profit trend, debt levels, ROE, margins
Business model — is it scalable?
Promoter Background
Are promoters credible? Any fraud history?
Prior experience and educational background
Valuation
Is it overvalued compared to listed peers?
Use P/E, P/B, EV/EBITDA ratios
IPO Objectives
Is the money being used for business growth?
Or just for promoter exit?
Grey Market Premium (GMP)
While unofficial, GMP shows listing expectations
Be cautious though — GMPs can be manipulated
🧾 How to Apply for an IPO (Step-by-Step)
🛠️ Through UPI-enabled Broker Apps (Zerodha, Groww, etc.)
Go to IPO section
Select IPO > Enter lot size (1 lot = 100 shares typically)
Enter UPI ID > Submit
Accept mandate in UPI app (PhonePe/Google Pay)
Wait for allotment (T+3 now, earlier T+6)
💡 Pro Tip:
Use multiple demat accounts (self, spouse, family) to increase allotment chances in oversubscribed issues.
🧾 What if You Don’t Get Allotment?
Don’t worry! You can:
Buy from listing day (at open or on dips)
Track stocks for post-IPO corrections (good entries happen 1–3 months later)
Use SME listing trends to plan swing trades
📊 Technical Strategy for IPO Traders
Gap Up Listings: Wait 5–15 mins post open → enter on pullback or breakout
F&O stocks: Use option straddle/strangle around listing day for volatility
SME IPOs: Watch for delivery volume, UC/LC hits, and media chatter
🧭 What’s Next for IPOs in 2025?
The pipeline remains very strong.
Upcoming Big IPOs:
PharmEasy (health tech)
Ola Electric (EV leader)
MobiKwik (fintech)
Navi Finserv (Sachin Bansal-backed)
Snapdeal (retail comeback)
Also, dozens of SMEs across states like Gujarat, Maharashtra, Rajasthan are planning listings in Q3–Q4 2025.
SEBI is also working to merge SME IPOs to mainboard faster, which could give early investors big rewards.
✍️ Final Thoughts
The IPO and SME buzz in 2025 is not just hype — it’s a real wealth-building opportunity for informed investors.
Yes, some IPOs are risky.
Yes, some are overhyped.
But the ones with good businesses, honest promoters, and solid demand are delivering massive returns.
This trend is part of a larger India story — where startups, manufacturers, tech firms, and SMEs are finally getting the capital and visibility they deserve
Sensex 1D Timeframe✅ On Dips: Consider buying near ₹82,280–₹82,310 (S1) or deeper at ₹81,990–₹82,020 (S2) if broader markets soften.
🔼 On Rallies: Think about partial profit-taking near ₹82,800–₹82,830 (R1).
🚀 Breakout Strategy: A daily close above ₹83,030–₹83,060 (R2) could lead to a move toward ₹83,325–₹83,360 (R3), and potentially retest the all-time highs (~₹85,978)
🚫 If Breakdown Occurs: A drop below ₹81,758–₹81,800 (S3) may shift the trend to bearish—time to consider reducing exposure.
Simple Action Plan
Buy-on-Dip Zones: ₹82,280–₹82,310; deeper: ₹81,990–₹82,020
Take Profits / Caution: ₹82,800–₹82,830
Breakout Trigger: ₹83,030–₹83,060 close → target ~₹83,325–₹83,360
Trend Alert (Bearish): Below ₹81,758
BankNifty 1D TimeframeLatest Index Level: ~57,178
Recent Range: 56,940 – 57,276
Trend: Bullish overall, but momentarily facing consolidation/overbought signals
🛡️ Key Support Levels
Support 1 (S1): 56,765 – 56,807
First cushion on pullbacks; intraday dips often find buyers here
Support 2 (S2): 56,522 – 56,666
Deeper support; a solid safety zone in case of broader market weakness
Support 3 (S3): 56,494 – 56,494 (approx)
Critical pivot pad—crossing below may trigger deeper correction
Lower Buffer: 56,100 – 56,000
Strong area noted by multiple reports as base zone for deeper dip

KOTAKBANK 1D TimeframeHow You Can Use These Levels
On Dips
Buy first around ₹2,168–₹2,170
If market softens, look to ₹2,149–₹2,150
For long-term entries, accumulate near ₹2,117–₹2,120
On Rallies
Consider partial portfolio blackening near ₹2,220–₹2,225
If it clears ₹2,252, additional gains may follow → consider selling gains near ₹2,272
Breakout/Bearish Triggers
A close below ₹2,117 signals potential short-term downtrend
A breakout above ₹2,272 with strong volume opens the path to higher highs
✅ Bottom Line (in simple terms)
Buy dips around ₹2,168, with stronger buying near ₹2,149 and ₹2,117.
Take profits roughly between ₹2,220–₹2,252.
If resistance breaks with conviction, expect more upside.
Conversely, if it drops below ₹2,117, be cautious.

Institutional Objectives in Options TradingWhy Do Institutions Trade Options?
Institutions such as hedge funds, banks, mutual funds, and insurance companies trade options not to “hit it big,” but to:
Protect capital
Generate consistent income
Reduce portfolio risk
Hedge exposure
Speculate with calculated risk
They use options as a tool, not a shortcut.
🎯 Key Institutional Objectives in Options Trading
1. Portfolio Hedging
Institutions use put options to hedge large equity portfolios. If the market drops, the puts increase in value, helping offset losses in their stock holdings. This is like buying insurance — they sacrifice a small premium to avoid larger losses.
Example:
A mutual fund holding ₹100 crores in Nifty stocks might buy at-the-money puts on Nifty to protect against market crashes.
2. Risk Management & Exposure Control
Institutions manage their exposure to volatility, direction, and time decay using the Greeks (Delta, Gamma, Theta, Vega). They dynamically adjust their positions to stay delta-neutral or reduce gamma risk, maintaining stable portfolios under different market conditions.
They don’t just bet — they engineer their risk.
3. Premium Collection Strategies
Big players often sell options — not buy them — to earn steady income. Strategies like:
Covered Calls
Iron Condors
Credit Spreads
Calendar Spreads
allow them to profit from time decay (Theta) and implied volatility drops, especially in range-bound markets.
Example:
An institution expecting low volatility might sell both calls and puts (straddle or strangle) and pocket the premium as long as the market stays quiet.
4. Arbitrage and Market-Making
Institutions engage in option arbitrage, exploiting price inefficiencies between spot, futures, and options. They also act as market makers, providing liquidity and earning from bid-ask spreads while balancing risk using delta hedging.
This is a low-risk, high-volume business built on speed, data, and precision.
5. Speculation with Defined Risk
When institutions do speculate, they often use options to limit downside risk. For example, they may buy calls to play an upside breakout — knowing their maximum loss is limited to the premium paid.
They might also take advantage of event-driven trades like earnings, elections, or economic reports using option straddles or strangles — managing risk while targeting large moves.
✅ Why It Matters for Retail Traders
By understanding institutional objectives, you can:
Avoid emotional trades
Learn how to trade like professionals
Focus on capital preservation and risk-adjusted returns
Develop long-term strategies based on logic, not luck
📈 Final Thought
Institutions don’t gamble — they plan, hedge, and execute with precision. Learning their objectives in options trading will help you shift your mindset, adopt safer strategies, and build consistent, professional-level performance in the market.

RIDE THE BIG MOVESWhat Does “Ride the Big Moves” Mean?
It means:
✅ Spotting a strong directional move early
✅ Entering with confirmation and confidence
✅ Managing your risk while maximizing reward
✅ Staying in the trade through minor pullbacks
✅ Exiting smartly at a major trend exhaustion point
Most traders cut winners early and let losers run. This approach flips that pattern — teaching you how to stay in profitable trades and compound gains.
🧠 Core Concepts You’ll Learn
1. Trend Identification
Learn how to identify:
Primary trends (uptrend/downtrend)
Pullbacks vs. reversals
Trend strength using price action and volume
Higher-timeframe confirmation
2. Entry Techniques for Big Moves
Breakout from consolidation
Trendline and moving average support
SMC-based entries: Order blocks & market structure shifts
Avoiding fakeouts with volume and time confirmation
3. Stay in the Move
How to manage fear during winning trades
Trailing stop techniques: MA trail, swing low method, ATR
Adding to positions safely in trending markets
Avoiding premature exits caused by emotions
4. Exit Like a Pro
Identifying exhaustion signals
Divergences, volume drops, or climax candles
Scaling out profits strategically
Avoiding full exit too early — ride until structure breaks
📊 Why Big Moves Matter
Let’s say your risk is ₹1,000 per trade.
In a scalp, you might make ₹1,500.
In a small swing, maybe ₹3,000.
But if you ride a big move, your reward could be ₹10,000 or more — with the same risk.
That’s the power of risk-reward optimization — where one big move can cover multiple small losses and lift your win ratio significantly.
👨🏫 Who Should Learn This?
Intraday and swing traders
Option buyers looking for momentum moves
Long-term investors who want better timing
Anyone tired of small profits and early exits
✅ What You’ll Achieve:
Learn to identify market momentum early
Improve patience and discipline
Build strategies that favor 1:5 or even 1:10 risk-reward setups
Confidence to hold winners without panic
Eliminate noise and trade with clarity
⚡ Start Riding Waves, Not Ripples
“Ride the Big Moves” is more than a strategy — it's a mindset shift. It teaches you how to think like professionals who don’t chase trades, but wait for the market to offer big, clean opportunities — then ride them with focus and control

Technical Class📘 What is Technical Analysis?
Technical analysis is the study of past market data — mainly price and volume — to forecast future price movement. Unlike fundamental analysis (which looks at company financials), technical analysis focuses entirely on what is happening on the chart right now.
It’s based on three core principles:
Price Discounts Everything
Price Moves in Trends
History Repeats Itself
By mastering this, you can trade like a professional — with logic, structure, and discipline.
🔧 What You’ll Learn in the Technical Class
This class covers all the essential tools, techniques, and strategies used by full-time traders and institutions. Key topics include:
🔹 1. Charting Basics
Types of charts: Candlestick, Line, Bar
Timeframes: 1-min to monthly charts
How to set up charts for analysis
🔹 2. Candlestick Patterns
Bullish and bearish candlesticks
Reversal vs. continuation patterns
Psychology behind candlestick formations (e.g., Doji, Engulfing, Hammer)
🔹 3. Support & Resistance
How to identify key price levels
Role of horizontal zones and trendlines
Breakout and retest strategies
🔹 4. Chart Patterns
Double Top & Bottom
Head and Shoulders
Flags, Pennants, Triangles
Price action and pattern recognition techniques
🔹 5. Technical Indicators
Moving Averages (SMA, EMA)
RSI, MACD, Bollinger Bands
Volume Profile, VWAP
When to use and when to avoid indicators
🔹 6. Trend Analysis
Identifying uptrends, downtrends, sideways movement
Using higher timeframes for confirmation
Entry and exit based on trend strength
🔹 7. Volume Analysis
Importance of volume in confirming moves
Volume spikes and trap zones
Institutional activity detection
🧠 Why Technical Analysis Matters
Most professional traders rely heavily on technicals for:
Short-term and intraday trading
Identifying breakout and breakdown zones
Predicting reversals and continuation setups
Aligning with smart money and institutional behavior
It is one of the most practical skillsets you can learn in trading.
🎯 Who Should Join This Class?
Beginners in the stock market
Aspiring intraday/swing traders
Investors who want better timing
Crypto, forex, or index traders
📈 Conclusion: Read the Market Like a Pro
The Technical Class will give you the confidence to read charts, spot opportunities, and manage trades with structure — no more relying on tips or guesswork.
You’ll walk away with real, practical skills that you can apply in any market, any timeframe, any strategy

LONG TATASTEEL Target 247 This is Long Term View as per Monthly charts and need patience to see the target.
Tata Steel has broken out from Flag pattern and ready to make new high
Target 1 - 170
Target 2 - 212
Target 3 - 247

Tata steel cup Handle breakoutTata steel cup and handle breakout and the price is near resistance also with support coming close to the resistance suggesting possible breakout.
Buy around - 160
Target - 180 (13%)
Duration - 1 month
Tata steel have good fundamentals and showing breakout possibility
