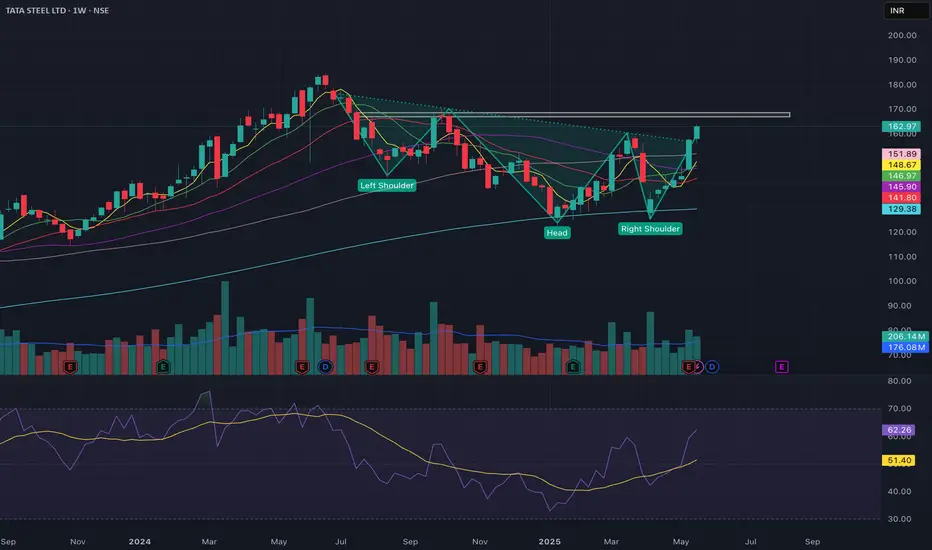
TATASTEEL ready to reach 200Inv H&S patterns observed in W.
Taken support at the MA.
RSI divergence with strength above 50.
Resistance at 170 beyond which target of 200.
Tatasteel
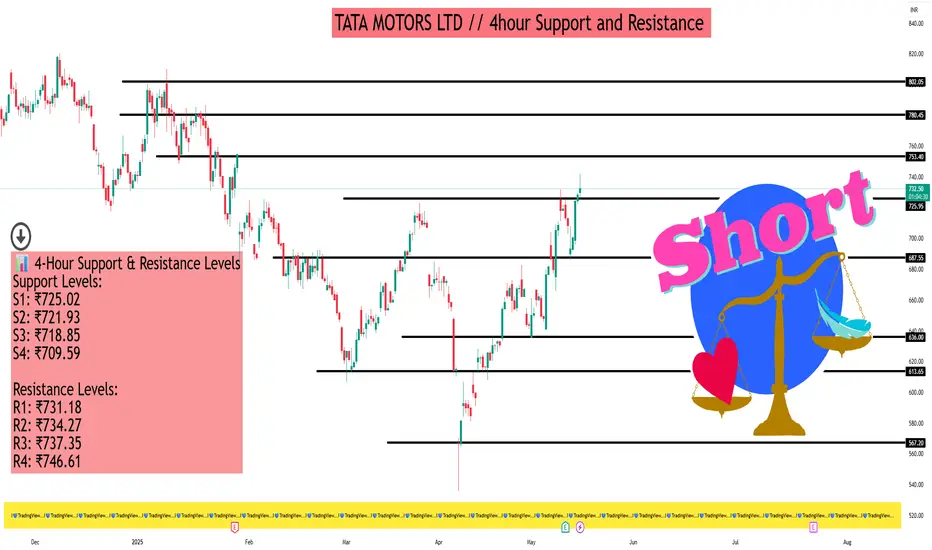
TATA MOTORS LTD // 4hour Support and Resistance As of May 16, 2025, Tata Motors Ltd. (NSE: TATAMOTORS) is trading at approximately ₹735.00. Here's a detailed analysis of its support and resistance levels on the 4-hour timeframe, along with insights from technical indicators and chart patterns.
📊 4-Hour Support & Resistance Levels
Support Levels:
S1: ₹725.02
S2: ₹721.93
S3: ₹718.85
S4: ₹709.59
Resistance Levels:
R1: ₹731.18
R2: ₹734.27
R3: ₹737.35
R4: ₹746.61
These levels are derived from Camarilla pivot calculations and provide key price points where the stock may experience buying or selling pressure.
📈 Technical Indicators Overview
Relative Strength Index (RSI): 68.4 — approaching overbought territory, suggesting potential for a short-term pullback.
MACD (12,26): 8.69 — indicates bullish momentum.
Average Directional Index (ADX): 42.07 — reflects a strong trend strength.
Stochastic Oscillator: 76.29 — nearing overbought levels, which may signal a potential reversal.
Commodity Channel Index (CCI): 103.31 — suggests the stock is in a strong uptrend.
These indicators collectively point towards a bullish trend, but caution is advised due to overbought signals.
🔍 Chart Patterns & Price Action
Recent analyses indicate that Tata Motors has formed a Shark pattern, with potential resistance in the ₹850 to ₹900 range. Short-term targets include ₹700, ₹750, ₹780, ₹820, ₹860, and ₹900. A weekly candle close above ₹900 could signal further upside potential.
Additionally, Elliott Wave analysis suggests that the stock may have completed a Wave (5) near ₹1180, with a potential decline towards the ₹850 level as part of a corrective phase.
🧭 Trading Strategy Insights
Bullish Scenario: If the stock sustains above ₹737.35 (R3), it may target higher resistance levels, with ₹746.61 (R4) being a key level to watch.
Bearish Scenario: A break below ₹725.02 (S1) could lead to further downside, with support at ₹709.59 (S4) potentially being tested.
Tata Steel - Swing TradeNSE:TATASTEEL today looked good technically on the back of China announcing that it would restructure its steel industry to cut its total output. The latest move by China is expected to reduce the dumping of cheap steel into the Indian market, which would act as a major positive for domestic steel companies.
About:
NSE:TATASTEEL is Asia's first integrated private steel company set up in 1907. The company has a presence across the entire value chain of steel manufacturing from mining and processing iron ore and coal to producing and distributing finished products. The company has a target to increase domestic steelmaking capacity to 30 MnTPA by 2025.
Trade Steup:
It Made Good Short Term Base on Daily Charts and Taking Support of 50 DSMA and MACD Trending Upwards Now Looking Good for a Swing Trade.
F&O Activity:
Long Buildup Seen in Futures With 140 PE Gaining Significant OI Addition.
Target (Take Profit):
Around 158 for Positional Trader and 200 DSMA for Swing Trader
Stop Loss:
Entry Candle Low for Swing Trader and 50 DSMA for Positional Trader.
📌Thank you for exploring my idea! I hope you found it valuable.
🙏FLLOW for more
👍BOOST if useful
✍️COMMENT Below your views.
Meanwhile, check out my other stock ideas on the right side until this trade is activated. I would love your feedback.
Disclaimer: "I am not SEBI REGISTERED RESEARCH ANALYST AND INVESTMENT ADVISER."
This analysis is intended solely for informational and educational purposes only and should not be interpreted as financial advice. It is advisable to consult a qualified financial advisor or conduct thorough research before making investment decisions.

Tata Steel cmp 138.31 by Weekly Chart viewTata Steel cmp 138.31 by Weekly Chart view
- Volumes running close to Avg Traded Quantity
- Positively trending Technical Indicators EMA, MACD, RSI
- Resistance Zone 136 to 139 Price Band may be a probable Support Zone
- Price closure above Resistance Zone for few days would drive up the momentum for a fresh breakout opportunity

TatasteelMean reversion happening on bigger time frame.
more selling from here may take it to 135 120 level
stop loss could be 160

tata steel weekly timeframe tata steel weekly timeframe
It touches the trendline and also have double bottom support RSI below 40 this good opportunity to trade in TATA STEEL

Tata Steel - Possible ReversalStock standing at 2 Strong Demand as well as flip zones
Zone 1 at 135-137
Zone 2 at 130 132
Both appears to be excellent zone for reversal
Wait for at least an hourly candle to make a decision
risk to rewards looks promising

TATASTEEL Breakdown Opportunity Stock Name: TATASTEEL
Entry Point: Considering a short position if the price breaks below today's low, supported by strong open interest (OI).
Stop-Loss (SL): Placed above today's high to control risk effectively.
Target: Near the next key support level or adjusted based on real-time price movement.
Disclaimer:
This analysis is shared purely for educational purposes and is not a recommendation to trade. Please perform your own research and consult a financial advisor before making any investment decisions.

TATASTEEL 1D TFAs discussed in the previous post NSE:TATASTEEL was moving around a trend line which it has broke down now. The stock could be traded with strong confirmations only.
We have discussed this more on our previous post. You can view the previous post by clicking the attachment below this post.
Disclaimer:- This analysis is only for educational purpose. Please always do your own analysis or consult with your financial advisor before taking any kind of trades

TATASTEEL - 15m TFNSE:TATASTEEL has formed a clear support line ( Trend Line) with multiple touch points, as the month TF didn't have any break of structure(BOS) on the sell side, the market is still considered to be in uptrend. Moving down to the 15m TF the market has a resistance with multiple touch points and if it breaks the resistance zone with a good volume a long position could be expected.
Disclaimer:- This analysis is only for educational purpose. Please always do your own analysis or consult with your financial advisor before taking any kind of trades NSE:TATASTEEL

TATA STEEL 1D TFNSE:TATASTEEL has been respecting a trend line for a very long time. We've discussed about this in our previous posts. The stock has formed a good bullish candle showing signs of possible bullish movement. A R:R of 1:1.5 can be traded in this trade. As the volume is good and supporting our audio. The possible of winning this trade is more.
The link to my previous post is given below where we've discussed about the consolidation. You can check the post for reference.
Disclaimer:- This analysis is only for educational purpose. Please always do your own analysis or consult with your financial advisor before taking any kind of trades

STEELCAST✦✦ BREAKOUT STOCK ✦ ✦
#STEELCAS
CMP 828.60
The stock was in a long, 52-week consolidation phase before breaking out.
9-Week Small Base Formation
2x Average Volume on Daily Chart
Rising EMAS Indicating Strength
Entry Point:
The ideal entry would be near the breakout level of 830-850,
confirming the breakout above resistance with strong volume.
Targets: 910, 1020, 1150
Stop-Loss:
Set a stop-loss around 735, below the consolidation range,
to manage risk in case of a false breakout.

"Retailer Trap in Action? | TATAMOTORS✅"Tata Motors (-3.8%) has hit its lowest point since January, down 28% from July highs. Are you buying the dip?"
✅"Inducement is a process where market movements are manipulated to encourage traders to take positions that are likely to fail. The idea is that large institutions can influence price movements to attract various traders and trap them in losing trades."
💡Insight:
📍Business Split: Tata Motors is separating its Passenger and Commercial Vehicle businesses to streamline operations, with a Jaguar Land Rover IPO expected soon
📍Sales Boosting Discounts: October 2024 sees major festive discounts on models like the Nexon and Harrier to regain market share
📍Sales Performance: A 2% year-over-year increase in Q1 FY25, led by strong growth in commercial vehicles despite slight dips in passenger vehicles
💡✍️Applied Tools:-
1️⃣Trap Trading
2️⃣Strong order block zone
3️⃣Fake channel breakout
4️⃣Inducement Strategy
✅Check out my TradingView profile to see how we analyze charts and execute trades.
⭕️ Swing Trading opportunity: Price Action Analysis Alert !!!⭕️
💡FNO Stocks📉📈📊
🙋♀️🙋♂️If you have any questions about this stock, feel free to reach out to me.
📍📌Thank you for exploring our idea! We hope you found it valuable.
🙏FLLOW for more !
👍LIKE if useful !
✍️COMMENT Below your view !

Tata Steel - 1D TFNSE:TATASTEEL has almost broke a trend line and started to move downwards. With Nifty in downtrend in 1D TF it is possible that this could stock could easily hit take profit.
Disclaimer:- This analysis is only for educational purpose. Please always do your own analysis or consult with your financial advisor before taking any kind of trades
NSE:TATASTEEL

Tata Steel with 1:2 bullish setup*SWING TRADE*
Buy TATAL STEEL
Above 157
Stop Loss: 145
Target 1 (1:1.5) 175
Target 2 (1:2) 181
_Duration 1-2 months_
Trade as per your risk-taking capacity.
The metal sector is showing signs of reversal, having retested the breakout level of 9493. Tata Steel also retested its zone breakout level and saw an increase in volume on the daily candle. An entry above the last day’s high has the potential to achieve a target of 1:2.

TATASTEEL for 45% (approx..) Potential GainTata steel is showing retest breakout... according to some theories RETEST STOCKS ARE THE BEST STOCKS...
All data is available in public domain..
CMP : 160
TG : 215
SL : 142
Stock's selection based on 5 Point Analysis:
1: Idea : Retest Breakout.
2: Support : Volume, Delivery & VWAP.
3: Technical : 9/21/55/200-EMA, RS>0, MACD, RSI & Super trend up.
4: Fundamental : PE, PAT, Industry & peer PE and sector performance.
5: Timing : Entry Timing on day chart.
Disclaimer : It is my personal view as a trader and for educational purpose only. Equity market involves risk .
Please consult your financial adviser before taking any decision.
Disclosure : going to Hold

Graphite India for 100%+ upsideDate: 21 Sep’24
Timeframe: Weekly chart
Graphite India currently seems to be in Wave III of 3 which is heading towards 1400 levels (130% growth from current price) as seen in the chart. Even if it attains its previous all time high of August 2018, that’s almost double its current price. If one can handle the fluctuations that operators inject from time to time and hold tight, this one is a no brainer.
This is not a trade recommendation. Please do your own analysis.

IMFA heading towards 1000?Date: 22 Sep’24
Stock: Indian Metals and Ferro Alloys (IMFA)
Timeframe: Daily
As mentioned in my idea posted on 10 Sep’24 (link is in Related Ideas section), IMFA seems to have completed Wave IV of 3 on 13 Sep’24 and begun Wave V impulse towards 950 as seen in the chart. It can very well go past 1000 as well, only further moves can confirm this.
This is not a trade recommendation. Please do your own analysis.

TATA STEEL - When Waves are Messi don't try to be a GOAT. Tata Steel is in this Upward sloping Channel since June 2022 all the rise looks messy means all pullbacks have over lapped with previous rise so instead of forcing Elliott Wave we will try to study it with simple technical approach.
We have drawn a trendline connecting lows which has held 4 times & which was also 50 Week Moving Average so buyers are happy to go long at 50 WMA & this trend line support.
Supply comes from parallel channel of this trendline so looking at his chart risk reward looks attractive for buyers as of now.
Weekly close below 147 will be sign of bulls losing control as of now longs looks good for short term to medium term view.
I find people marking everything as impulsive or corrective but when you cannot spot a clear wave structure better to avoid the stock if its low volume or KISS (Keep It Simple Stupid) strategy works best.

Buy Tata steel round bottom breakout retest completeNSE:TATASTEEL Round bottom breakout strategy
Retest complete after round bottom breakout
Weekly chart
Big green candle formed at retest level
Volume rising
Stock is in uptrend
Do as directed in the chart
This is not the trading recommendation or advise 🚨
Do your analysis before taking any step 👍

Technical Analysis of LME INDEX Based on Elliott WavesTechnical Analysis of LME INDEX Based on Elliott Waves
The information provided in this response is based on the analysis of the Elliott Wave chart and does not constitute financial advice. The author is not responsible for any investment gains or losses incurred by individuals who rely on this information.
Elliott Wave Theory is a technical analysis method that identifies recurring patterns in financial markets. These patterns, known as Elliott Waves, are based on the idea that human psychology and behavior drive market movements.
Key Elliott Wave Principles:
Five-Wave Impulse: A five-wave pattern that represents an uptrend or downtrend.
Three-Wave Correction: A three-wave pattern that represents a pause or reversal in the trend.
Fibonacci Relationships: Numerical relationships between different waves, often expressed as ratios (e.g., 0.618, 1.618).
Analysis of the LME INDEX Chart:
Based on the provided Elliott Wave chart, it appears that the LME INDEX is currently in the early stages of an impulse wave structure. This suggests a strong uptrend is underway.
Specific Observations:
Wave 1: The initial upwave has likely been completed.
Wave 2: A corrective pullback also looking done.
Wave 3: The next wave is expected to be a powerful extension of the uptrend.
Impact on Commodities and Indian Metal Stocks:
The LME INDEX is a crucial benchmark for the metals market. Its price movements can significantly impact the prices of individual metals and related commodities. Indian metal stocks, such as Vedanta, NALCO, and Hindustan Zinc, are directly influenced by the LME INDEX.
Educational Purpose:
It's important to emphasize that this analysis is for educational purposes only and should not be considered as trading advice. The financial markets are volatile, and past performance does not guarantee future results. Investors should conduct their own research and consult with financial advisors before making any investment decisions.
I am not sebi registered analyst. My studies are for educational purpose only. Please Consult your financial advisor before trading or investing. I am not responsible for any kinds of your profits and your losses.
Most investors treat trading as a hobby because they have a full-time job doing something else.
However, If you treat trading like a business, it will pay you like a business.
If you treat like a hobby, hobbies don't pay, they cost you...!
Hope this post is helpful to community
Thanks
RK💕
Disclaimer and Risk Warning.
The analysis and discussion provided on in.tradingview.com is intended for educational purposes only and should not be relied upon for trading decisions. RK_Charts is not an investment adviser and the information provided here should not be taken as professional investment advice. Before buying or selling any investments, securities, or precious metals, it is recommended that you conduct your own due diligence. RK_Charts does not share in your profits and will not take responsibility for any losses you may incur. So Please Consult your financial advisor before trading or investing.

Tata Steel Ltd - Breakout OpportunityDate : 26-Sep-2024
LTP : Rs. 165.61
Resistance Levels: (R1) Rs. 184 --> (R2) Rs. 210
Support Levels : (S1) Rs. 147 --> (S2) Rs. 142
Technical View:
• NSE:TATASTEEL is in strong primary uptrend and was recently going through it's secondary downtrend within primary uptrend.
• After touching the high of 184.60 on 18-Jun-2024, it has retraced 23% to 142.35 level.
• NSE:TATASTEEL has breakout from it's secondary downtrend with higher than average volume. Breakout is also supported by increased volume in last few sessions.
• NSE:TATASTEEL is trading above both 20 DMA and 50 DMA since last few sessions.
• RSI is trading at 70.29. MACD is trading at 1.38. Both MACD and RSI are showing positive divergence.
• Looking good to start a new swing from here.
Like the analysis? Boost/Like this idea and follow my ID.
Disclaimer: I am not a SEBI registered analyst/consultant and not recommending anyone to take any BUY or SELL position in stock market. Investing in stock market is risky and one should do a self analysis and validation before investing in stock market. My ideas are published for learning purpose only and are available to everyone at no cost/charge.

Vedanta for 20% gainsDate: 25 Sept’24
Stock: Vedanta
Timeframe: Daily chart
In my earlier analysis of Vedanta in May this year, I had mentioned the stock is heading to over 800+. I have now reviewed my analysis for a target of around 580 (20% from its current price).
Vedanta seems to be in Wave V of 5 and could attain a target of about 585 as seen in the chart.
This is not a trade recommendation. Please do your own analysis.
