Nifty IT down by 6%A company called Anthropic released a new set of AI tools that surprised global markets.
One of these tools helps with work like reading documents and automating routine office tasks.
Investors worried that this AI could replace old software and services many companies sell.
Because of this fear, people started selling shares in big software companies.
Big Indian IT companies like Infosys, TCS and Wipro were affected.
The market reaction showed that investors fear AI might cut into profits of traditional tech businesses.
Anthropic’s new tools are meant to save time, but for stock markets it sparked uncertainty.
This event highlighted how powerful and fast AI changes are happening in technology today.
TCS

TCS at Support: Breakdown Fear or Bounce Setup?📊 Tata Consultancy Services Limited – 1H Technical Analysis
Timeframe: 1-Hour
Trend Structure: Rising channel (higher highs & higher lows)
Current Phase: ABC corrective pullback within an uptrend
CMP Zone: ~₹3,160
🔍 Big Picture Structure (Context First)
TCS is trading inside a well-defined rising channel, which tells us:
Institutions are accumulating on dips
Pullbacks are corrective, not impulsive
Trend strength remains intact as long as the channel holds
The recent decline is forming an ABC correction within this channel:
Wave (a): First profit-booking leg
Wave (b): Pullback rally (short covering)
Wave (c): Final emotional dip → testing demand
📘 In strong trends, Wave-C often marks the “last shakeout” before continuation.
🟩 Buying Zone: ₹3,155 – ₹3,181 (High-Probability Area)
🧠 Why this zone can attract buyers (Trading Psychology):
This area aligns with:
Channel support
Prior breakout memory
Wave-C completion expectations
Swing traders who missed the rally are waiting here
Existing longs defend this zone to protect trend structure
Shorts start booking profits after extended downside
👉 Result: Demand + short covering = bounce probability
📌 This is why it’s marked as a buying / accumulation zone, not a blind entry.
🔑 Key Levels & Why Price Reacts There
🟢 Wave-C Completion Zone: ~₹3,150–3,165
• Emotional selling exhausts
• Weak hands exit
• Smart money steps in
🧠 Markets usually turn when fear peaks, not when news feels good.
🔴 Invalidation / Stop-Loss: ₹3,105 (Hourly Close Below)
• Break of channel structure
• Buyers lose confidence
• Trend pauses or deepens into range
📉 Below this, psychology shifts from “buy dips” to “wait & watch”.
🔵 F&O Resistance Zone: ₹3,318 – ₹3,340
• Option writers active
• Profit booking by swing traders
• First supply reaction expected
📘 Derivative zones often cap the first rally.
🟢 Swing Target: ₹3,466
• Upper channel projection
• Momentum traders enter
• Short stop-losses fuel upside
📈 New highs revive optimism & momentum buying.
🟢 Bullish Scenario (Primary Probability)
If price:
Holds ₹3,155–3,181
Forms a base / higher low on 2H
Then:
Bounce toward ₹3,318–3,340
Acceptance above this zone → ₹3,466 swing target
Trend continuation within channel
📘 This is continuation, not reversal trading.
🔴 Bearish Risk Scenario (Secondary)
If price:
Closes below ₹3,105 (hourly)
Then:
Channel support breaks
Buyers step aside
Price may drift into deeper consolidation
📉 This reflects loss of momentum, not immediate trend reversal.
🎓 Educational Takeaways (Very Important)
Strong trends correct in ABC form, not straight lines
Best trades appear when fear meets structure
Channels work because institutions defend averages
Levels matter because traders remember pain & opportunity
🧠 Trading Psychology Behind This Chart
Zone Dominant Emotion
Upper channel Confidence / Greed
Pullback start Profit booking
Buying zone Fear vs Opportunity
Breakdown Doubt & Patience
New highs Momentum & FOMO
📘 Charts are visual representations of crowd emotion.
🔮 Price Outlook (Educational Projection)
Above ₹3,180: Bullish bias intact
Above ₹3,340: Momentum expansion
Target zone: ₹3,466
Below ₹3,105: Trend pause / deeper correction
🧾 Conclusion
TCS remains structurally bullish inside a rising channel.
The ₹3,155–3,181 zone is a decision area where Wave-C correction may end and trend continuation can begin.
📌 Strong stocks test patience before rewarding discipline.
⚠️ Disclaimer
This analysis is for educational purposes only.
I am not a SEBI registered analyst. Markets involve risk, and I may be wrong.
Please consult your financial advisor before taking any trade or investment decision.

TCS - Swing Trade Setup📌 TCS — Elliott Wave Outlook: Possible Wave 4 Bounce Before Wave 5 Decline
TCS is currently trading near a critical zone where the earlier ABC corrective structure has already been completed. Price action is now approaching a region where structural deviation may occur.
From an Elliott Wave perspective, if the price breaks above the ABC completion zone, it can indicate the development of an intermediate Wave 4. Such Wave-4 formations typically retrace a portion of Wave 3, often creating a temporary relief rally within the broader structure.
However, unless the trend fully reverses, this Wave 4 bounce can remain corrective in nature. After completing Wave 4, the chart suggests that TCS may resume its decline to form Wave 5, thereby completing the higher-degree Wave B or Wave 2 within the Primary Wave Structure.
Key Technical Notes:
ABC corrective structure appears completed.
Breaks above the completion zone increase the probability of a corrective Wave 4 rally.
Wave 5 may unfold afterward, potentially completing Primary Wave B/2.
Trend confirmation should be based on hourly closes and price behavior near key Fib retracement zones.
What to Watch:
Price reaction near the ABC completion zone
Whether a structured Wave 4 bounce forms or price rejects sharply
Hourly close levels for confirmation
Volume behavior on the bounce or breakdown
Educational Insight:
Wave 4 rallies are often misleading for new traders—they may appear as reversals but are usually corrective. Always assess whether structure supports continuation before assuming a trend shift.
Conclusion
TCS is at a structural turning point. A break above the ABC completion region may trigger a Wave 4 relief move, but unless higher-degree resistance breaks convincingly, the larger structure still supports a potential Wave 5 decline to complete the primary correction.
Disclaimer:
I am not a SEBI-registered analyst. This analysis is for educational purposes only. Always perform your own research or consult a financial advisor before making trading decisions.

TCS – Supply Zone + Channel Resistance | Short Idea (4H)Price has reached a major supply zone aligned with the upper channel resistance, creating a high-probability rejection zone.
The confluence of:
Horizontal resistance
Supply zone
Rising channel top
makes this area a strong rejection point.
🔵 Reason for Short Setup
Price is reacting at a previous rejection zone
Clear bearish wick activity near resistance
Channel structure shows exhaustion at the top
Risk:Reward remains favorable
🎯 Trade Plan
Entry: Around current rejection zone
Stop-Loss: Above supply zone + channel breakout
Target 1: Mid-channel
Target 2: Lower channel support
🔍 Market Structure
4H trend is still forming higher lows, but momentum weakens at resistance
If price closes above the blue zone, setup becomes invalid
Watching for confirmation candle (bearish engulfing / rejection wick)
⚠️ Invalidation
A strong 4H close above the blue resistance breaks the idea.
💬 Note
This is a pure price-action confluence setup. Will update once price reaches mid-channel target or shows breakdown signals.

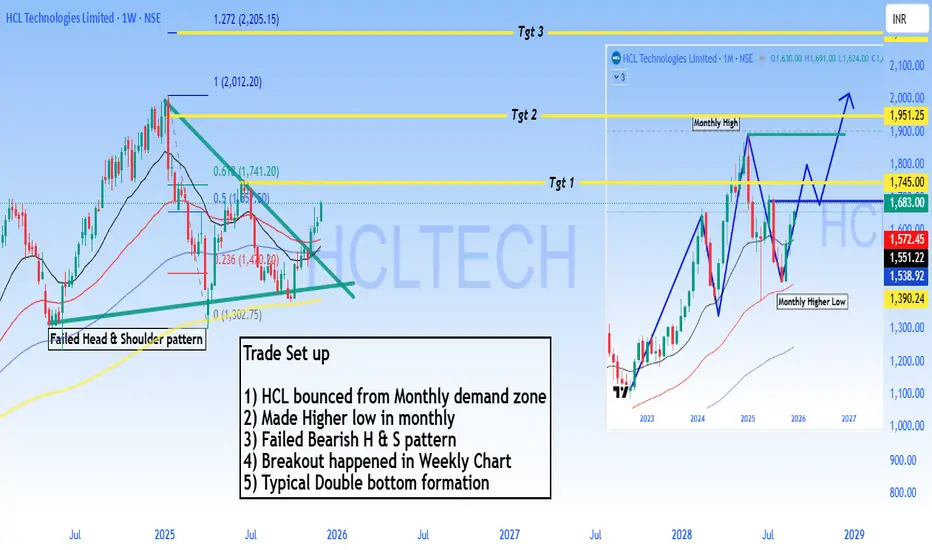
HCLT - Buy - Technical Analysis#HCL Technologies Limited - Technical Analysis
Price: 1,683.00 |
#Trade Setup - Bullish Reversal
#Outlook
Strong bullish setup with 4-35% upside potential. The failed bearish head & shoulder pattern combined with monthly demand zone bounce suggests institutional accumulation. Breakout above 1,745 opens path to 1,951 and beyond.
Pattern Analysis:
1. Bounced from monthly demand zone - Strong support established
2. Made higher low in monthly chart - Trend reversal signal
3. Failed Bearish Head & Shoulders pattern - Bears trapped, bullish continuation
4. Breakout confirmed on weekly chart - Momentum shift
5. Typical double bottom formation - Classic reversal pattern
Technical Structure:
- Monthly higher low at 1,390 confirms bullish structure
- Failed H&S pattern invalidation is highly bullish
- Price now targeting previous resistance zones
Target Levels:
- Target 1: 1,745.00
- Target 2: 1,951.25
- Target 3: 2,272.70
Support: 1,572 - 1,551 (critical zone)
⚠️ DISCLAIMER
**NOT investment advice.** Educational analysis only. Trading involves substantial risk of loss. Past patterns don't guarantee future results. Always do your own research and consult a SEBI-registered financial advisor. Author assumes no responsibility for losses.
#HCLTech #StockMarket #NSE #TechnicalAnalysis #ITStocks #IndianStockMarket #SwingTrading #Trading #FinTwit #TradingView #ChartAnalysis #StocksToWatch #Nifty50 #TechStocks
TCS Chart Update – Fibonacci + Breakout LevelsTCS – Retest Breakout Trading Setup with Price Action + Fibonacci Strategy
TCS is approaching a key breakout zone around ₹3,280. A retest entry can offer a high-probability trade setup.
How to Trade This Setup
1️⃣ Breakout Level
₹3,280 is the major resistance zone
Wait for strong breakout candle closing above ₹3,280
2️⃣ Retest Entry
📍 After breakout, price may pull back to ₹3,280–₹3,260
📍 Look for bullish rejection candle (Pin bar / Hammer / Engulfing)
👉 Entry on bullish close after retest
3️⃣ Stop-Loss (Price Action Based)
🛑 SL below ₹3,085 (strong support level)
4️⃣ Targets using Fibonacci
🎯 T1: ₹3,350
🎯 T2: ₹3,400
🎯 T3: ₹3,456 (Fib 38.2%)
Strategy Summary
Element Value
Breakout zone ₹3,280
Retest entry ₹3,280–₹3,260
SL ₹3,085
Targets ₹3,350 / ₹3,400 / ₹3,456
Direction Bullish above breakout
View
Bullish bias if price sustains above ₹3,280.
Retest entry gives the safest low-risk setup. 🚀
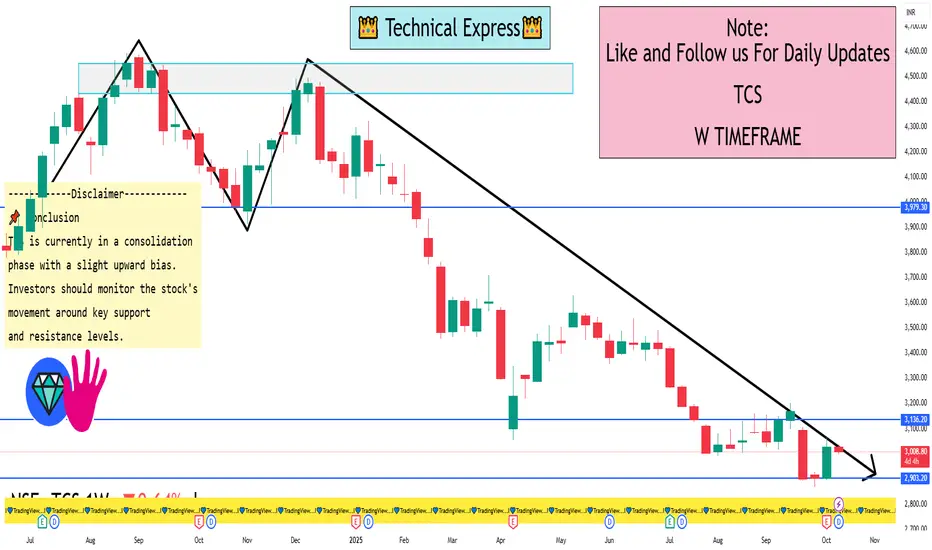
TCS 1 Week View 📊 Weekly Technical Overview
Current Price: ₹3,004.80 (NSE)
Weekly Performance: +3.57%
Year-to-Date Performance: −26.69%
52-Week High: ₹4,592.25 (Aug 30, 2024)
52-Week Low: ₹2,888.40
🔍 Key Technical Indicators
Moving Averages:
5-Day MA: ₹3,018.94 (Sell)
50-Day MA: ₹2,980.76 (Buy)
200-Day MA: ₹3,046.08 (Sell)
Relative Strength Index (RSI): Currently at 40, indicating a neutral stance.
MACD: Bearish crossover observed, suggesting downward momentum.
Support Levels: ₹2,888.40
Resistance Levels: ₹3,176.70
📌 Conclusion
TCS is currently in a consolidation phase with a slight upward bias. Investors should monitor the stock's movement around key support and resistance levels. A break below ₹2,888.40 could signal further downside, while a rise above ₹3,176.70 may indicate a potential trend reversal.
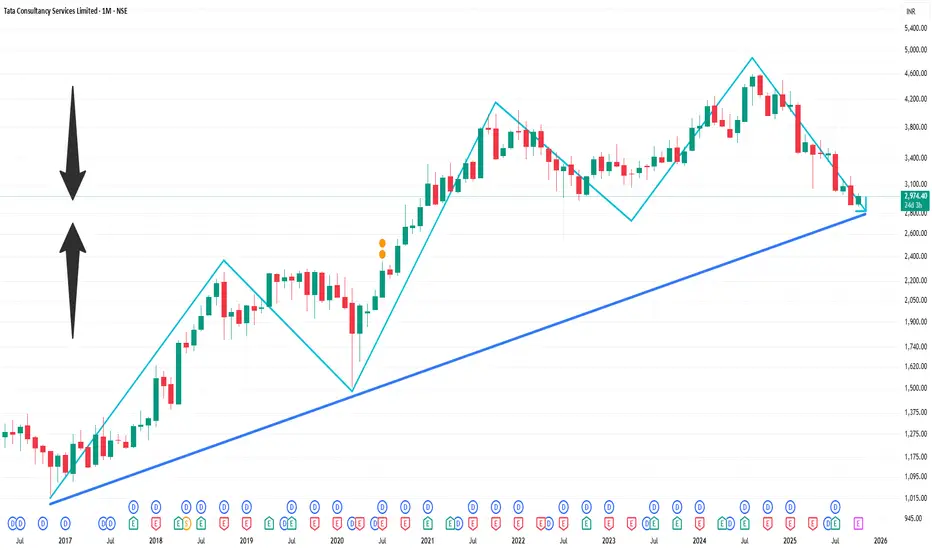
TCS 1 Month Time Frame 📉 Technical Overview (1-Month Timeframe)
Price Range: ₹2,867.55 – ₹3,202.95
Current Price: ₹2,962.
Trend: Bearish
According to TradingView, the 1-month technical analysis for TCS indicates a neutral outlook. However, moving averages suggest a strong sell signal. Oscillators are neutral, and pivot points are not specified.
🔍 Key Technical Indicators
Relative Strength Index (RSI): Not specified.
Moving Averages: Short-term and long-term moving averages indicate a bearish trend.
MACD: Not specified.
Pivot Points: Not specified.
🔮 Short-Term Outlook
Analysts forecast that TCS may reach ₹2,953.43 within a week and ₹2,707.65 within four weeks.
⚠️ Conclusion
The current technical indicators suggest a bearish trend for TCS over the past month. Investors should exercise caution and consider these factors when making investment decisions.
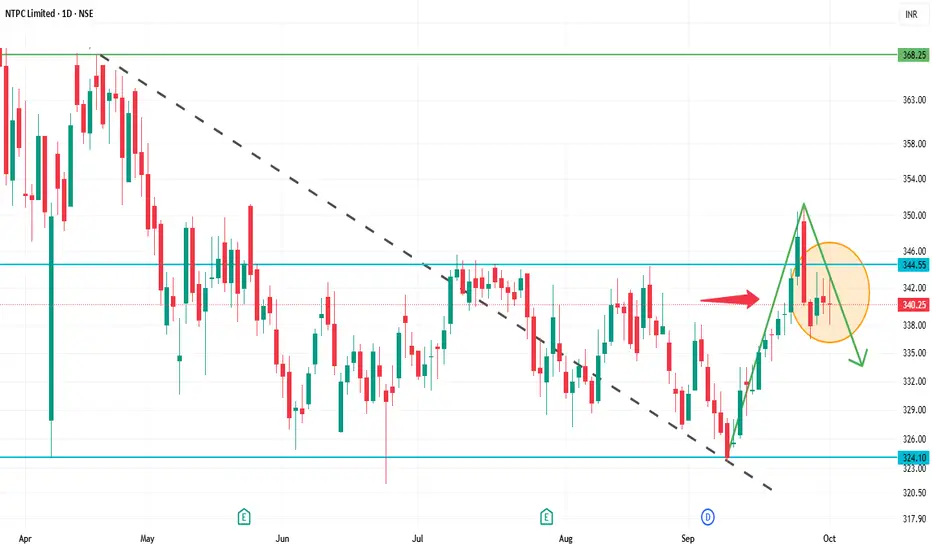
NTPC 1D Time frameCurrent Snapshot
Current Price: ₹340.25
52-Week High: ₹447.75
52-Week Low: ₹292.80
Strategy & Outlook
Bearish Bias: The stock is in a short-term downtrend with negative momentum indicators.
Selling Opportunity: Consider selling near resistance zones (₹343–₹345) with a target towards ₹335–₹340.
Risk Management: Place stop-loss orders above the resistance levels to manage potential upside risks.
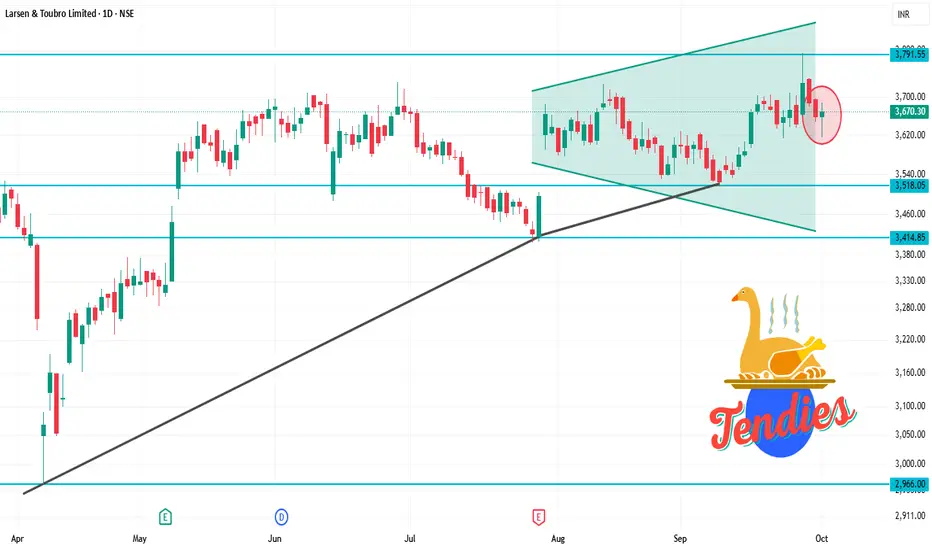
LT 1D Time frameCurrent Snapshot
Current Price: ₹3,670.30
52-Week High: ₹3,963.50
52-Week Low: ₹2,965.30
Strategy & Outlook
Bullish Bias: The stock is in a short-term uptrend with positive momentum indicators.
Buying Opportunity: Consider entering near support zones (₹3,600–₹3,650) with a target towards ₹3,700–₹3,750.
Risk Management: Place stop-loss orders below the support levels to manage potential downside risks.
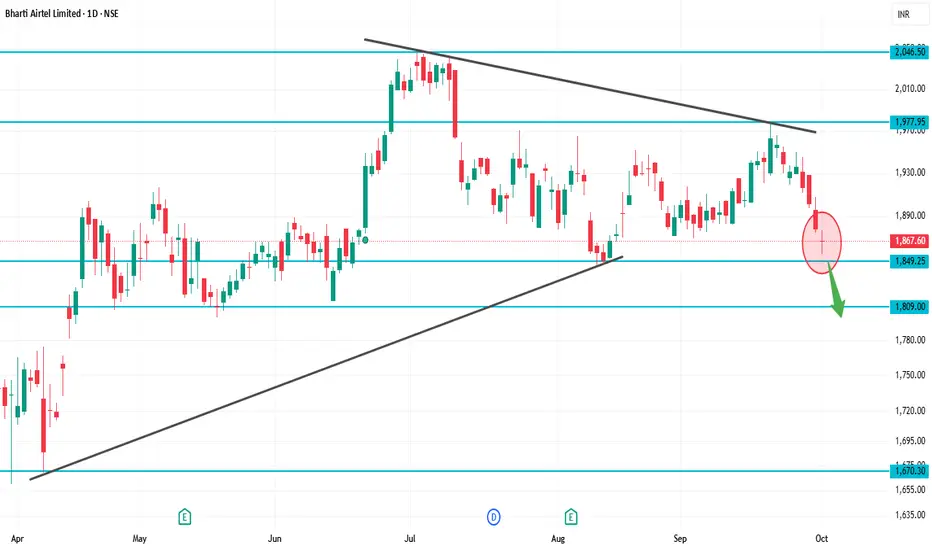
BHARTIARTL 1D Time frameCurrent Price: ~₹1,867
52-Week High: ~₹2,045
52-Week Low: ~₹1,511
Explanation
At ₹1,867, Airtel is just above immediate support (₹1,840–1,850).
If buyers hold this support, stock may bounce back toward ₹1,900+.
But if ₹1,840 breaks, then downside may open toward ₹1,800–1,750.
For bulls, a clean breakout above ₹1,920–2,000 is needed for fresh rally.
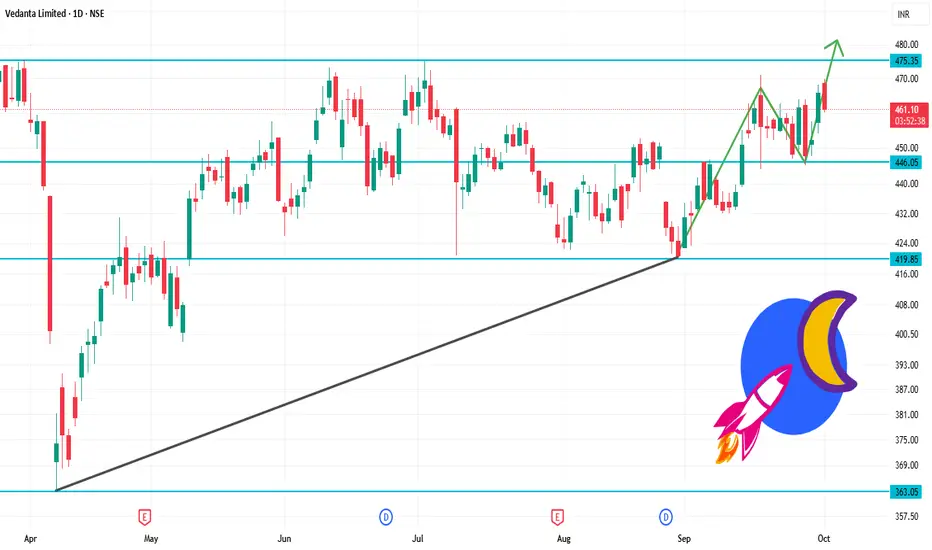
VEDL 1D Time frameOpening Price: ₹468.55
Closing Price: ₹461.40
Day Range: ₹463.00 – ₹469.85
Volume: 2,730,213 shares traded
📉 Trend Analysis
Short-Term Trend: Bearish – The stock is trading below key moving averages, confirming the bearish trend.
Medium-Term Trend: Neutral – The stock is in a consolidation phase, characterized by lower highs and lower lows.
Long-Term Trend: Neutral – No significant trend identified; the stock is trading within a range.
🔮 Conclusion
Vedanta Ltd. is in a bearish trend with weak momentum.
Break below ₹460.00 could lead to further decline toward ₹455.00.
Break above ₹475.00 would indicate a potential trend reversal.
HEROMOTOCO 1D Time frame📌 Current Status
Closing Price: ₹5,410
Day Change: –35 points (–0.64%)
Day’s High: ₹5,470
Day’s Low: ₹5,380
52-Week Range: ₹4,800 – ₹6,050
🔍 Chart & Price Action Insights
Price is moving sideways, bouncing between support and resistance.
Bulls are defending ₹5,380
Sellers resist above ₹5,470
Watch for a break above ₹5,470 for potential upward momentum
Break below ₹5,380 may trigger a short-term decline toward ₹5,330

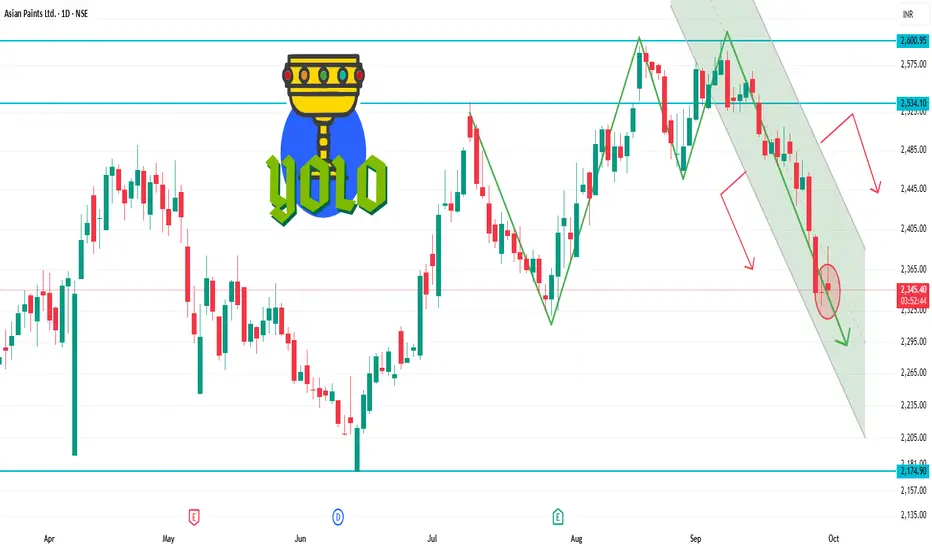
ASIANPAINT 1D Time frameCurrent Price Snapshot
Current Price: ₹2,345.50
Day’s Range: ₹2,342.00 – ₹2,388.80
52-Week Range: ₹2,124.75 – ₹3,358.00
Technical Indicators
RSI (14-day): 44.19 — indicates a neutral to slightly bearish momentum.
MACD: -4.010 — suggests bearish momentum.
Moving Averages:
5-day: ₹2,396.00 — indicates a Sell signal.
50-day: ₹2,389.00 — indicates a Sell signal.
200-day: ₹2,350.00 — indicates a Neutral signal.
Technical Summary: Predominantly Sell signals across various indicators.
Summary
Above ₹2,388.80: Potential rise toward ₹2,400 – ₹2,420.
Below ₹2,342.00: Potential fall toward ₹2,320 – ₹2,300.
Between ₹2,300 – ₹2,380: Likely range-bound movement.
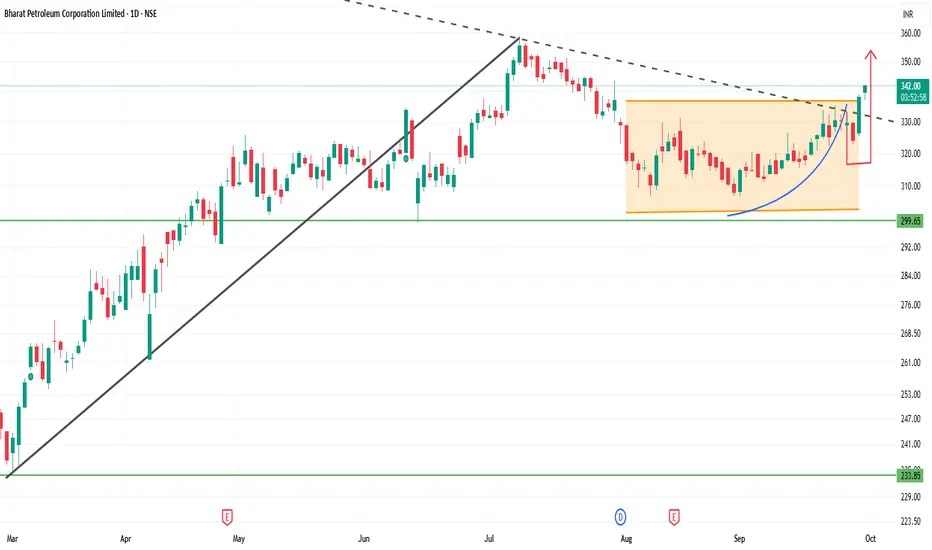
BPCL 1D Time frameCurrent Price Snapshot
Last Traded Price: ₹340.20
Day’s Range: ₹337.15 – ₹340.85
52-Week Range: ₹234.01 – ₹373.35
Technical Indicators
RSI (14-day): 53.27 — indicates a neutral momentum.
MACD: 2.49 — suggests a bullish trend.
Moving Averages:
5-day: ₹327.97 — indicates a Sell signal.
50-day: ₹322.14 — indicates a Buy signal.
200-day: ₹296.14 — indicates a Buy signal.
Pivot Points:
Support: ₹327.13
Resistance: ₹337.93
Summary
Above ₹340.85: Potential rise toward ₹345 – ₹350.
Below ₹337.15: Potential fall toward ₹330 – ₹325.
Between ₹330 – ₹340: Likely range-bound movement.
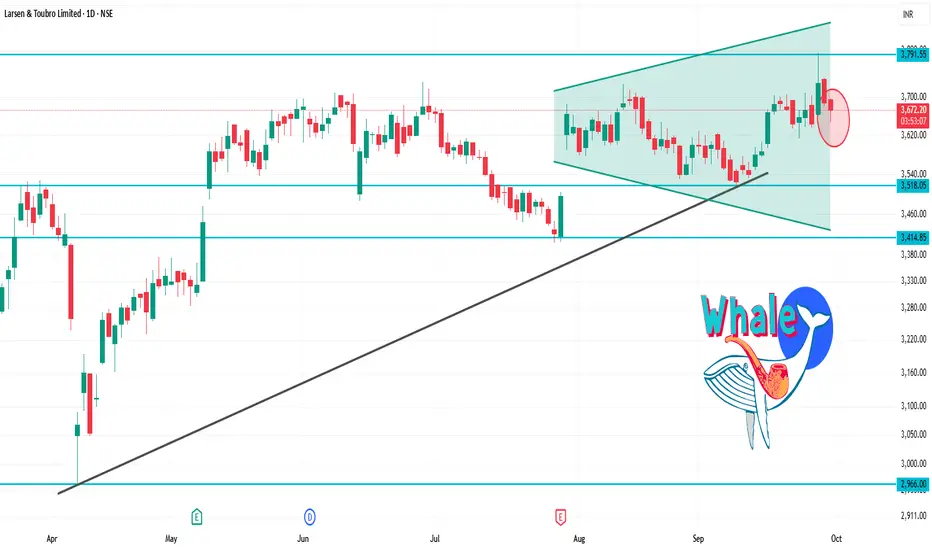
LT 1D Time frameCurrent Price: ₹3,655.30
Day’s Range: ₹3,648.00 – ₹3,696.60
52-Week Range: ₹2,965.30 – ₹3,963.50
Technical Indicators
RSI (14-day): 41.19 — indicates a neutral to slightly bearish momentum.
MACD: -1.47 — suggests bearish momentum.
Moving Averages: Mixed signals — short-term averages are bearish, while long-term averages are bullish.
Technical Summary: Predominantly Sell signals across various indicators.
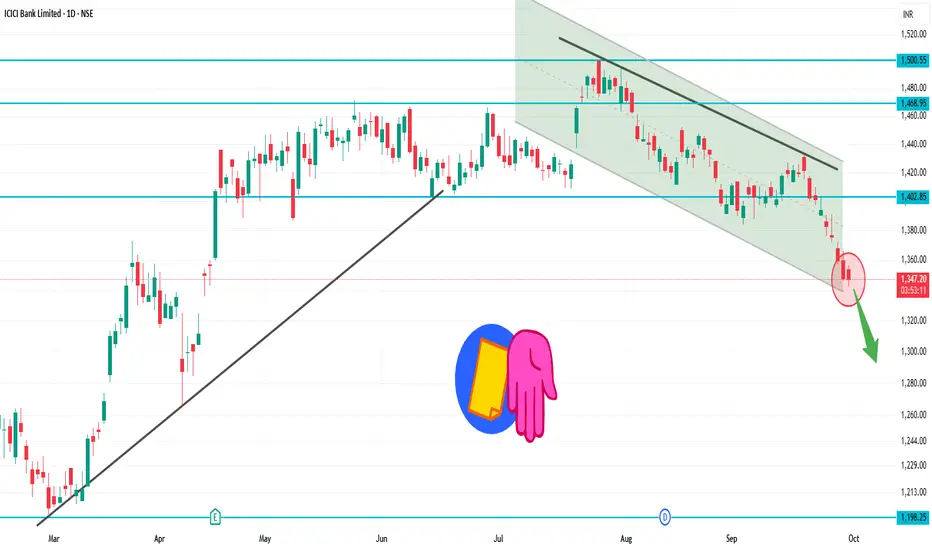
ICICIBANK 1D Time frame₹1,345.80 (NSE)
Day’s Range: ₹1,342.60 – ₹1,356.60
52-Week Range: ₹1,186.00 – ₹1,500.00
📉 Technical Overview
Trend: The stock is trading below its 200-day moving average, indicating a mildly bearish trend.
RSI: Currently at 26.6, suggesting the stock is in the oversold zone.
MACD: At -10.01, reinforcing the bearish momentum.
Moving Averages: A strong sell signal is indicated, with 0 buy signals and 12 sell signals across various timeframes.
🔼 Potential Upside (Rise)
Immediate Resistance: ₹1,355 – ₹1,365
Breakout Target: Above ₹1,365, the next resistance is around ₹1,380 – ₹1,390.
Bullish Confirmation: A close above ₹1,390 could signal a reversal or consolidation.
🔽 Potential Downside (Fall)
Immediate Support: ₹1,340 – ₹1,330
Breakdown Target: Below ₹1,330, the stock may test ₹1,310 – ₹1,300.
Bearish Confirmation: A close below ₹1,300 would strengthen the bearish outlook.
✅ Summary
Above ₹1,365: Potential rise toward ₹1,380 – ₹1,390.
Below ₹1,330: Potential fall toward ₹1,310 – ₹1,300.
Between ₹1,330 – ₹1,365: Likely range-bound movement.
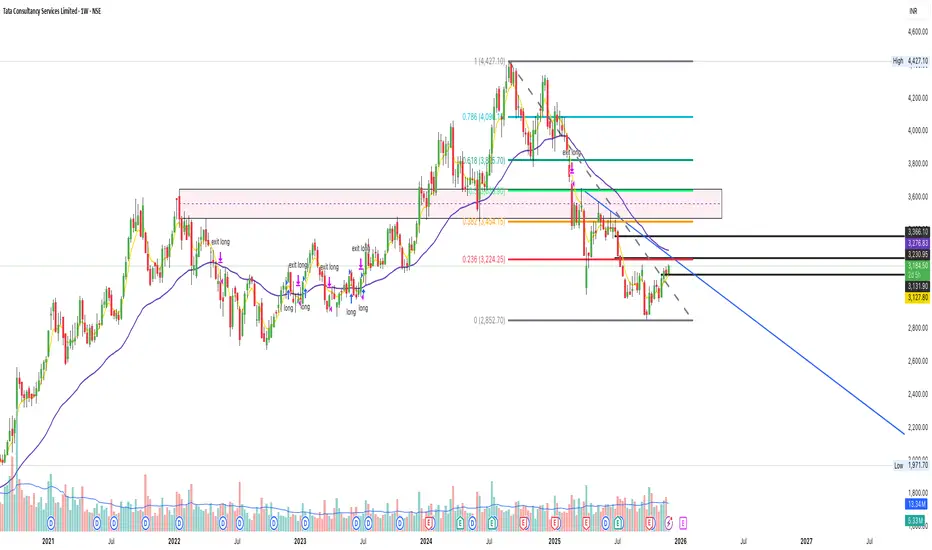
TCS – Bearish Outlook Intact, But a Wave B Bounce in Play?Chart Structure (Weekly)
TCS has been locked in a corrective decline since the 4592.25 peak. The latest fall into the historical support cluster (near 3056–2890) completed a five-wave structure within wave A. From here, a bounce toward wave B is possible, with resistance around 3350–3600.
Bullish trigger: RSI shows a bullish divergence (price made a lower low, RSI made a higher low).
Upside potential: A move towards the 3350 resistance zone.
Downside risk: If support fails, the next major level sits near 2292 — aligning with a larger wave C.
So the long-term outlook remains bearish, but a short-term bounce looks probable.
Fundamental Headwind
Adding to the technical picture, the looming H1-B visa fee hike is a structural negative for Indian IT companies. TCS, Infosys, and peers with heavy US revenue exposure could see margin pressure in the quarters ahead. This reinforces the larger bearish bias, making any bounce counter-trend in nature.
Illustrative Option Play – Bull Call Spread
For those looking to play the short-term bounce while limiting risk, one way is to structure a bull call spread:
Buy 3000 CE (Oct Expiry) at ₹42.1
Sell 3040 CE (Oct Expiry) at ₹31.25
Lot size: 175
Net Cost: ₹1,899
Max Profit: ₹5,101 (~26%)
Max Loss: ₹1,899 (~10%)
Breakeven: 3011(4%)
Reward/Risk: 2.7
(Note: Prices are as of EoB 29th September 2025. This is only an example to demonstrate risk-managed structures. Not a trade recommendation.)
Summary
Long-term: Bearish, with risk of a wave C drop toward 2292.
Short-term: Bounce into wave B likely, targeting 3350–3600.
Strategy: A bull call spread provides a clean, limited-risk way to play this bounce, while respecting the larger bearish setup.
Disclaimer: This analysis is for educational purposes only and does not constitute investment advice. Please do your own research (DYOR) before making any trading decisions.

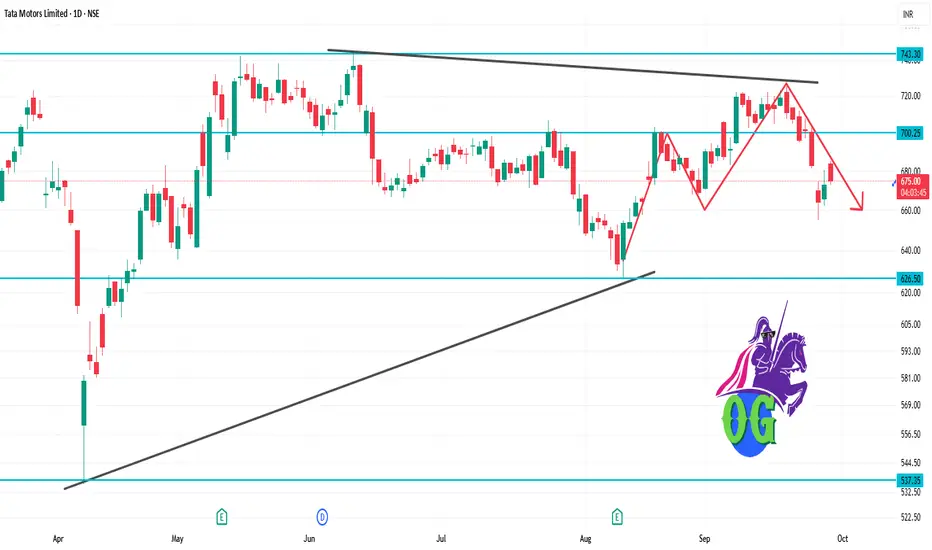
TATAMOTORS 1D Time frameCurrent Market Snapshot
Current Price: ₹675.60
Opening Price: ₹684.00
Day’s Range: ₹673.00 – ₹685.00
Previous Close: ₹672.90
🔑 Technical Indicators
Relative Strength Index (RSI): 48.5 – indicating a neutral condition.
Moving Average Convergence Divergence (MACD): -3.20 – suggesting bearish momentum.
Moving Averages: Trading below the 50-day and 200-day moving averages, indicating a bearish trend.
📈 Key Support & Resistance Levels
Immediate Support: ₹673
Immediate Resistance: ₹685
Pivot Point: ₹679
📉 Market Sentiment
Trend: The stock is trading below its 50-day and 200-day moving averages, indicating a bearish trend.
Volume: Trading volume is higher than average, suggesting increased investor activity.
📈 Strategy (1D Timeframe)
1. Bullish Scenario
Entry: Above ₹685
Stop-Loss: ₹673
Target: ₹690 → ₹695
2. Bearish Scenario
Entry: Below ₹673
Stop-Loss: ₹685
Target: ₹665 → ₹660
⚠️ Risk Management
Limit risk to 1% of capital per trade.
Always use stop-loss to protect against unexpected market movements.
Monitor broader market trends and sector-specific news that may impact stock performance.
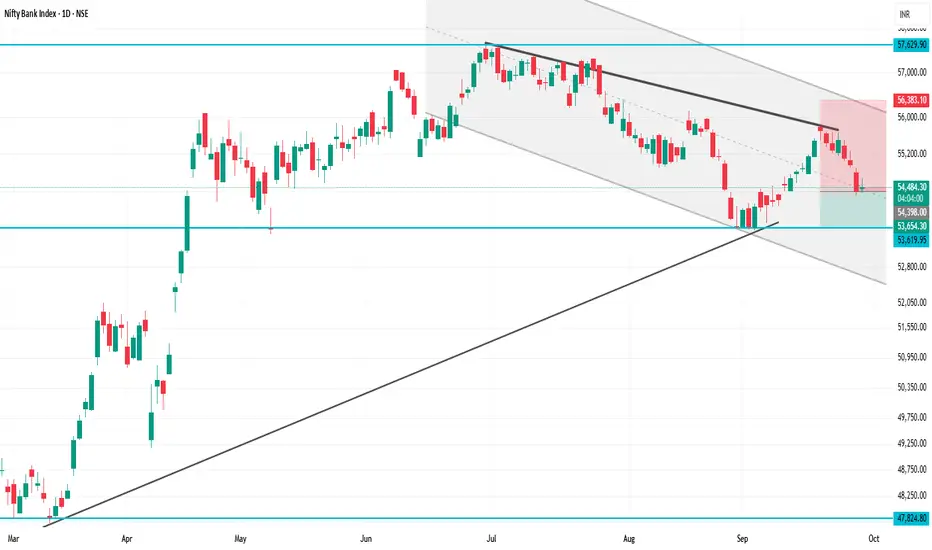
BANKNIFTY 1D Time frameCurrent Level: ₹54,651
Opening Level: ₹54,460
Day’s Range: ₹54,366 – ₹54,686
🔑 Key Support & Resistance
Immediate Support: ₹54,500
Immediate Resistance: ₹54,800
Pivot Point: ₹54,651
📈 Strategy (1D Timeframe)
1. Bullish Scenario
Entry: Above ₹54,800
Stop-Loss: ₹54,500
Target: ₹55,100 → ₹55,300
2. Bearish Scenario
Entry: Below ₹54,500
Stop-Loss: ₹54,800
Target: ₹54,300 → ₹54,100
⚠️ Risk Management
Limit risk to 1% of capital per trade.
Always use stop-loss to protect against unexpected market moves.
Watch sector news and broader market trends that can impact BANKNIFTY.
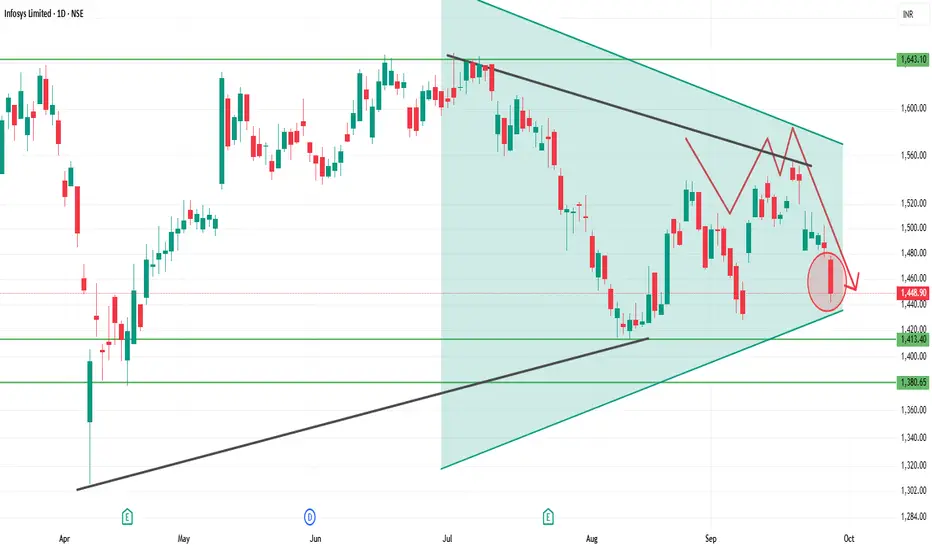
INFY 1D Time frameCurrent Zone: Around ₹1,448 – 1,450 (important support area).
Support Levels:
First support: ₹1,440 – ₹1,448
Next deeper support: ₹1,410 – ₹1,420
Resistance Levels:
Immediate resistance: ₹1,475 – ₹1,485
Strong resistance: ₹1,500 – ₹1,510
Trend Outlook:
Holding above ₹1,448 can trigger a short-term bounce.
Weakness below ₹1,440 may drag it toward ₹1,410.
A close above ₹1,485 would open upside toward ₹1,510+.
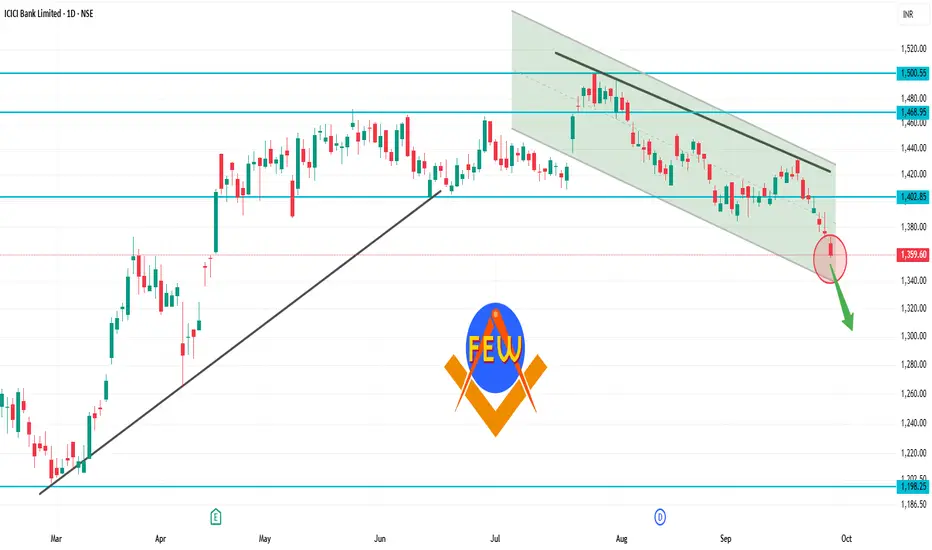
ICICIBANK 1D Time frameClosing Price: ₹1,363.00
Day's Range: ₹1,357.00 – ₹1,372.70
Previous Close: ₹1,375.80
Volume: 18,342,280 shares traded
Market Cap: ₹971,186 crore
52-Week High: ₹1,500.00
52-Week Low: ₹1,186.00
Face Value: ₹2.00
Beta: 0.90
🧾 Financial Highlights
P/E Ratio (TTM): 18.36
P/B Ratio: 3.12
EPS (TTM): ₹74.04
Dividend Yield: 0.81%
ROE: 17.05%
Book Value: ₹436.56
📈 Technical Insights
Trend: The stock is approaching its 200-day moving average, a key technical indicator. A bounce from this level could signal a buying opportunity, while a breakdown may suggest further downside risk.
Support Levels: ₹1,357.00, ₹1,350.00
Resistance Levels: ₹1,375.00, ₹1,400.00
📌 Key Takeaways
Recent Performance: ICICI Bank's stock declined by 0.91%, underperforming the broader market.
Analyst Sentiment: Despite recent volatility, ICICI Bank remains a top pick among analysts for long-term investment.
SENSEX 1D Time frameCurrent Snapshot
Closing / Current Level: ~ ₹ 80,426.46
Day’s Range: High ~ ₹ 81,033, Low ~ ₹ 80,332
Open: ~ ₹ 80,956
⚡ Strategy Thoughts
Bullish approach:
If it recovers above ~80,700 and holds, targets can be 81,000 → 81,300.
Bearish / defensive view:
If Sensex fails near 80,700–81,000, or breaks below ~80,300, downside toward 79,800 and lower comes into play.
Range play:
Between 80,300 and 80,700, you can trade both sides — buy near the bottom of the range, short near resistance — but use tight stops.
