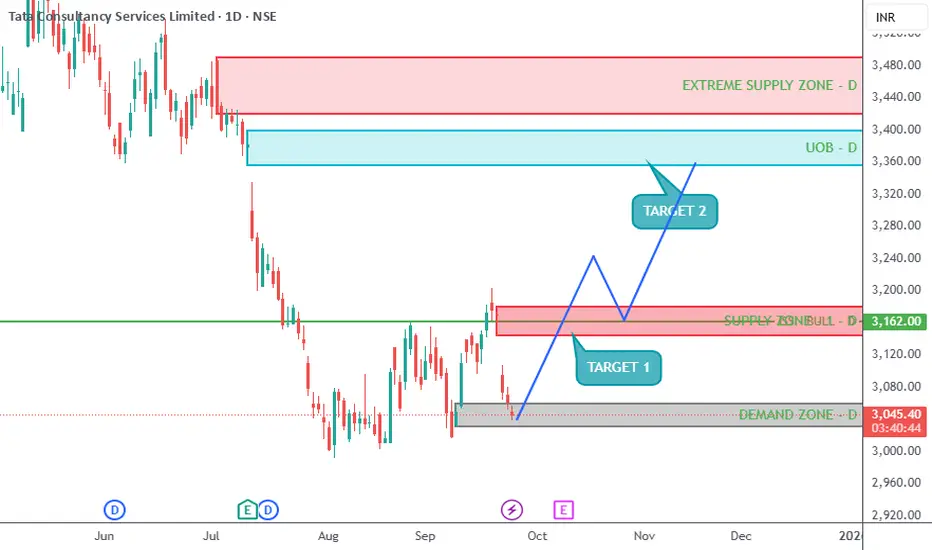
BULLISH TREND - TCS - CASH OR OCT FUTURETCS is being respected at the extreme demand zone and now upside movement will start. TCS can be bought with the stoploss of 3000 and extreme target of 3500. INTERMEDIATE target of 3150-3300 are also there.
TOTAL BULLISH ON TCS TILL NOVEMBER 2025
📉 THIS CHANNEL IS ONLY FOR EDUCATIONAL PURPOSES.
Disclaimer: I am Not a SEBI registered analyst. I just share my positions to do paper trading and no where its a recommendation! Please do your own analysis before taking any trade.
TCS
LT 1D Time frameClosing Price: ₹3,644.40
Day’s Range: ₹3,635.70 – ₹3,704.00
Previous Close: ₹3,657.60
Change: Down –0.80%
52-Week Range: ₹2,965.30 – ₹3,963.50
Market Cap: ₹5.13 lakh crore
P/E Ratio (TTM): 32.31
Dividend Yield: 0.93%
EPS (TTM): ₹112.81
Beta: 1.20 (indicating moderate volatility)
🔑 Key Technical Levels
Immediate Support: ₹3,635 – ₹3,640
Immediate Resistance: ₹3,700 – ₹3,710
52-Week High: ₹3,963.50
52-Week Low: ₹2,965.30
📈 Technical Indicators
RSI (14-day): 45.2 – indicating a neutral condition.
MACD: Negative, suggesting bearish momentum.
Moving Averages: Trading below the 50-day and 200-day moving averages, indicating a bearish trend.
📉 Market Sentiment
Recent Performance: L&T experienced a decline of 0.80% on September 25, 2025, underperforming the broader market.
Volume: Trading volume was significantly higher than its 20-day average, indicating increased investor activity.
📈 Strategy (1D Timeframe)
1. Bullish Scenario
Entry: Above ₹3,700
Stop-Loss: ₹3,635
Target: ₹3,750 → ₹3,800
2. Bearish Scenario
Entry: Below ₹3,635
Stop-Loss: ₹3,700
Target: ₹3,600 → ₹3,550

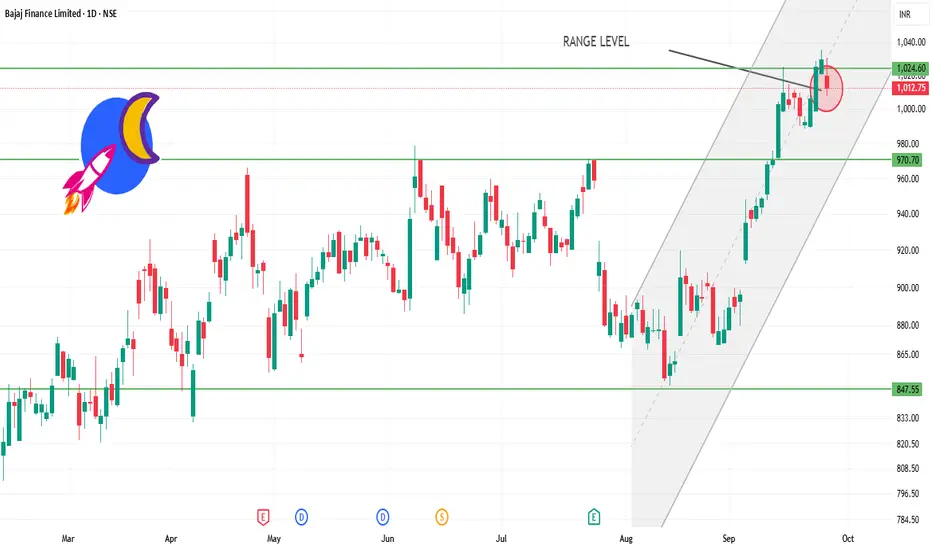
BAJFINANCE 1D time frame📊 Daily Snapshot
Closing Price: ₹1,012.75
Day’s Range: ₹1,008.00 – ₹1,031.10
Previous Close: ₹1,029.75
Change: Down –1.66%
52‑Week Range: ₹645.10 – ₹1,036.00
Market Cap: ₹6.31 lakh crore
P/E Ratio: 36.2
Dividend Yield: 2.76%
EPS (TTM): ₹28.04
Beta: 1.14 (indicating moderate volatility)
🔑 Key Technical Levels
Support Zone: ₹1,008.00 – ₹1,015.00
Resistance Zone: ₹1,031.00 – ₹1,036.00
All-Time High: ₹1,036.00
📈 Technical Indicators
RSI (14-day): 42.88 – approaching oversold territory, suggesting potential for a rebound.
MACD: Positive at 2.46, indicating bullish momentum.
Moving Averages: Trading above the 50-day and 200-day moving averages, indicating an overall uptrend.
📉 Market Sentiment
Recent Performance: Bajaj Finance experienced a decline of 1.66% on September 25, 2025, underperforming the broader market.
Volume: Trading volume was significantly higher than its 50-day average, indicating increased investor activity.
📈 Strategy (1D Timeframe)
1. Bullish Scenario
Entry: Above ₹1,031.00
Stop-Loss: ₹1,008.00
Target: ₹1,045.00 → ₹1,050.00
2. Bearish Scenario
Entry: Below ₹1,008.00
Stop-Loss: ₹1,015.00
Target: ₹995.00 → ₹990.00
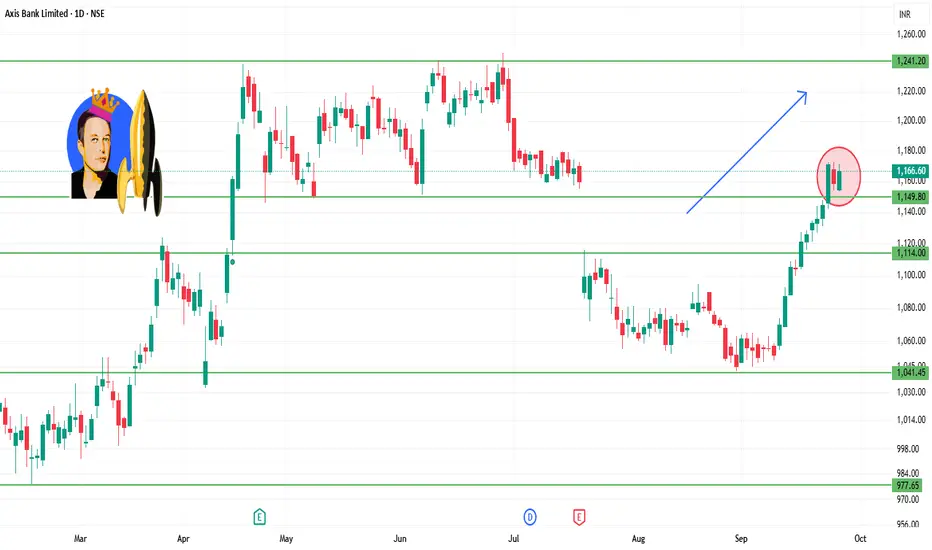
AXISBANK 1D Time frame📊 Daily Snapshot
Closing Price: ₹1,166.10
Day’s Range: ₹1,153.40 – ₹1,171.80
Previous Close: ₹1,158.80
Change: Up +0.28%
52-Week Range: ₹933.50 – ₹1,281.65
Market Cap: ₹3.59 lakh crore
P/E Ratio: 12.9
Dividend Yield: 1.2%
EPS (TTM): ₹90.00
Beta: 1.1 (moderate volatility)
🔑 Key Technical Levels
Immediate Support: ₹1,153.33
Immediate Resistance: ₹1,153.33
Weekly Outlook: Immediate support at ₹1,109.23; major support at ₹1,082.57; immediate resistance at ₹1,153.33; major resistance at ₹1,170.77.
📈 Analyst Insights
Intrinsic Value: Estimated at ₹1,511.77 based on median valuation models, suggesting the stock is trading below its fair value.
📈 Strategy (1D Timeframe)
1. Bullish Scenario
Entry: Above ₹1,153.33
Stop-Loss: ₹1,109.23
Target: ₹1,170.77 → ₹1,200.00
2. Bearish Scenario
Entry: Below ₹1,109.23
Stop-Loss: ₹1,153.33
Target: ₹1,082.57 → ₹1,050.00
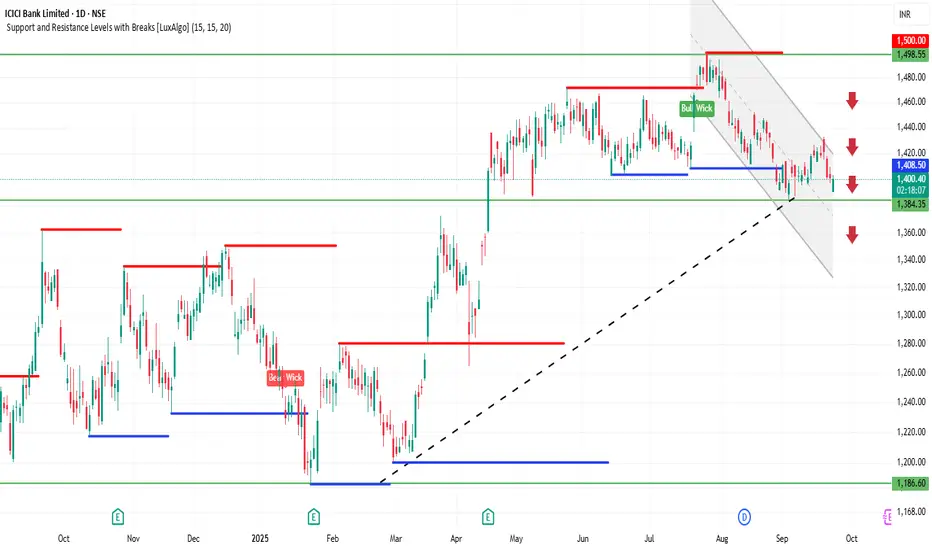
ICICIBANK 1D Time frame📍 Today’s Expected Range (Intraday Approximation)
Expected High: ₹1,403–₹1,410
Expected Low: ₹1,391–₹1,385
These are approximate intraday levels. Actual prices may fluctuate slightly due to market volatility.
🔍 Key Points
Current price: ₹1,400–₹1,401, close to resistance.
If price breaks above ₹1,410 with strong volume → bullish momentum likely.
If price drops below ₹1,385 → short-term correction or pullback possible.
📊 Suggested Trading Strategy
Bullish Scenario
If ICICI Bank breaks ₹1,403–₹1,410, you can buy, targeting ₹1,420–₹1,430.
Stop-loss: ₹1,395
Bearish Scenario
If ICICI Bank drops below ₹1,385, you can sell/short, targeting ₹1,375–₹1,370.
Stop-loss: ₹1,390
Range-Bound / Sideways
If price trades between ₹1,385–₹1,403, it’s better to wait and avoid trading until a clear breakout occurs.
💡 Summary
Resistance Zone: ₹1,403–₹1,410
Support Zone: ₹1,385–₹1,391
Strategy: Trade in the direction of the breakout, and always use stop-loss to manage risk.
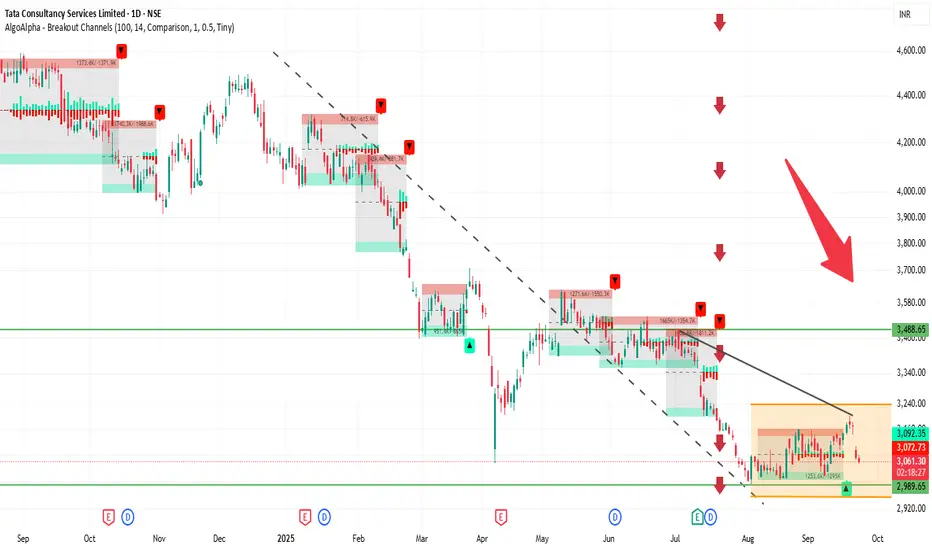
TCS 1D Time frame📍 Current Price & Range
Current price: ₹3,063.80
Day’s High / Low: ₹3,106.90 / ₹3,052.00
52-week High / Low: ₹4,494.90 / ₹2,991.60
🔍 Key Levels
Immediate resistance: ₹3,100–₹3,110
Next resistance: ₹3,200–₹3,250
Immediate support: ₹3,050–₹3,060
Psychological / strong support: ₹3,000
📊 Indicators & Momentum
Price is just below near-term resistance, showing hesitation.
Short-term trend is neutral to slightly bearish; momentum is weak.
RSI and MACD suggest neutral to weak momentum, no strong reversal yet.
Stock is trading well below its 52-week high, indicating it has already corrected significantly.
🔮 Possible Scenarios
Bullish breakout → Sustaining above ₹3,110 could push price toward ₹3,200–₹3,250.
Sideways / consolidation → Likely to trade between ₹3,050–₹3,110 if no strong catalyst.
Bearish pullback → Breaking below ₹3,050 may take price toward ₹3,000, and further down to ₹2,950–₹2,900 if weakness continues.
👉 Outlook: At the current level (₹3,073.80), TCS is in a neutral zone. The next directional move depends on either a breakout above resistance or a fall below support.
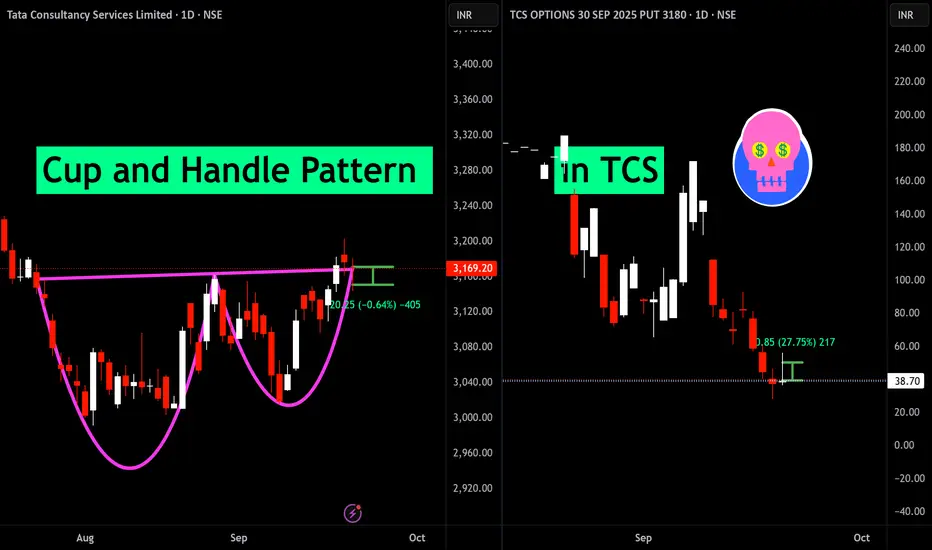
Cup and Handle Pattern failed in TCSThe cup and handle pattern has formed, but the anticipated breakout has not materialized. This failed breakout may indicate the potential for further downside movement in the stock
KOTAKBANK 1D Time frame🔍 Current Price & Context
Current Price: ₹2,034.10
Day’s Range: ₹2,027.40 – ₹2,054.60
52-Week Range: ₹1,679.05 – ₹2,301.90
Previous Close: ₹2,031.00
Market Cap: ₹4,04,634 Cr
P/E Ratio: 21.10
Dividend Yield: 0.12%
Beta: 0.97
📊 Technical Indicators
Relative Strength Index (RSI): Approximately 49.64, indicating a neutral stance.
MACD: Positive, suggesting bullish momentum.
Moving Averages:
5-Day: ₹2,032.84
50-Day: ₹2,012.95
200-Day: ₹1,984.69
Pivot Points:
S1: ₹2,029.97
Pivot: ₹2,036.07
R1: ₹2,042.17
🧮 Strategy / Trade Ideas
Long Setup:
Entry: Consider entering near support levels (~₹2,020) if bullish reversal signals appear.
Stop Loss: Place below ₹1,980 to manage risk.
Target: First resistance around ₹2,042, then ₹2,070.
Short Setup:
Entry: If price fails to break above resistance (~₹2,042) and shows signs of reversal.
Stop Loss: Above ₹2,080.
Target: Downside toward ₹2,020, then ₹1,990.

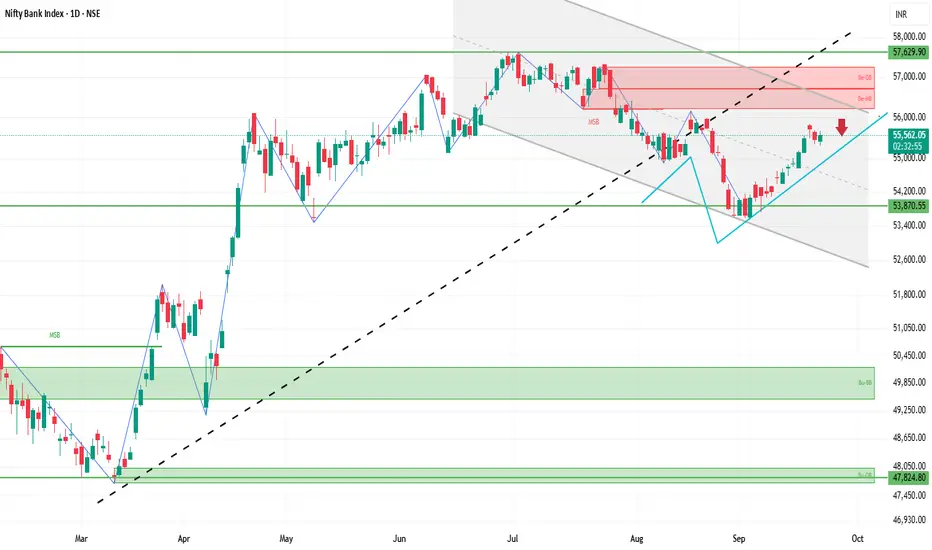
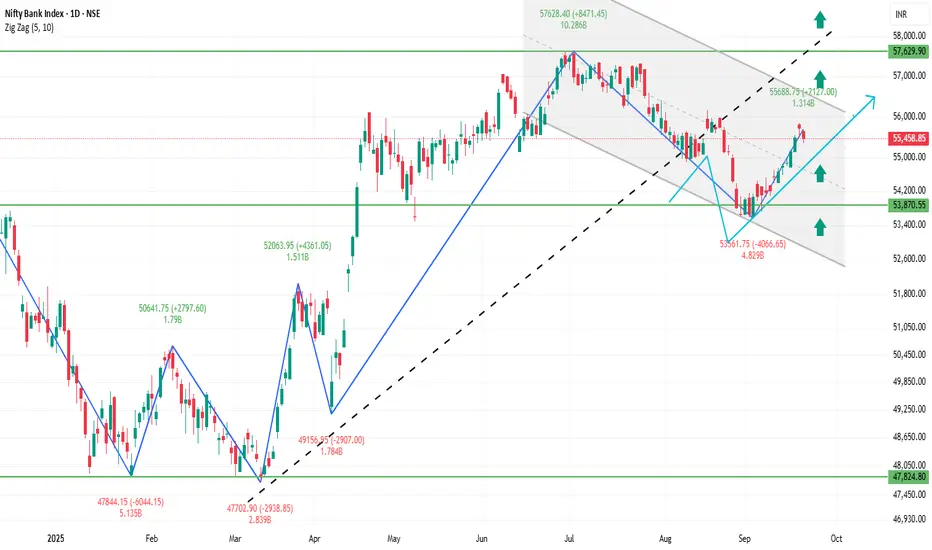
BANKNIFTY 1D Time frame🔍 Current Market Snapshot
Current Level: ₹55,541.30
Day’s Range: ₹55,315.55 – ₹55,666.35
52-Week Range: ₹47,702.90 – ₹57,628.40
Previous Close: ₹55,458.85
Market Sentiment: Neutral to mildly bearish
📊 Technical Indicators
Moving Averages: The BANKNIFTY index is trading slightly below its short-term moving averages, indicating potential resistance.
RSI (14): Approximately 50, suggesting a neutral stance with no clear overbought or oversold conditions.
MACD: Neutral, with the MACD line and signal line close together, indicating indecision in market momentum.
Stochastic Oscillator: Neutral, fluctuating around the midline, reflecting a lack of strong directional movement.
🧮 Strategy / Trade Ideas
Long Setup:
Entry: Consider entering near support levels (~₹55,300) if bullish reversal signals appear.
Stop Loss: Place below ₹54,800 to manage risk.
Target: First resistance around ₹55,800, then ₹56,200.
Short Setup:
Entry: If price fails to break above resistance (~₹55,800) and shows signs of reversal.
Stop Loss: Above ₹56,300.
Target: Downside toward ₹55,300, then ₹54,800.
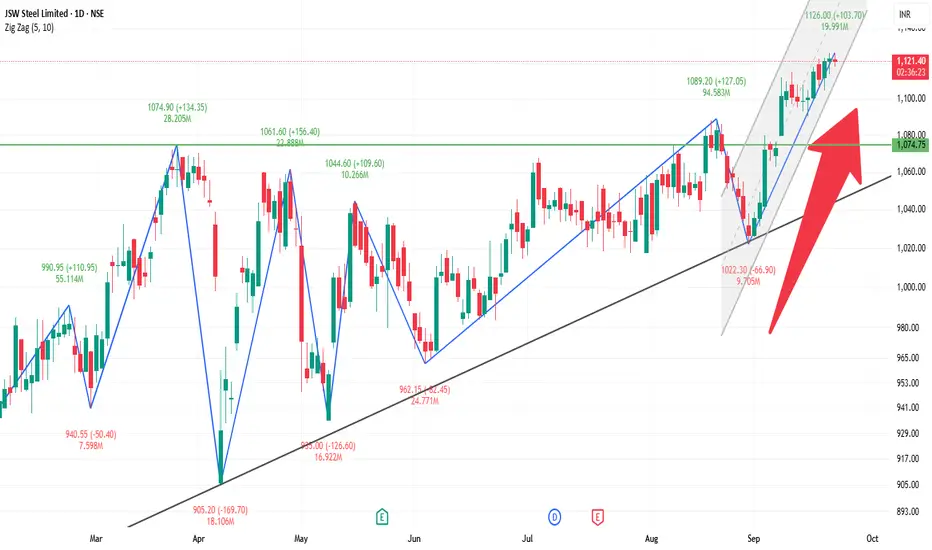
JSWSTEEL 1D Time frame🔍 Current Price
Trading around ₹1,119 – ₹1,120
⚙️ Key Levels (Daily)
Immediate Resistance 1: ₹1,125 – ₹1,130
Next Resistance 2: ₹1,133
Immediate Support 1: ₹1,116 – ₹1,117
Support 2: ₹1,110 – ₹1,113
Deeper Support (Positional): ₹1,072
🧮 Base Strategy Application
Long Setup:
Entry: Near current levels (~₹1,120) if it holds above ₹1,116
Stop Loss: Below ₹1,110
Targets: ₹1,125 – ₹1,130 (short-term), then ₹1,133
Short Setup (Reversal):
If rejection happens near ₹1,125 – ₹1,130 zone
Target: ₹1,116 first, then ₹1,110
Breakout Setup:
If price breaks and sustains above ₹1,133 with volume
Potential for further upside beyond recent highs
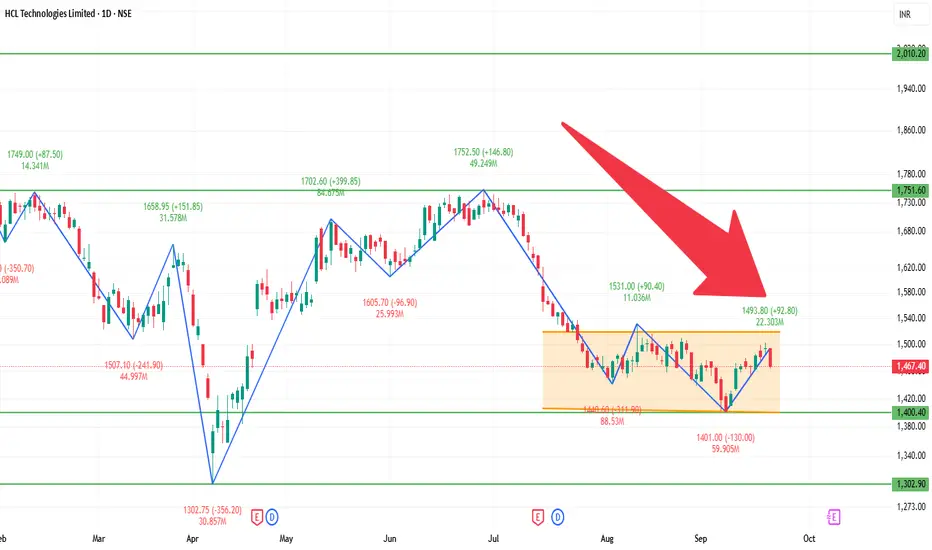
HCLTECH 1D Time frame📊 Current Overview
Price is trading near ₹1,460 – ₹1,470 range.
Trend on the daily chart is showing weakness.
Stock is trading below most key moving averages (50-day, 100-day, 200-day).
🔍 Support & Resistance
Immediate Support: ₹1,450
Next Support: ₹1,430 – ₹1,420
Immediate Resistance: ₹1,470 – ₹1,475
Higher Resistance: ₹1,490 – ₹1,500
📈 Indicators
RSI (14): Neutral to slightly bearish, around mid-40s.
MACD: Weak, showing bearish crossover or flat momentum.
Trend: More sideways to bearish unless resistance levels break.
🎯 Possible Scenarios
Bullish: If HCLTECH breaks and sustains above ₹1,475, it could target ₹1,490 – ₹1,500.
Bearish: If it fails and slips below ₹1,450, it may fall towards ₹1,430 – ₹1,420.
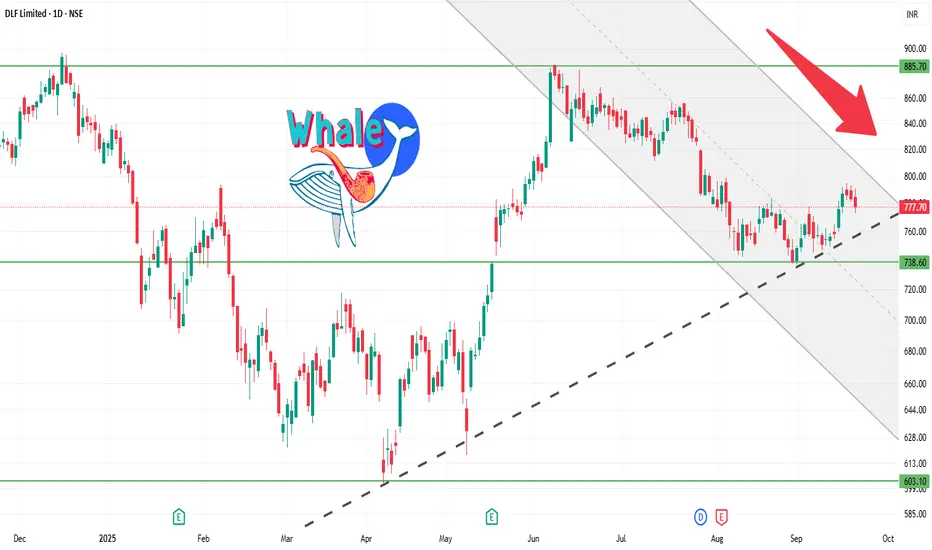
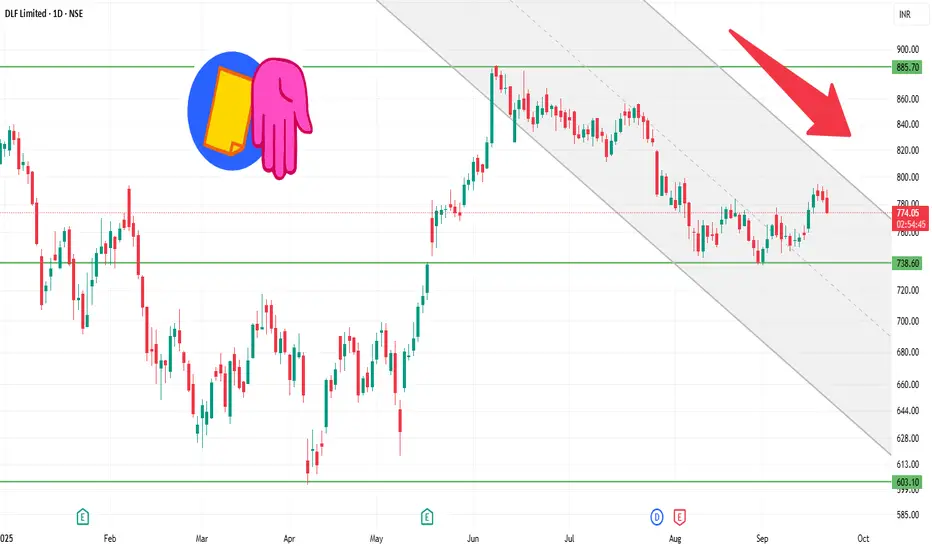
DLF 1D Time frameCurrent Price: Around 780 – 790.
Current Trend: Stock is in a strong uptrend, consolidating after recent highs.
Support Zone: Strong support at 770 – 775. Buyers are likely to defend this level.
Resistance Zone: Key resistance at 800 – 810. A breakout above this can lead to fresh upside.
Indicators: Daily candles show higher lows forming, indicating strength; volumes are healthy.
Outlook:
Above 810 → bullish momentum may continue toward 830+.
Below 770 → weakness may drag it toward 750.
👉 In short:
Tone: Bullish with consolidation.
Range: 770 – 810.
Shall I also prepare a re
BANKNIFTY 1D Time frameCurrent Trend: BANKNIFTY is showing consolidation with mild bullish bias.
Support Zone: Strong support lies near 55,200 – 55,400. If this holds, buyers may remain active.
Resistance Zone: Key resistance is around 55,800 – 56,000. A breakout above this can bring strong momentum.
Indicators: Daily structure is stable; candles show demand near support zones.
Outlook:
Above 56,000 → fresh rally possible.
Below 55,200 → weakness can extend.
👉 In short:
Sideways to bullish.
Strength above 56,000, weakness below 55,200.
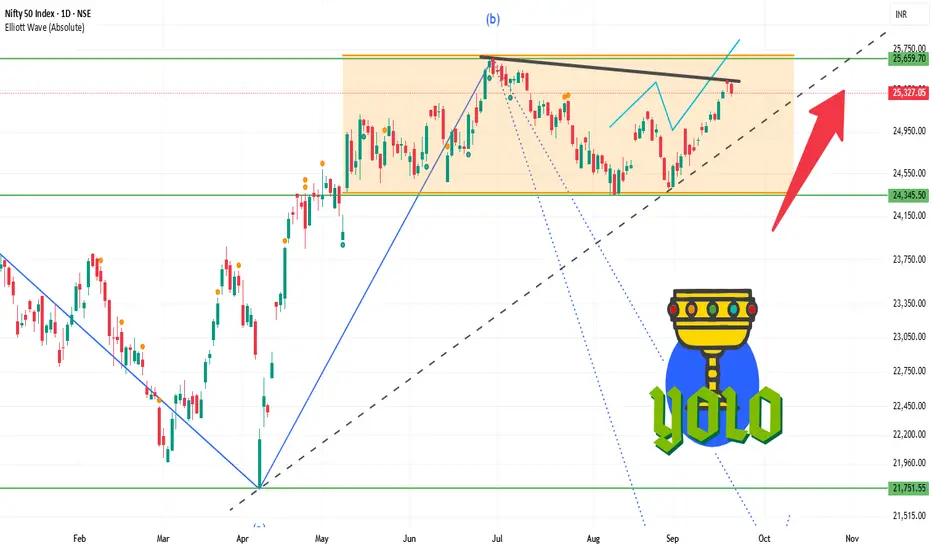
NIFTY 1D Time frameCurrent Trend: Market is moving sideways with limited momentum.
Support Zone: Strong support is around 25,200 – 25,250; bounce is possible from here.
Resistance Zone: If NIFTY sustains above 25,350 – 25,400, fresh upward momentum may come.
Indicators: Daily candle shows buyers are slightly in control, but resistance breakout is important.
Outlook: As long as NIFTY holds above 25,200, the uptrend remains safe. A close above 25,400 can trigger new buying.
👉 In short:
Sideways to bullish tone.
Weakness below 25,200, strength above 25,400.
DLF 1D Time frameCurrent
Price: ₹783.10 (as of last close)
52-Week Range: ₹601.20 – ₹929.00
Market Cap: ₹1.94 lakh crore
P/E Ratio: 43.26 (lower than sector average)
EPS (TTM): ₹18.12
Dividend Yield: 0.77%
Debt-to-Equity: 0.10 (very low)
ROE: 10.76%
ROCE: 6.51%
⚙️ Technical Indicators
RSI (14-day): 56.38 — Neutral to slightly bullish.
MACD: 4.28 — Positive, supporting bullish momentum.
Moving Averages: Trading above both 50-day and 200-day EMAs, indicating a long-term uptrend.
Trend Rating: Strong Buy, according to daily technical analysis.
📈 Short-Term Outlook
Bullish Scenario:
Entry: Above ₹800 with strong volume.
Targets: ₹820–₹825, ₹840–₹850.
Stop Loss: ₹780.
Bearish Scenario:
Entry: Below ₹780 with confirmation.
Targets: ₹760–₹765, ₹740–₹745.
Stop Loss: ₹800.
⚠️ Risks
Breakdown below ₹780: Could lead to a short-term correction toward ₹760–₹765.
Failure to break above ₹800: May result in consolidation or minor pullback.
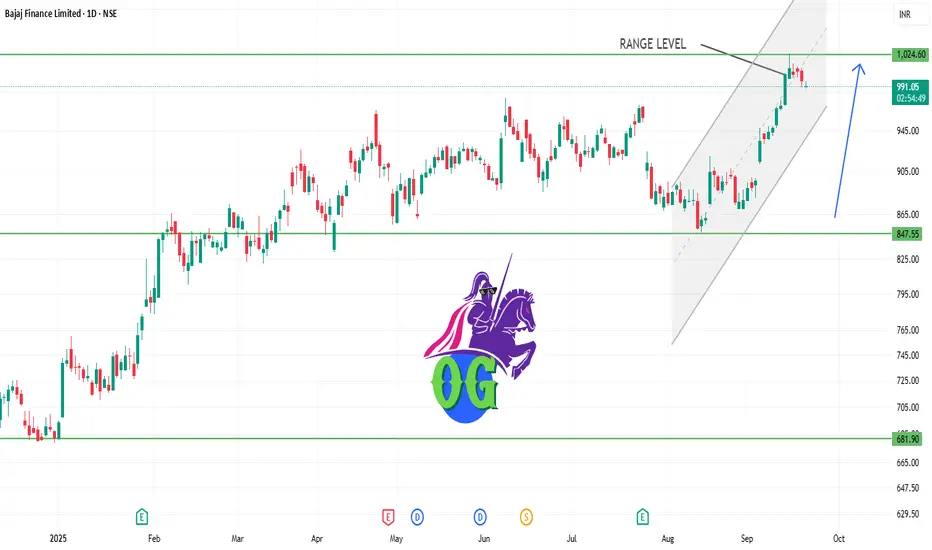
BAJFINANCE 1D Time frame1. Pivot Level
₹992 → key short-term pivot.
Above ₹992 → bullish bias.
Below ₹992 → bearish bias.
2. Bullish Setup (if price holds above ₹992)
Entry: Around ₹995–₹998 (after confirming bounce above pivot).
Target:
First target → ₹1,010–₹1,012
Second target → ₹1,020–₹1,025 (if momentum continues)
Stop Loss: ₹990 (just below pivot)
Risk/Reward: Good, roughly 2–3x potential vs stop.
3. Bearish Setup (if price falls below ₹992)
Entry: Around ₹990–₹988 (if close below pivot confirmed).
Target:
First target → ₹980
Second target → ₹965–₹960
Stop Loss: ₹995 (just above pivot)
Risk/Reward: Decent for short-term pullback trade.
4. Notes / Idea Logic
Why it works: ₹992 is acting as a short-term pivot — price respecting this shows strength; breaking it signals weakness.
Volume confirmation: If buying comes with strong volume → bullish; if selling is strong → bearish.
Time frame: This is mainly for 1–3 day trades on the daily chart.
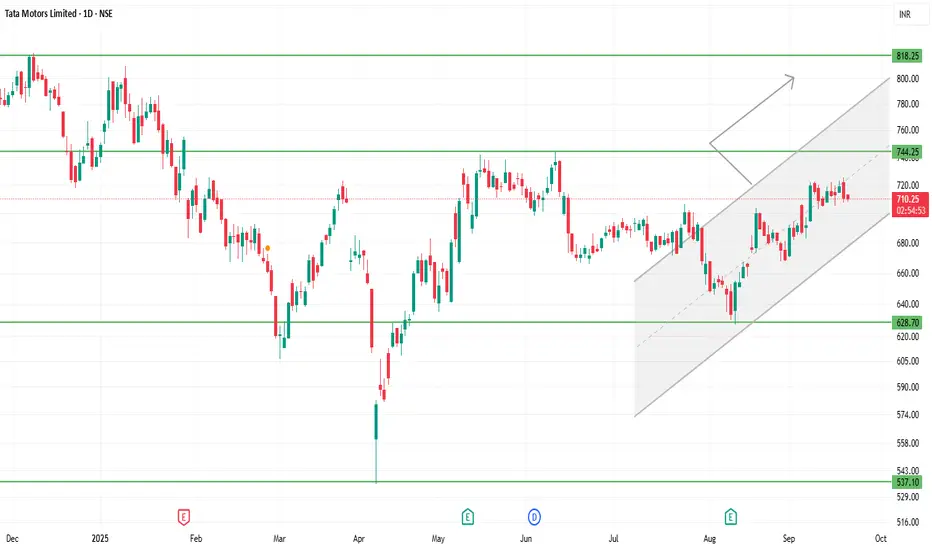
TATAMOTORS 1D Time frameTata Motors is trading around ₹710-₹720 (give or take).
The 52-week high is roughly ₹1,000+, and the 52-week low is approx ₹535-₹550.
There is visible investor concern: production halts (especially in JLR, its luxury arm) and demand pressures are weighing.
Recent performance is mixed; some short-term strength, but many indicators suggest resistance and caution.
⚙️ Technical / Trend Insights
The trend shows a mildly bullish bias in the short-term: price action is forming higher lows (e.g. holding above ₹700-705) which suggests buyers are defending downside.
Resistance zones are limiting gains: repeated attempts to push above ~₹720-725 have met selling.
Momentum indicators (RSI, MACD etc.) are positive but not deeply overbought — there’s room, but risk of pullbacks if resistance holds.
There are hints of bullish chart patterns (for example, ascending structures or potential reversal formations) if price manages to cross certain resistance levels.
⚠️ Risks / Things That Could Go Wrong
If it breaks down below ₹700-705, risk increases toward lower support in the ₹686-₹700 band.
Failure to break above ₹720-₹725 with decent volume could lead to sideways trading or minor corrections.
Macro / sectoral headwinds — demand issues, international business (JLR), cost pressures — could press down on fundamentals.
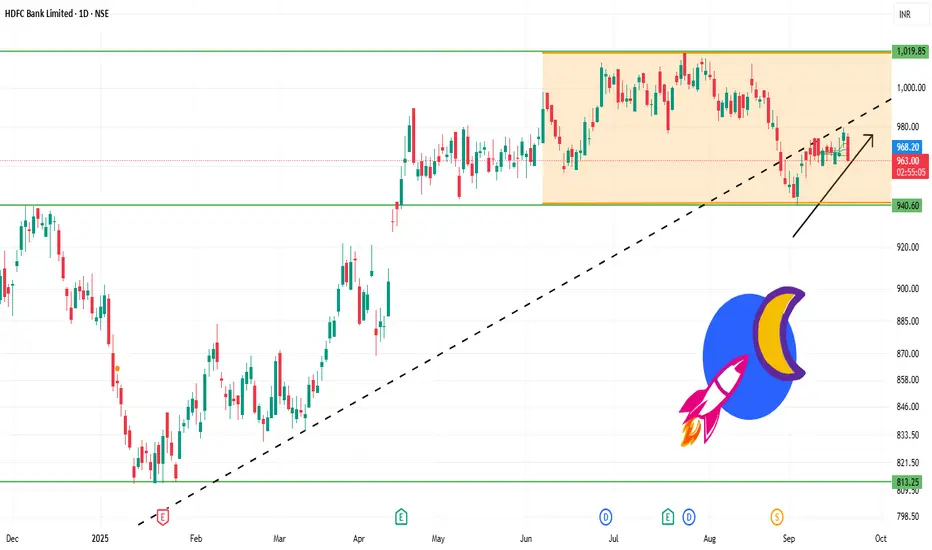
HDFCBANK 1D Time frameTrend
Trading around ₹967 – ₹970.
Stock is in a consolidation phase for the past few months.
Long-term trend is intact since it is above the 200-day moving average.
Support Levels
₹960 – ₹965 → immediate support zone.
₹945 – ₹950 → stronger support; if this breaks, stock may weaken further.
Resistance Levels
₹970 – ₹975 → immediate resistance; stock is struggling to cross this area.
₹980 – ₹992 → next major resistance; breakout above this could open path to ₹1,020.
Indicators
RSI near 55 → neutral to mildly bullish, not overbought.
MACD positive, showing some upward momentum.
Short-term moving averages are mixed, but long-term support remains strong.
Price Action
Range-bound between ₹960 – ₹975.
Breakout or breakdown from this range will decide the next trend.
✅ Facts & Insights
Fact 1: Above ₹975, HDFC Bank can rally towards ₹980 – ₹992 and possibly ₹1,020.
Fact 2: Below ₹960, stock may slip to ₹945 – ₹950, and deeper to ₹920 – ₹900 if weakness continues.
Fact 3: Long-term outlook remains positive, but short-term is sideways until a breakout.
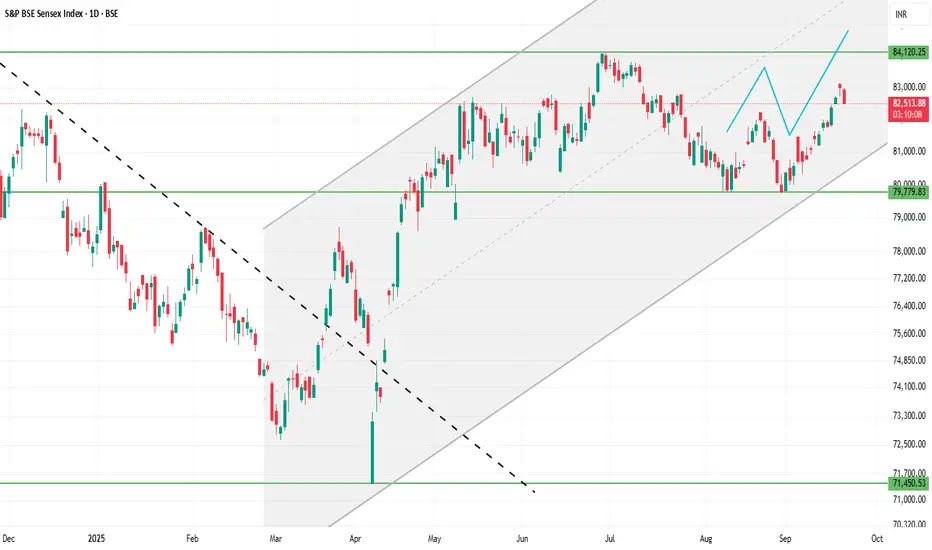
SENSEX 1D Time frameCurrent Facts
Current Level: 82,590.45 - 82,616.13
Trend: Mildly bullish; trading above short-term moving averages (20-day & 50-day EMA).
Momentum Indicators:
RSI (14-day): ~60 → bullish but not overbought.
MACD: Positive → supporting the uptrend.
Price Action: Daily candles show small upper wicks → minor profit-taking near resistance.
⚙️ Outlook
Bullish Scenario:
Holding above 82,450 → retest 82,650–82,700 and possibly 82,850–82,900.
Range / Consolidation:
Price oscillates between 82,400 – 82,650 → sideways trading likely.
Bearish Scenario:
Close below 82,400 → downside risk toward 82,250–82,300 or lower.
⚠️ Key Facts
82,500–82,600 acts as a short-term pivot: above it favors bulls, below it favors bears.
Resistance at 82,650–82,700 is key; breakout here may trigger further upside.
Support at 82,400–82,450 is critical; failing to hold may lead to short-term correction.
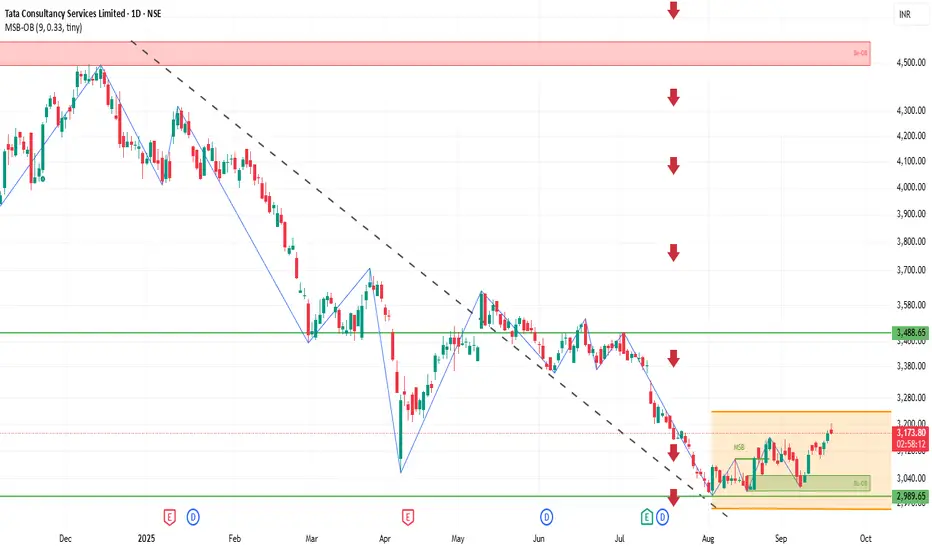
TCS 1D Time frameCurrent Snapshot
Price: ₹3,174
Stock has moved above earlier resistance zones (₹3,150 – ₹3,170).
Momentum looks positive, buyers are holding strength.
📌 Key Levels
Immediate Resistance: ₹3,190 – ₹3,200
Next Resistance: ₹3,220 – ₹3,250
Immediate Support: ₹3,150 – ₹3,160
Stronger Support: ₹3,100 – ₹3,120
✅ Outlook
If TCS sustains above ₹3,170, it can extend the rally toward ₹3,200 – ₹3,220.
If it slips back below ₹3,160, consolidation may happen around ₹3,120 – ₹3,150.
Larger trend remains bullish as long as price stays above ₹3,100.
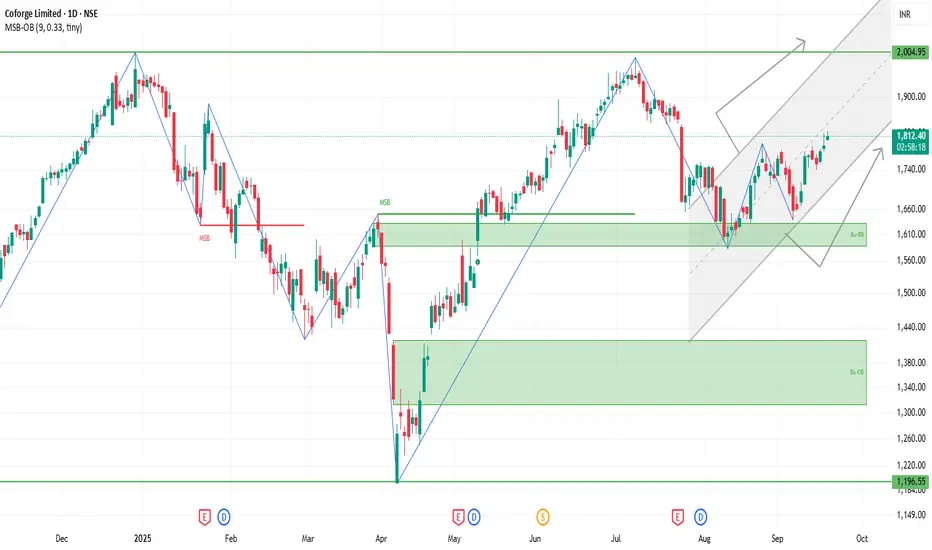
COFORGE 1D Time frameCurrent Snapshot
Price is trading near ₹1,812.
Stock is showing good strength above short-term and long-term moving averages.
Volatility is moderate, so sharp intraday swings are possible.
⚙️ Indicators / Momentum
Moving Averages: All key averages (short, medium, long) are bullish.
MACD / Momentum: Positive, supporting upside.
RSI: Slightly high, showing strength but near overbought zone → chances of small pullback.
📌 Key Levels
Immediate Resistance: ₹1,820 – ₹1,835.
Immediate Support: ₹1,790 – ₹1,800.
Stronger Support: ₹1,750 – ₹1,760 if weakness extends.
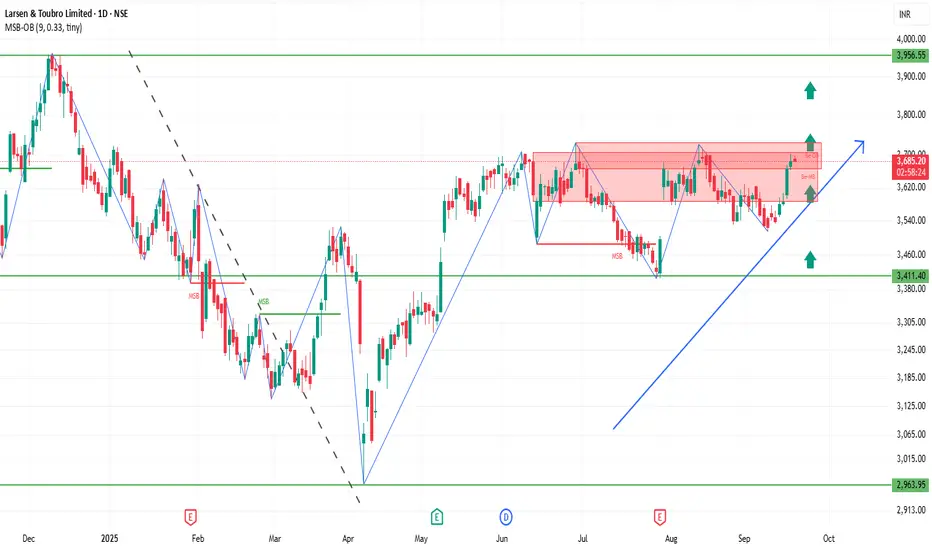
LT 1D Time frameCurrent Snapshot
Price: ₹3,695 (slightly higher than yesterday’s level).
Stock is holding near resistance but still above strong supports.
Trend is bullish to sideways.
📌 Key Levels
Immediate Resistance: ₹3,740 – ₹3,800.
Immediate Support: ₹3,650 – ₹3,670.
Stronger Support: ₹3,600, and deeper support near ₹3,100 on longer timeframe.
✅ Outlook
If LT sustains above ₹3,670, bulls remain strong and a breakout above ₹3,740 could push toward ₹3,800+.
If it falls below ₹3,650, then short-term weakness may test ₹3,600.
As long as it stays above ₹3,600, the larger trend remains intact.
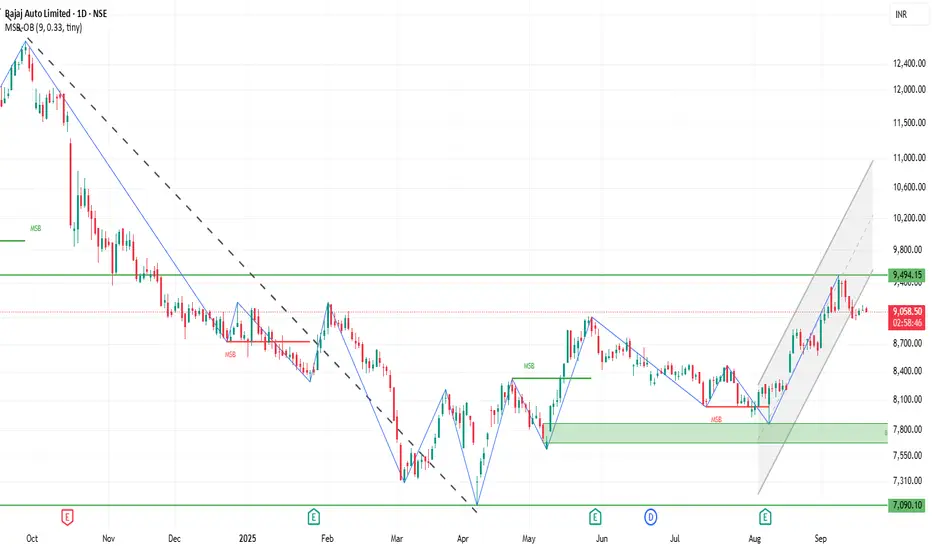
BAJAJ_AUTO 1D Time frameCurrent Snapshot
Price is trading around ₹9,080 – ₹9,100.
Stock is moving above both 50-day and 200-day moving averages, showing a steady uptrend.
It is still below its all-time high, so recovery space remains.
⚙️ Indicators / Momentum
RSI: Neutral, neither overbought nor oversold.
MFI (Money Flow Index): Balanced, showing moderate buying pressure.
Momentum: Stable with a slightly bullish bias.
📌 Key Levels
Immediate Resistance: ₹9,300 – ₹9,400.
Immediate Support: ₹8,800 – ₹9,000.
Stronger Support: Near ₹7,500 on longer-term charts.
✅ Outlook
Trend remains mildly bullish as long as price stays above ₹9,000.
Break above ₹9,400 could push price toward new highs.
Fall below ₹8,800 may lead to deeper correction.